A second look at the prospects for persistent price inflation in our future.

The blog post I published this past week about reports of recent price hikes and what this might portend for the future has sparked some interesting feedback and comments.  Based on that feedback, it appears that feelings are mixed on whether we’re poised to  be entering a period of prolonged inflation. 

Responses from two people in particular are worth highlighting for the “countervailing views” that they espouse.  I think both have merit.

The first response came from my brother, Nelson Nones, who has lived and worked outside the United States for decades.  His perspectives are interesting because, while fully understanding domestic events and policies, he also brings an international orientation to the discussion due to his own personal circumstances.  Nelson is looking to history for his perspectives on the inflation issue, offering these comments:

The chart below shows annual U.S. CPI percentage change for the past 106 years:

Note:  See https://www.usinflationcalculator.com/inflation/consumer-price-index-and-annual-percent-changes-from-1913-to-2008/ for source data.

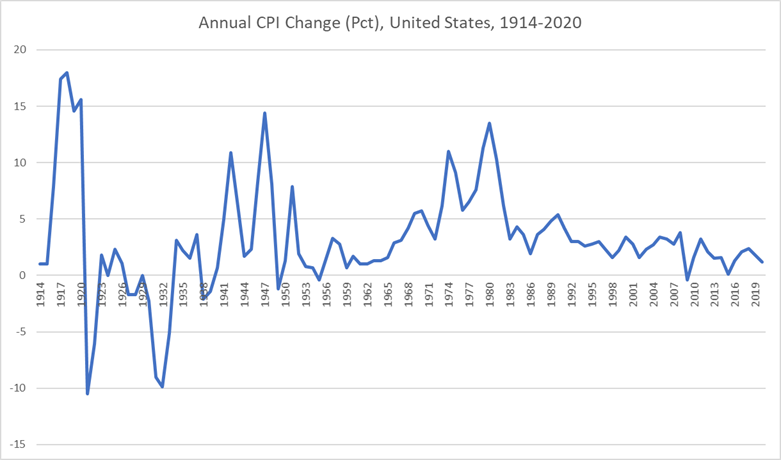
Projecting the latest (April 2021) Consumer Price Index forward to an entire year suggests that the U.S. will experience a 3.1% inflation rate in 2021.  That would be higher than in any year since 2011, which was a bounce-back year following the Great Recession.  Otherwise, the generic inflation trend has been consistently down since 1982 (nearly 40 years).

If the historical trends are any guide, and if we are indeed entering a persistent inflationary phase, it would take another decade before inflation growth approaches the levels seen during the 1970s.

But I think the likeliest scenario is experiencing a sharp uptick this year due to pent-up demand following the COVID-19 pandemic that will causie spot shortages, followed by resumption of a downward trend over the following ten years or so.

That’s similar to the pattern you can observe in the chart [above] during the years following the end of World War II, which had also created massive pent-up consumer demand.

Consider that the coronavirus pandemic hasn’t really altered the underlying economic fundamentals. The past 40 years has witnessed an explosion of manufacturing capacity in China and other developing countries, and that hasn’t gone away.  Meanwhile, dependency on oil — a key driver of inflation in the 1970s — has shrunk due to improved energy efficiency and aggressive exploitation of renewable energy resources, which for all practical purposes are in infinite supply.

Another factor, which doesn’t get as much attention as it probably should, is declining birth rates and aging of the population on a global scale, leading to a slower rate of population growth in the future that may constrain demand for consumer products in comparison to the past century. Let’s face it — we old farts just don’t consume as much as growing families do!

So yes, we should keep an eye on inflation — but I don’t think we’re in for a repeat performance of the horrible 1970s.

Echoing Nelson’s thoughts are the perspectives of another business veteran — an editor and publisher who has been intimately involved in the commercial/B-to-B field for decades.  Here is what he wrote to me:

I don’t want to get into a public debate with the inflationistas because I will never convince them that this is likely not a replay of the 1970s and early 80s inflationary period pre-[Paul] Volcker.  (Speaking personally, I didn’t own a house until I was 42 for the very reasons you cited in your blog post, and I was just a lowly editor back then.)

What we’re seeing today is simply the price shock of suddenly soaring demand, aggravated in the case of some commodities such as steel by Trump-era tariffs.

All commodities are tied to the price of crude oil, the most volatile of all commodities, which is long-denominated in U.S. dollars. WTI crude pricing is now at around $63 per bbl. — about where it was in early 2020 before the pandemic hit. It went negative for a time during the worst period of the crash in worldwide demand that was brought about by the pandemic. Tanks couldn’t be found into which to put the excess crude coming out of the ground from U.S. fracking. Traders freaked out, as they sometimes do.

So naturally, the percentage changes today look jaw-dropping. I can go through all the other commodities mentioned in your post and provide simple explanations as to why each is currently on the rise. Logistical bottlenecks are a big problem with everything — but as with oil, most of the issue is the sudden surge in demand as the pandemic winds down even as production and logistics aren’t yet prepared to fulfill the need.

In other words, the situation has very little to do with government spending — especially since most of the infrastructure money isn’t even allocated, let alone spent. Also, the Biden administration has yet to raise a single tax. It can’t. Only the House Ways and Means Committee can initiate tax changes, and those must then go through the Senate to become law. Senate Minority Leader McConnell and his allies have made sure nothing has gotten through.  

Of course, it never hurts to keep an eye on things — especially with structural inflation as you noted in your article.  But it’s important to look also at other, broader data. The Producer Price Index in April did reflect the increase in commodities prices, but the Consumer Price Index, even though it had a month of robust increases, remains below 3% annualized. And the Personal Consumption Expenditure Price Index, which is what the Fed pays attention to the most, is still tracking under 2% on an annualized basis. (A little inflation can be a good thing, actually.)

On the income side, average wage rates aren’t rising; they’re more likely to be falling in the future as low-wage service workers, including those in foodservice, re-enter the market.

So in my view the things people see with inflation are most likely short-term issues. Let’s look at it again in six months to a year. I’d also suggest that people read economist Paul Krugman’s columns in the New York Times for a bit of perspective that’s counter to the views of the inflationistas, if only for balance. The monetarists have been wrong since Volcker squeezed out the inflationary spiral. It was painful, though — so we’ll want to keep an eye on things.

Considering the views put forward above, I think it’s fair to conclude that “the jury’s out” on whether we’re actually entering a prolonged inflationary period.  If you have additional thoughts or perspectives to share on either side of the issue, I’m sure other readers would be interested to hear them.  Feel free to leave a comment below.

The predictable — and unexpected — economic consequences of COVID.

As the United States emerges from the COVID crisis, the shape of the American economy is coming into clearer view.  Part of that picture is the growing realization that lockdown policies, vaccination rollouts and government stimulus actions have created imbalances in many sectors — imbalances that will time to return to equilibrium.

Everyone knows the business sectors that have been hammered “thanks” to COVID:  hospitality and foodservice, travel and tourism, the performing arts, sports and recreation, commercial real estate. 

At the same time, other corners of the economy have blossomed — home remodeling, consumer electronics … and the public sector.  This last one isn’t a function of any kind of increased demand, but rather pandemic-long guaranteed continuing income to workers on the public payroll.

As we emerge, factories and the building trades are finding it difficult to ramp up their operations to meet growing demand, hampered in part by supply chain issues and shortages of raw materials and parts sourced from offshore suppliers.  As of now, most economists believe that such shortages won’t turn out to be long-term problems — but we shall see over time if this is actually the case.

Another imbalance is what’s been happening to the labor force.  Government stimulus checks and unemployment benefits have been sufficiently robust so as to depress the number of workers seeking a return to employment in certain sectors — particularly in the service industries.  As just one example, restaurants everywhere are finding it more than a little difficult to staff their reopened locations.

The latest forecasts are for the U.S. economy to grow at a blistering pace during the balance of 2021 — perhaps as high as an 8% or 9% seasonally adjusted rate of growth.  That would be historic.  But not everyone is going to benefit.

In a recent Wall Street Journal article, David Lefkowitz of UBS Global Wealth Management points out that “the very sudden stop to the economy and then the very quick restart has created a lot of havoc — a lot of businesses have gotten caught flat-footed.”  But beyond this is the very real likelihood that inflation will emerge as a key factor in the economy, for the first time in more than 40 years. 

Viewed holistically, the situation in which we find ourselves is one where many new and unusual “ingredients” have gone into the economy over the past year, resulting in an economic brew that is just as unusual — and perhaps even unique in our history. 

An artificially depressed economy due to government fiat … followed by massive economic stimulus paid for by expanding the money supply … coupled with sudden demand propelling certain industries over others due to government-driven dictates: for sure it’s a new mix of factors.  Considering this, I’m not at all sure that very many people inside or outside of government have a clear handle on what the next 18 months will actually bring.

But that doesn’t mean we can’t speculate about it, right?  In the comment section below, please share your perspectives on what’s in store for the U.S. economy.  I’m sure others will be interested in reading your thoughts.

Why aren’t wages moving in lockstep with the improved employment picture?

If you’ve taken a look at September’s U.S. unemployment figure – 3.5% — you’re seeing the lowest level of unemployment in over 50 years. And for particular subgroups of the population, they’re enjoying their lowest employment percentages ever — at least since records have been kept.

It’s definitely something to cheer about. But at the same time, it’s become increasingly evident that wage growth isn’t happening in tandem with lower unemployment.  And that includes industrial wages as well.

In fact, September results show the first dip in wages – albeit slight – in the past two years.

What gives?

According to Zheng Liu and Sylvain Leduc, two economics researchers at the Federal Reserve Bank of San Francisco, the cause of stagnating wages in an otherwise robust economy can be laid at the doorstep of automation.

According to Liu and Leduc, as certain tasks move more toward automation, employees are losing bargaining power within their organizations. When people fear that they could lose their jobs to a robot or a machine, there’s a hesitation to ask for higher wages as that might hasten the eventuality.

The net result is a widening gap between productivity and pay.

But does this situation apply across all of industry? Perhaps not. Last year, manufacturing expert and Forbes magazine contributing writer Jim Vinoski noted that “huge swaths of industry remain decidedly low-tech and heavily manual.”

The reason? Complexity, volume and margins are often barriers to the implementation of automation in many applications.  Just because something can be automated doesn’t mean that there’s a compelling economic argument to do so – particularly if the production volumes aren’t in the league of “mass manufacturing.”

Jobs in engineering and R&D are even less likely to become automated. After all, probably the single most important attribute of employees in these positions is the ability to “think outside the box” – something artificial intelligence hasn’t come anywhere close to replicating (at least not yet).

What are your thoughts about automation and how it will affect employment and wage growth? Please share your perspectives with other readers.

What’s the “long-game” in the U.S.-China trade conflict?

The efforts to craft a new trade agreement with the People’s Republic of China have run into some pretty major roadblocks in recent weeks and months.

Things came to another inflection point this week when President Trump announced that new tariffs would be imposed on more Chinese goods imported into the United States. As of September 1, pretty much all categories of Chinese imports will now be subject to tariffs.

If we look at the impact the protracted impasse has had on markets, the repercussions are plain to see. One result we’ve seen is that China has dipped from making up the largest portion of trade with the United States to being in third place now, behind Mexico and Canada:

But what’s the long-term prognosis for a trade deal with China? Recent world (and USA) statistics point to softening of the economy, which could have negative consequences across the board.

When it comes to perspectives on economic and business matters involving China and the Pacific Rim, I like to check in with my brother, Nelson Nones, who has lived and worked in the Far East for more than 20 years.  He has first-hand experience working in the Chinese market and is keenly aware of the issues of intellectual property protection, which is a major bone of contention between the United States and China and is one of the factors in the trade negotiations.  (Nelson runs a software company which has chosen to forego the Chinese market because of regulations requiring software firms that set up a joint ventures with Chinese companies to disclose their source code — something his firm will never do.)

I asked Nelson to share his thoughts about what he sees happening in the coming months.  Here are his observations:

Chinese President Xi has a lot on his plate right now. It isn’t just the U.S. trade war but also the Hong Kong disturbances, U.S. arms sales to Taiwan, the U.S. sending warships through the Taiwan Strait and the South China Sea, and China’s domestic banking sector weakness, to name just some. Trump has also put President Xi in a tight spot by demanding (or getting) Xi’s assurances that China will buy more U.S. agricultural products and will enact legislation protecting foreign intellectual property.  

In spite of his very substantial power, I predict that Xi will have a very tough time ramming Trump’s conditions down the throats of his countrymen. 

I should mention that the biggest issue here is intellectual property protection. The draft agreement that China “almost” signed had assurances that IP protection laws will be enacted, but Xi apparently nixed that draft whereupon the Chinese government stated that no government can promise, when negotiating a treaty with a foreign country, to change its domestic laws.

Technically, they’re right. For example, President Trump can’t commit to changing U.S. laws because only the Congress can do that under the constitutional separation of powers. Similarly, on paper, only China’s National People’s Congress (the national legislature) can change Chinese laws, and President Xi is not a member of the National People’s Congress. (Of course, this explanation conveniently overlooks the fact that both the Presidency and the National People’s Congress are subservient to the Communist Party of China, and that Xi is the General Secretary of the Communist Party, but still it’s technically correct.)

In view of all this, the natural Chinese instinct is to wait … and in this case, wait until the 2020 U.S. election and see what happens. If Trump is defeated for re-election, then perhaps many of Xi’s problems will disappear magically. On the other hand, if Trump stays in office maybe the pain that Trump’s China trade policy is inflicting on U.S. businesses and consumers will force Trump to lighten up a bit.  

In other words, President Xi has much to gain and relatively little to lose by playing the waiting game for a while. 

As for U.S. tariffs, those are causing Chinese businesses to adapt their supply chains by routing them through other East and Southeast Asian countries which are not subject to the tariffs. For instance, instead of sending products straight to the U.S., Chinese manufacturers are sending products to Vietnam or Thailand where a tiny bit of additional work is done – just enough to qualify for a “Made in Vietnam” or “Made in Thailand” label. (This adaptation partially explains Thailand’s large trade surplus which has made the Thai Baht one of the world’s best-performing currencies this year.)  

These maneuvers actually provide a safety valve for both Xi and Trump. For Xi, it cushions the reduction in demand for Chinese exports. At the same time it puts some additional pressure on Trump because this type of safety valve does not really exist for U.S. exporters trying to evade reciprocal Chinese tariffs.  But on the plus side for Trump, it tends to dampen the impact of higher tariffs pushing up U.S. producer and consumer prices.

If you ask me to bottom-line this, the trade problems look more like a protracted siege than an episode of brinksmanship.

How the siege is resolved depends on how strong Trump’s position will be after the 2020 election. If the Democrats continue with their leftward lurch, then Xi will eventually have to cave because Trump’s position will be strong (I’d say a 65% probability of re-election). But if the Democrats come to their senses and Trump continues shooting himself in the foot, then he’s in real danger of losing the election and Xi will come up the big winner (I’d give this a 35% probability as of today). 

So there you have it: the prognosis from someone who is “on the ground” in East Asia.  What are your thoughts?  Are you in broad agreement or do you see things differently?  Please share your observations with other readers here.

Are boomerang kids the “new normal” now?

I’ve blogged before about how the Great Recession and resulting high unemployment rates drove a significant number of young adults back into their childhood homes — or relying on Mom and Dad for financial support at least. It affected millions of young adults.

The economy and job prospects have been steadily improving since those dark days – even if the improvement hasn’t been as rapid as people would like to see …

But here’s an interesting finding: Those new jobs and the improving economy haven’t resulted in the kids moving back out of the house.

In fact, two studies conducted by the Pew Research Center in 2016 have determined that “living with parents” is now the single most common living arrangement for America’s 18-34 year olds.

That is correct: Instead of living with a spouse, a partner, a roommate or on his or her own, the largest single segment of millennials lives full-time with parents.  The phenomenon is most prevalent in Connecticut, New Jersey and New York, where it’s no coincidence that the cost of living is much higher than the national average.

For marketers, this means that the once-coveted 18-34 year-old cohort is today made up of many people who are consuming other people’s resources (e.g., the resources of their parents) rather than making all of their own purchase decisions and spending their own money.

Furthermore, Pew Research has determined that living with parents isn’t merely about employment (or the lack thereof). Over the past eight years, adults age 18-34 have continued to move back home in greater numbers — even as more of them have been able to find jobs.

The Pew findings suggest yet another surprising trend that appears to be in the making – that this is the first American generation where a large portion of the people won’t ever purchase a home.

It’s easy to figure that trends of this kind are transitory. But Pew cautions that the trends may well be more fundamental than the implications of an economic recession.  Instead, there are broader cultural dynamics at play – as well as the long-term challenges of economic independence for this generation of people.

The implications for marketers are intriguing, too.  For some, it will mean placing more emphasis on marketing initiatives aimed at parents, who are the now ones making purchase decisions within a larger multi-generational household — often one that stretches over three generations rather than just two.

And consider these dynamics as well: How do young adults and their parents work through multi-generational purchase decisions?  What are the most effective ways to target and reach multiple generations living under one roof who are making coordinated purchase decisions?  Maybe the old ideas of targeting each audience separately no longer make as much sense as before.

One thing’s for sure – it’s risky for marketers to wait for a return to normal … because that “normal” likely isn’t coming back.  Better to come up with new tactics and new messaging to reach and influence buyers in the new multi-generational environment.

The financial goals — and worries — of affluent consumers: It turns out they’re more similar than different from the broader population.

But gender differences do exist …

acIn this year’s U.S. presidential election campaign, there’s been a good deal of attention paid to so-called “working class” voters. No doubt, this is a segment of the electorate that’s especially unhappy with the current state of affairs in the country.

But what about other population groups?

As it turns out, affluent Americans are worried about many of the same things as well. A recent survey of affluent Americans conducted by the Shullman Research firm reveals that their worries are fundamentally similar to other Americans.

Here’s what survey respondents revealed as their to worries:

  • Your own health: ~36% of respondents cited as a top worry
  • Your family’s health: ~31% cited
  • Having enough money saved to retire comfortably: ~30%
  • The economy going into recession: ~28%
  • Terrorism: ~27%
  • Inflation: ~23%
  • The price of gasoline: ~22%
  • Being out of work and finding a good job: ~20%
  • Political issues / warfare around the world: ~15%
  • Taking care of elderly parents: ~15%

[One mild surprise for me was seeing how many respondents cited “the price of gasoline” as a source of worry, considering not only the recent easing of those prices as well as the affluence level of the survey sample.]

Generally speaking, the research found few gender differences in these responses, but with a few exceptions.

Men were more likely to cite “inflation” as a concern (28% for men vs. 18% for women), whereas women were more likely to consider “the economy going into recession” as a concern (30% for women vs. 26% for men).

Where there’s more divergence between genders is in how people’s identify their top financial goals. Here’s how the various goals tested by the Shullman research ranked overall:

  • Having enough money for daily living expenses: ~57% citied as a top financial goal
  • Having enough money for unexpected emergency expenses: ~56%
  • Having enough income for retirement: ~46%
  • Reducing my debt: ~41%
  • Improving my standard of living: ~40%
  • Remaining financially independent: ~39%
  • Becoming financially independent: ~33%
  • Keeping up with inflation: ~30%
  • Providing protection for family members if I die: ~29%
  • Purchasing a home: ~19%
  • Providing for my children’s college expenses: ~19%
  • Providing an estate for my spouse and/or children: ~16%

Obviously, some of the goals that rank further down the list are more applicable to certain people at certain stages in their lives — whether they’re just getting started in their career, raising young children and so forth.

But I was struck at how many of these supposed “affluent” respondents cited “having enough money for daily living expenses” as a top financial goal. Wouldn’t more people have already achieved that milestone?

Another interesting finding: With many of the goals, women place more importance on them than do men:

  • 63% of women versus just 50% of men consider “having enough money for daily living expenses” to be a top financial goal.
  • 63% of women versus just 47% of men consider “having enough money for unexpected emergency expenses” a top financial goal.
  • 48% of women versus just 33% of men consider “reducing debt” a top financial goal.
  • 45% of women versus just 34% of men consider “improving their standard of living” a top financial goal.
  • 36% of women versus 30% of men consider “becoming financially independent” a top financial goal.

caOne explanation for the differences observed between men and women may be the “baseline” from which each group is weighing their financial goals. But since the survey was limited to affluent consumers, one might have expected that the usual demographic characteristics wouldn’t apply.  Perhaps the differences are rooted in other, more fundamental characteristics.

What are your thoughts? Please share them with other readers.

More information and insights from this study can be accessed here (fee-based).

State migration trends: A familiar pattern reasserts itself?

During the “great recession” that began in 2008, the United States saw an interruption in a decades-long pattern of more Americans moving away from states in the Midwest and Northeast than moving in, while more moved to states in the South and West.

The break in this pattern was good news for those who had bemoaned the loss of political clout based on the relative changes in state population.

To wit:  In the four census periods between the 1960s and the 2000s, the 11 Northeast states plus DC saw their Electoral College percentage plummet by 15 percentage points, so that today they represent barely 20% of the electoral votes required to elect the U.S. president, with s similar lack of clout in the House of Representatives.

For the 12 Midwestern states, the trends haven’t been much better.

But for a few years at least, states in the Midwest and Northeast stopped shedding quite so many of their residents to the Southern and Western regions of the country.

The question was, would it last?  Now we know the answer:  Nope.

Instead, new census data is showing a return to familiar patterns.  In the past few years, the states with the largest net in-migration of people are these predictable ones in the Sunbelt region:

  • Florida: +200,000 net new migrants
  • Texas: +170,000
  • Colorado: +54,000
  • Arizona: +48,000
  • South Carolina: +46,000

By comparison, woebegone Illinois, beset by state fiscal crises, a mountain of over-bloated state pension obligations and a crumbling infrastructure that causes some people major-league heartburn on a daily basis, experienced a net loss of more than 100,000 people.

New York, Pennsylvania, Michigan, New Jersey and other “rust belt” states aren’t far behind.

This map, courtesy of The Washington Post, pretty much says it all:


untitled


There is one glaring difference today compared to previous decades. Back then, California was always at or near the top in terms of positive net in-migration from other states.  That’s all different now – as California is a state with one of the largest net losses.

What’s particularly telling is that California, which used to share many of the characteristics of other Sunbelt and Western states, now seems much more in line with the Northeast and Industrial Midwest when it comes to fundamental factors like state personal and corporate tax rates, real estate prices, environmental regulations, employment dynamics, unionization rates, and the size of public payrolls as a share of the total labor force.

Based on the entrenched and intractable socio-political dynamics at work, don’t look for the migration patterns to change anytime soon.

What are your own personal perspectives, based on where you live?

A nation of “haves” vs. “have-nots”? Gallup tests the perceptions.

pictureIn any presidential political season, there’s always plenty of rhetoric about the American economy, how well it’s performing for the average voter, and people’s perceptions of how they’re doing socioeconomically.

As it turns out, the Gallup Survey has been testing this issue annually for years now — going all the way back to 1988.

The question posed to Americans in Gallup’s surveys is a simple one: Do you consider yourself personally to be part of the “haves” or “have-nots” in America?

Gallup’s latest survey was fielded in July 2015.  Nearly 2,300 U.S. adults aged 18 and older were part of the research.

In response to the “haves vs. have-nots” question, ~58% of respondents considered themselves to be “haves” in U.S. society, while ~38% placed themselves in the “have-nots” segment. (The remaining ~14% see themselves borderline between the two, or they don’t have an opinion.)

Over time, Gallup has found that the percentage of Americans who perceive themselves to be part of the “have-nots” in society rose pretty steadily from 1988 to 1998, but since that time the percentages have leveled off — even during the worst years of the Great Recession from 2009-2011.

And so, the “haves” percentage has fluctuated in a tight band between 57% and 60% in each year since the late 1990s.

It seems that heightened discussions about social inequality in America haven’t resulted in a higher percentage of people thinking that they are on the less fortunate side of the country’s socioeconomic divide.

However, considering that the latest Gallup survey was conducted in July 2015 — and that since that time there have been more news events drawing attention to the issues of social justice — one wonders if we may be on the cusp of some changing thinking on the subject.

Another persistent finding in Gallup’s surveys is this:  Even among families of quite modest means (annual household incomes of $35,000 or lower), only a little more than half in that segment consider themselves to be part of the “have-nots” group.

Education-wise, the survey findings are similar, with fewer than half of the respondents who don’t possess college degrees considering themselves part of the “have-nots” segment.

In reporting on the Gallup survey results, an article published in the November 2015 issue of Quirk’s Marketing Research Review magazine stated:

“The stratification of U.S. society into unequal socioeconomic groups has long been a fixture of philosophic, political and cultural debate. It appears to have remained or even expanded as a fairly dominant leitmotif in the ongoing 2016 election, particularly among the Democratic presidential candidates. 

[Nevertheless,] the results … in this analysis show that a majority of U.S. adults do not think of American society as being divided along economic lines, and a slightly higher percentage say that if society is divided, they personally are on the ‘haves’ side of the equation rather than the ‘have-nots.'”

More information about the Gallup survey results can be viewed here.

What are your thoughts? Do the perceptions Americans have of socioeconomic inequality — or the lack of it — match the reality?  Or are we poised to see some new significant shifts in the way Americans view socioeconomic divisions in this country?

Six years on … and the U.S. ad economy is still in recession?

recession recoveryTwo reports from advertising research sources released in the past month reveal that the advertising field doesn’t appear to be rebounding in strongly – at least not to same degree as the economy as a whole.

One report, from U.S. Ad Market Tracker, is an index that pools electronic media buys processed by major agency holding companies and their brand marketers.

It’s true that this report shows an increase in the overall ad activity index year-over-year of about 18 points (it’s 184 today … 166 a year ago … and 100 back in the recession year of 2009).

But when we look at the breakdown where most of the advertising growth is coming from, it’s nearly all from a handful of categories: social media advertising, advertising on video, Internet radio, plus ad network marketplaces.

By contrast, search advertising is growing at a much slower rate, and the most “commoditized” segments – particularly online display advertising – are doing little better than treading water.

This isn’t the robust rebound that many business and ad industry observers were expecting to see by 2015.

advertisingOver at Kantar Media, the statistics are even less encouraging.

In fact, Kantar projects that the 2015 ad economy will underperform U.S. economic growth for the fifth straight year.

Considering how lethargic in general the U.S. economy has been over that period, to be growing at less than the average is almost an indictment of the industry.

That’s what Kantar Media Chief Research Officer Jon Swallen suggests:  a “streak that might have once seemed unimaginable, but now would seem par for the course.”

Second-quarter 2015 data released by Kantar estimates annualized measured media ad spending declines in the neighborhood of 4%.

More to the point, Kantar is seeing increases in just 7 of the 22 individual ad media categories it tracks, led by the same categories U.S. Ad Market Tracker identifies as the most healthy ones.

Perhaps a surprise — considering the overall disappointing numbers — is that Kantar has tracked two analogue categories as experiencing growth:  radio and out-of-home advertising.

But print continues to decline at pronounced rates, and Internet display advertising has also officially joined the ranks of media segments that are contracting.

Is the disappointing performance of advertising a function of a weak market overall?  Or is it the result of structural changes and the reallocation of promo dollars into different, in some cases non-advertising MarComm vehicles?

I’m not completely sure.  It’s true that certain advertising categories that are “newer” ones are attracting more attention (and more dollars).  But Kantar’s 2nd Quarter reporting of advertising expenditures by major industry category finds just one – one – segment that has experienced an overall increase year-over-year — pharmaceuticals:

Ad economy chart

When just one industry segment out of ten is showing an increase, it suggests more than just some restructuring or re-jiggering is going on. Instead, it’s just as likely that the U.S. advertising economy remains stuck in a recession, even if the overall economy has finally emerged from it.

What are your thoughts on the tepid advertising results? Please share your views with other readers.

How China’s economic woes will affect the United States: A view from East Asia.

Chinese economyIt’s only natural for Americans to be somewhat spooked about what’s happening in the financial markets, what with thousand-point drops on the stock exchanges and all.

It’s even more disconcerting to realize that the forces in play are ones that have little to do with the American economy and a lot more to do with Europe and China. (China in particular, where bubbles seem to be bursting all over the place with the fallout being felt everywhere else.)

In times like this, I seek out the thoughts and perspectives of my brother, Nelson Nones, an IT specialist and business owner who has lived and worked outside the United States for nearly 20 years — much of that time spend in the Far East.

To me, Nelson’s thoughts on world economic matters are always worth hearing because he has the benefit of weighing issues from a global perspective instead of simply a more parochial one (like mine).

Nelson Nones
Nelson Nones

Yesterday, I had the opportunity to ask Nelson a few questions about what’s happening in the Chinese economy, how it is affecting the U.S. economy, and what he sees coming down the road. Here are his perspectives:

PLN: What is your view of the Chinese economy — and what does the future portend?

NMN: I’m a real pessimist when it comes to the current state of the Chinese economy. I also think the Chinese will turn on themselves politically as their economic house of cards is collapsing — so look for a sharp upturn in political and social turmoil as well.

Just as the bubble burst in the U.S. and Europe in 2007-08, it’s bursting now in China — and the rest of East Asia (South Korea, Japan, Thailand and Singapore) are going to get caught in the fallout because of the extent to which their economies are reliant on trade with China.

 PLN: What do you look at, specifically, for clues as to future economic movements?

NMN: The barometer to watch is the price of oil. It plummeted in 2007, presaging the “great recession” in the West.

untitledOil prices began to drop again in 2014.  The U.S. oil benchmark fell below $40 per barrel on August 24, 2015, a level not seen since 2009. I believe the underlying root cause is a sharp contraction of East Asian demand due to the economic bubbles bursting over here, coupled with persistently high supply as Middle Eastern oil exporters compete against American producers to protect market share.

PLN: How will these developments affect the U.S. economy?

NMN: The oil bust will continue in the U.S., dragging the economy down. But energy prices will be lower, buoying other parts of the American economy.  For instance, the domestic airline sector will benefit and consequential demand for Boeing jets will grow.

U.S. imports — specifically, imports from China and the rest of East Asia — will become cheaper as China and other countries allow their currencies to fall in order to protect their exports.

This is probably a “net-neutral” for the US economy in that American exports will be hurt due to the relatively stronger U.S. Dollar, but American consumers will benefit from lower prices. So, the direct economic impact is likely to be mixed.

PLN: So, why worry?

NMN: The real risk, in my opinion, is a global liquidity crisis. Over the past quarter-century, China and other East Asian countries have accrued enormous wealth. But they didn’t hoard their newfound wealth; they invested it both domestically and overseas.

China has invested ginormous amounts of cash in domestic infrastructure and housing. That money is already spent, and a sizeable part of the investment has already gone to waste in the form of corruption, new housing that nobody wants, underutilized transport infrastructure and non-performing loans made to inefficient state-owned enterprises. 

All of this will eventually need to be written off (that’s why their bubble is bursting).

But China has also invested lots of money in overseas financial instruments. Think of the Chinese as the folks who financed the Federal Reserve’s Quantitative Easing program as well as Federal debt in the U.S. But as the Chinese run out of cash at home, they will increasingly need to liquidate their overseas investments just to pay their bills.

This poses a very real threat to the fiscal stability of U.S. and European governments, and to the supply of capital in U.S. and European financial markets.

The Federal Reserve is likely to be caught in a double-bind. On the one hand, if the Fed raises interest rates in response to the reduced supply of capital (as it is widely assumed they will, later this year), they risk choking off the tepid U.S. recovery currently underway.

This would also cause the U.S. Dollar to strengthen further, thereby exacerbating the negative impact of the Chinese bust by making U.S. exports less competitive in global markets.

On the other hand, if the Fed leaves interest rates where they are (basically zero), then they won’t be able to attract enough capital to roll over the public debt that the Chinese are trying to liquidate. In other words, the Fed risks a “run on the bank.”

The Fed can deal with this by printing more money (more or less what the Chinese did in 2007-8), but this would inevitably introduce inflationary pressures in the U.S. It would also lengthen the time it takes for the Chinese to right their ship, because it will put downward pressure on the U.S. Dollar, thereby constraining whatever the East Asians can do to boost exports.

My guess is that the Federal Reserve will “blink” and keep interest rates at zero (and also print more money to pay off the Chinese) in hopes that (somewhat) cheaper imports will offset (some of) the inflationary impact of printing more money.

This is equivalent to kicking the can down the road.

PLN: Do you see any impact on the 2016 Presidential race in the United States?

NMN: As a result of kicking the can down the road, I foresee little impact on the 2016 U.S. Presidential race — but watch out in 2020 when the hangover is well underway.

Alternatively if the Fed raises interest rates, I suspect the Democratic Party candidate will be more vulnerable because the short-term economic pain will be much higher in the U.S. The incumbent party will get most of the blame. Fair or not, that’s just the way bread-and-butter issues play out in American politics.

PLN: What about unrest in China — might that have political repercussions in America? 

NMN: The way I see it, political or social turmoil in China will have zero impact on the U.S. Presidential race. Americans of nearly every political stripe or ideology dislike or distrust Chinese governance, yet unlike the “China lobby” of the Cold War era, they have no appetite to intervene in what they rightly perceive to be internal Chinese affairs.  

Or they’re clueless about events in East Asia. Or they just don’t care.

So there you have it — a view from the Far East. If you have other perspectives, please share them with our readers here.

______________

Update (8/28/15):  A few days after this post was uploaded, I received this follow-up from Nelson:

Just as I had predicted, check out this link.  Federal debt is getting more expensive to finance, because the drop in demand for U.S. Treasury bonds (caused by the Chinese liquidation apparently underway) is driving yields up.  According to the article, “The liquidation of such a large position, if it continues, could wreak havoc on the Treasuries market.”
Now look here:  http://www.bloombergview.com/quicktake/federal-reserve-quantitative-easing-tape. It’s an easily understandable explanation of how the Federal Reserve’s quantitative easing (QE) program worked.  Essentially the Fed, like China, stepped in to buy Treasuries also. The Fed also bought mortgage-backed securities.
The Fed’s purchases of Treasuries and mortgage-backed securities now make up ~85% of the Fed’s assets.  The Fed hasn’t indicated what it will do when these assets mature, but if it doesn’t roll over this debt (or a portion thereof) then we can expect Treasury yields to rise yet again. Even if the Fed decides to keep interest rates where they are, at near-zero, rising Treasury yields could bring on a liquidity crunch within the private sector as capital is increasingly drawn away from private investments (loans, corporate bonds and equities) to government-issued bonds paying higher yields with little risk.
Facing the Chinese liquidation, this is why I suspect the Fed will opt to roll over its holdings of Treasuries and mortgage-backed securities, and keep interest rates at near-zero, at least through the 2016 Presidential election cycle.  The Bloomberg article cited above describes QE as an alternative to printing more money, but in the end it’s really the same thing.