How to be behind the eight-ball in Davos.

Can the World Economic Forum be any less useful or relevant?

Most people in business and politics have heard of the World Economic Forum (WEF), best known for holding its annual meeting for the world’s glitterati every January in Davos, Switzerland.

Beyond that international confab, WEF provides a set of “Transformation Maps” on its website which are described as “a constantly refreshed repository of knowledge about global issues, from climate change to the future of work.” 

“Transformation Maps are the World Economic Forum’s dynamic knowledge tool,” the website declares. “They help users to explore and make sense of the complex and interlinked forces that are transforming economies, industries and global issues.”

The maps present insights written by so-called experts along with machine-curated content. Together, “the information allows users to visualise and understand more than 250 topics and the connections and inter-dependencies between them, helping in turn to support more informed decision-making by leaders.”

… And it’s all provided as free content!

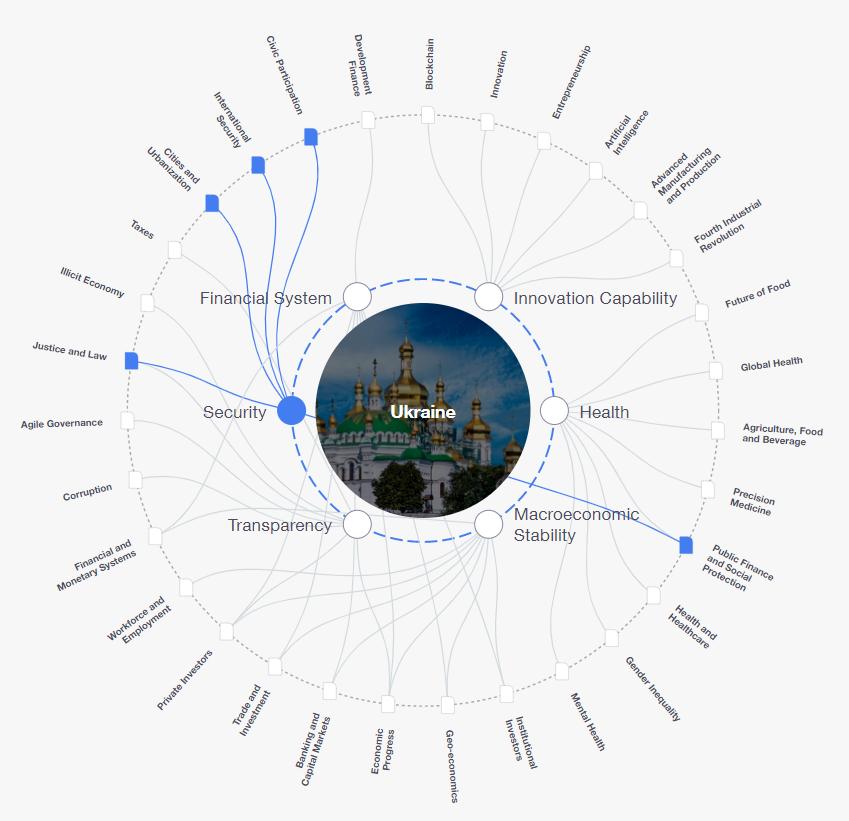
Taking a current topic of interest as an example, if one wishes to find out about Ukraine, he or she can click on a link beneath a Transformation Map labelled “Fourth Industrial Revolution” which brings up a new page: https://intelligence.weforum.org/topics/a1Gb0000001RIhBEAW?tab=publications. From there, select Discover All Topics from the top menu which brings up this new page: https://intelligence.weforum.org/topics.

That page displays 293 different topics. Scrolling down a good ways finally brings up “Ukraine” … and here’s what is displayed after clicking on the “Security” issue:

Explaining how the chart was developed, the website reports:

“This Transformation Map explores key issues for Ukraine based on its rankings in the most recent edition of the World Economic forum’s Global Competitiveness Index.”

For the record, those six “key issues” are Financial System, Innovation Capability, Health, Macroeconomic Stability, Transparency and Security.

The Security issue then links to five other topics (Public Finance and Social Protection, Justice and Law, Cities and Urbanization, International Security and Civic Participation).

Curious to see what content would be displayed, I clicked the International Security topic, which causes the International Security Transformation Map to appear. Only then did I finally learn that:

“The return of great power competition has been accompanied by the outbreak in Ukraine of Europe’s largest ground war since World War II.”

I must admit that I am quite impressed with how these Transformation Maps have helped me to visualize and understand the connections and inter-dependencies between Ukraine and International Security … and it is now completely clear to me how these tools support more informed decision-making by leaders. [Feel free to insert snark emoji here.]

The 2020-21 COVID-19 and 1918-19 Spanish Flu epidemics: How do they compare?

Now that we’re down the road a good ways with the COVID-19 pandemic, it’s interesting and perhaps instructive to make a comparison between the current pandemic, and the 1918 H1N1 (influenza) pandemic, colloquially known as the “Spanish Flu,” that happened a little over a century ago.

There is no firm consensus on when the 1918 H1N1 pandemic actually began, but according to the U.S. Center for Disease Control and Prevention, it was first identified in U.S. military personnel in the spring of 1918 and ran its course for at least 44 weeks until May 1919, killing approximately 675,000 people in the United States.  

In as much as the U.S. population was about 100 million at that time, the 1918 H1N1 pandemic’s death rate was about 6.4 per thousand people (0.6% of the population).

By contrast, the COVID-19 pandemic has been underway for 89 weeks (and counting) in the U.S., killing about 783,000 people here so far. The U.S. population had grown to about 330 million by 2020, so the COVID-19 death rate thus far is about 2.4 per thousand people (0.2% of the population).

University of California – San Francisco epidemiologist George Rutherford has compiled a summary chart for the 1918 H1N1 pandemic in the U.S.  According to the data, Spanish Flu’s first wave occurred in July 1918, followed by a second and far deadlier wave between October and December 1918 – and then a third less-deadly wave in February and March 1919, as depicted in Dr. Rutherford’s chart. At the peak of the second wave in November 1918, the U.S. experienced 24 deaths per thousand population per week.

It’s interesting to see how this historical data compares to the COVID-19 pandemic, which began in the U.S. with a first wave between March and June 2020, followed by a smaller wave between July and September 2020. The largest and deadliest wave occurred between October 2020 and March 2021, when the weekly death rate peaked at 7 per thousand population.  The fourth and most recent wave began in August 2021 until the present. You can view the weekly deaths per thousand population for both pandemics on this chart:

Pandemic comparisons

What’s clear is that, so far, the COVID-19 pandemic has lasted twice as long, while being one-third as deadly as the 1918 H1N1 pandemic.

This leads to an interesting insight. On the economic front, with comparatively little government regulation or monetary relief to citizens, the business cycle back in the early part of the 20th century tended to be shorter but much more volatile than it is today, exhibiting higher highs followed by lower lows.

Similarly, the degree of government regulation and involvement in matters of public health, including strong support for the rapid development of new vaccines, has been much greater during the COVID-19 pandemic than it ever was during the 1918 H1N1 pandemic.

It would seem that increased government involvement during economic and public health crises tends to moderate the ill effects — but at the cost of prolonging the misery.

The question is whether this connection is causation or coincidence. Please share your own thoughts in the comment section below.

(h/t Nelson Nones for researching and plotting the comparative stats.)

Predicting company misconduct before it even happens … really?

Researchers from the Harvard and Tilburg Business Schools think they’ve found a method to do just that.

One of the research techniques that has sprung up in the era of online engagement and interactivity is “mining” reader comments — then analyzing the granular data to discern their wider implications for companies and brands.

One way this happens is by analyzing the words that employees use to describe their own companies on review sites. Doing so can provide clues as to what’s going on inside these companies that others can’t discovers based on forward-facing reporting about the organizations in the business or news press.

Underscoring this point, a study conducted jointly by researchers at Harvard Business School and the Tilburg School of Economics and Management in The Netherlands has found that such information extracted from employee-review websites like Glassdoor.com is helpful in being able to predict potential misconduct beyond other observable factors such as a firm’s financial performance and  industry risk analysis.

The correlating factors revolve around employee observations concerning the environments in which they work – factors like:

  • Company culture
  • Company operations
  • Control practices
  • Performance pressures

Negative or critical comments made within these broad categories contribute to weighing the risk for corporate misconduct.  Business management professor Dennis Campbell of the Harvard Business School notes that the “tone at the bottom” revealed by such comments can be a good early-warning signal of potential misconduct.

“Our theory is that what leads people to commit misconduct is actually the environment they are in,” adds Ruidi Shang, the Tilburg professor heading up the research team.

The Harvard/Tilburg study sifted through information from anonymous reviews of publicly traded U.S. companies that had been posted on Glassdoor.com over a nine-year period between 2008 and 2017.  Focusing on nearly 1,500 companies that had been the subject of ten or more review entries each over the period, by comparing keywords in the comments to actual corporate misconduct cases brought against public U.S. firms over the same period, direct correlations were found between the statements and the companies that were later found guilty of misconduct.

The researchers discovered that certain terms and phrases used by employees in their comments correlate highly to misconduct cases – terms like bureaucracy, compliance, favoritism, harassment, hostile and strict.  Such terms came up disproportionately more frequently in the discussions and comments.

Of course, such analyses are rough measures at best.  Because the researchers drew comparisons between the comments and the corporate misconduct based only on cases that the U.S. government pursued, the methodology would have missed misconduct wasn’t known (or pursued) by the government.  But as for providing “directional indicators,” the methodology seems to be a valid approach. I think we could see it being employed by Wall Street analysts as part of efforts to predict threats to future financial performance – and other potential problems — based on what the granular data reveals.

More details on the study and its findings can be read in this report.

When will U.S. employment dynamics change?

Looking around most every community, it doesn’t take long to realize just how many businesses are looking to hire workers.  “Help Wanted” signs are everywhere, and various signing incentives are being offered to entice new employees as never before.

But in many cases the offers of employment are falling on pretty deaf ears. A recent survey of workers conducted by the Indeed employment website reveals that although many people are ostensibly in the market for new jobs, oftentimes the sense of urgency about landing a position simply isn’t there.

The Indeed survey was administered to ~5,000 Americans age 18 to 64 during the summer of 2021.  The sample encompassed individuals in and out of the labor force.

The results of the survey revealed that many of the unemployed respondents don’t feel that they need to land a job right away — but they do express an interest in returning to work at some future point.  The three main factors that appear to be holding people back from returning to work are these:

  • Concerns about the COVID-19 virus and its variants
  • Financial cushions, including employed spouses and the continued availability of enhanced unemployment insurance benefits
  • Care responsibilities at home — particularly involving school-age children

The net effect is that while many employers are making a major push to hire workers in order to take advantage of the reopened economy, many would-be employees simply don’t feel the same sense of urgency.

With the continuing questions surrounding the spread of Delta and other variants of COVID, what was once considered the near-certainty of a “return to normalcy” in the latter part of 2021 hasn’t quite turned out that way.

At this point, it would seem that the employment dynamics aren’t going to change dramatically until the unemployment compensation safety net reverts to its pre-pandemic structure … kids are back in school without the risk of future quarantines or class closures … and no new variants emerge that cause the number of COVID cases to spike again.

Considering what the past 18 months have been like, getting these three factors to neatly align may be a tall order.

For detailed survey results, you can access the Indeed research via this link.

Online search:  So fast … so convenient … so imperfect.

There’s no question that search engines have made the process of gaining knowledge, and researching products and services, extremely easy — often nearly effortless.  The search bots do the work for us, helping us find the answers we’re seeking in the blink of an eye.

So what’s not to love about search? 

The thing about search engines is that the algorithms “reward” the purported wisdom of crowds – particularly since there’s more social interaction on websites than ever these days.  It’s one thing for developers to optimize their websites for search – but there’s also the behaviors of those doing the searching and interacting with those same websites and pages. 

Whether it’s tracking how much time visitors spend on a page as a proxy for relevance, or how visitors may interact with a page by rating products or services, the bots are continually refining the search results they serve up in an effort to deliver the highest degree of “relevance” to the greatest number of people.

But therein lies the rub.  Popularity and algorithms drive search rankings.  If people confine viewing of search results to just the first page – which is what so many viewers do —  it limits their exposure to what might actually be more valuable information. 

Over time, viewers have been “trained” to not to look beyond the first page of online results – and often not beyond the top five entries.  That’s very convenient and time-efficient, but it means that better information, which is sometimes going to be found in the middle of search results rather than at the top, is completely missed.

As we rely more on ever-improving software, it’s tempting to assume that the search algorithms are going to be more and more airtight – and hence more effective than human-powered expertise. 

But that isn’t the case – at least not yet.  And a lot of things can slip through the gap that exists between the perception and the reality.

Another COVID consequence: Consumer preferences for text communications just got a lot more pervasive.

Text messaging has been with us for a long time now. It’s only natural that its popularity would grow in tandem with the increased adoption of smartphones. 

But as late as 2019, field studies conducted by research companies like Lunar and Twilio showed that email communications continued to be the preferred way for consumers to receive communications from businesses or sales personnel.

Of course, both text and email had already eclipsed voicemail in popularity long ago – not to mention hanging on the phone for minutes (or hours) at a time to interface with companies in real-time.

Then COVID came along — and with it came stay-at-home orders from governments and employers. Its impact on consumer communications behavior was huge. New research reveals that the majority of people surveyed have increased their cellphone usage since the onset of the coronavirus – in most cases dramatically so.

In fact, nine out of ten consumers surveyed now report that they prefer receiving text communications over email when it comes to interfacing with businesses — and such text messages are also more likely to be read than email communications.

Moreover, consumers prefer texting with customer support reps more than real-time phone calls. They expect quick and accurate responses to their text inquiries — and don’t seem particularly concerned about the “digital paper trail” that might be less easy to document and preserve with text messaging than with email.

This shift in attitudes is actually pretty intuitive: Texting with customer support personnel allows anyone with a mobile device to get answers and resolve issues quickly, without enduring long hold times and transfers. The shorter resolution times that texting can deliver also encourage brand trust.

Chalk it up as yet another trend that was already happening — but COVID’s given it a big boost.

Arguing, finger-pointing, and other nasties.

The momentous events of the past 18 months have certainly generated their fair share of energy — too much of it negative.  Between the U.S. presidential election “resistance,” COVID-19 and the Afghanistan exit, there seems to have been endless accusations and finger-pointing, all over the place.

If we want to lower the temperature, I particularly like one therapeutic approach that I read about recently. 

It recommends that people pause and ask themselves three questions before criticizing or arguing with someone else – whether offline or on social media:

  • Does this need to be said?

  • Does this need to be said by me?

  • Does this need to be said by me right now?

Actually, this is a good recipe for all of our interactions in our business, professional and personal lives.

Or as a wise friend of mine puts it, “Living the Golden Rule – all the time.”

Another summer of natural disasters — and still too few people heed the warnings.

Waverly, Tennessee Flooding (2021)

This summer’s natural disasters have been par for the course. Just like clockwork, we’ve had wildfires, tropical storms and flooding — with likely more such events happening between now and the end of the season.

And even as these events occur with numbing regularity, it seems that year after year we hear the same stories of people being caught up in nature’s wake. No matter how much effort officials put into evacuation planning and alerts, not everyone hears the message — or “gets it” if they do hear it.

Some states such as Florida and California have worked to build programs that provide explicit guidelines for local officials to follow during evacuations. For example, California’s guidance urges communities to rely on the federal warning system so that alerts can reach the greatest number of people most quickly — usually through cellphone alerts. Local officials are routinely reminded that “incomplete or imperfect information is not a valid reason to delay or avoid issuing a warning.”  When time is of the essence, the “20-80 rule” of information is better than an “80-20” ratio.

The problem is, research shows that many people aren’t inclined to act on these alerts. Typically only about half of those located in mandatory evacuation zones actually leave before hurricanes hit.  For wildfires the percentage of people who comply is higher, but still far too many ignore the orders

Why do people stay rather than leave?  Research finds a variety of factors at play, including:

  • Health problems or disability issues that make it difficult for some people to evacuate
  • Lack of transportation
  • Skepticism about the level of danger
  • Concern about leaving property unattended
  • The inability to accommodate pets, livestock or animals such as horses

Wildfires make for particularly challenging situations because they can quickly shift direction with very little warning. Rural and remote towns with fewer resources and fewer roads face particular challenges.  Often the main evaluation routes are narrow, two-lane thoroughfares that can’t handle the sudden influx of traffic when thousands are being directed to leave the vicinity.

Flash floods can also hit without warning, but with hurricanes it’s often easier to plan for evacuations because typically there are several days’ warning before exit routes will need to shut down.

Florida has experimented with various tactics to improve evacuations by opening emergency shoulders to highway traffic, adding emergency roadside services on major evacuation routes, and posting more cameras and message signs to alert drivers to changing traffic conditions and other developments.

Sending a single unambiguous message from local officials is the best policy regarding evacuations. Offering “options” can create confusion and lead people to pick the option that appeals most to them personally — which might not be the safest one.  Whatever the communication, it must be definitive and precise.  Otherwise, the whole evacuation effort can go sidewise.

Fort McMurray Fire (2016)

Lest anyone become complacent about the dangers that natural disasters can pose, watch this terrifying “you are there” dash cam footage of a resident of Fort McMurray attempting to escape the wildfires that engulfed a portion of that Canadian city in 2016.  There’s no news anchor voiceover … no ominous music in the background to add “drama” … just the gripping footage as documented by the camera. Viewing it once a year is enough to become “scared straight” about natural disasters, all over again.

The COVID-related product shortages that just won’t go away.

(Photo: CNS)

This past February I ordered an 18,000 BTU window air conditioning unit through the local GE dealer in the town where I live. It’s the largest such window unit you can buy, and there aren’t very many alternative options available from competitors.

Not surprisingly, the particular unit I ordered is manufactured in China (I am not aware of any similar models that are made in the United States). At the time I placed my order, I was informed that due to COVID-related disruptions of global deliveries, the earliest I could expect my unit to be received and installed was in April.

I wasn’t very surprised at this news, and figured that the delay would be perfectly fine for getting the AC unit installed and working in our home before the onset of the notoriously hot and humid summer months where we live here on Maryland’s Eastern Shore.

Since then, we’ve had several more pushbacks in the anticipated product delivery – first June … then August. And now the latest schedule I’m being told is for an October delivery – and even that date is “iffy.”

I think my situation isn’t unusual in these COVID-crazy times. Considering that the pandemic began towards the end of 2020, we are now 20 months later and the ripple effects are still being felt all throughout the global movement of products.

In fact, the recent coronavirus outbreaks that have occurred in Chinese port cities just this past month have caused even greater shipping delays than what had been encountered during 2020; they’re actually the worst shipping delays seen in 20 years. It means that the impacts will likely be felt all the way to the holiday shopping season at the end of this year — at a minimum.

As a related consequence of the COVID pandemic, the demand for shipping containers and shipping boxes has never been higher, even as some containers have been marooned on ships attempting to travel through the Suez Canal (which was shut down for a period of weeks earlier this year) as well as bottlenecks in certain port cities where labor shortages have been particularly acute.

Among the myriad of products and supplies that have been seriously affected are:

  • Appliances
  • Batteries
  • Food products
  • Furniture
  • Hospital, dental and surgical equipment/supplies
  • Measuring instruments
  • Plastic materials
  • Printed circuit boards
  • Semiconductor processing equipment

… and these are just some of the most notable examples.

With the Delta variant apparently causing a COVID-pandemic redux, it’s pretty impossible to gauge just how long it will take to work through the product shortages that have with us for so long already.

But what’s quite clear is that all of the initial estimates were woefully off the mark … so why would we expect anything different now?

What sort of product shortages have you experienced in the past few months, “thanks” to COVID – either in your business or at home?  Please share your experiences (surprisingly good or unsurprisingly bad) with other readers here.

In a twist, “working from home” benefits big tech in big ways.

Remote work has turned each new hire into a national competition.

Historically, one of the challenges faced by smaller urban markets was their ability to hang on to talent. Younger workers often found it more financially lucrative following their education to relocate to major metropolitan areas in order to snag higher paying positions with the companies based there.

In time, however, the high cost of living in the large metro markets, coupled with the desire to ditch the unbearable congestion in those areas, led to the formation of new businesses outside the major tech centers that found it easier to compete with the major urban areas for talent. 

Established companies found the same dynamics at work, too. The rise of markets like Charlotte, Salt Lake City, Pittsburgh and Boise underscored that the spread of the “new economy” had migrated to places beyond the traditional hubs of Boston, Washington, New York City, San Francisco/Silicon Valley, Los Angeles and others.

Then the COVID pandemic came along. Suddenly, it didn’t matter where employees lived as companies quickly figured out ways to have, in some cases, nearly their entire workforce working remotely. 

It didn’t take long for employees in some of the market hardest-hit by COVID to flee to far-flung regions. New York City residents moved to the Hudson River Valley, South Florida and other locations. For California residents it was off to Nevada, Montana or Idaho. Boston-based workers decamped for Vermont or Maine.

It soon became apparent that for many tech jobs, the need to be clustered together in offices simply wasn’t that critical. And in an ironic twist, smaller-city startups and other firms are now starting to feel the effects of the establishment biggies poaching their own employees.

It’s particularly ironic; whereas before, companies that couldn’t compete with Silicon Valley heavyweights on salary could offer a whole lot of lifestyle to even the playing field.  Now they’re finding that “work from anywhere” policies have nullified whatever advantages they had. 

Those big-city salaries can be used to purchase a lot of house in whatever kind of environment desired — even if it’s a lakeside cabin in the middle of nowhere. 

It also means that, all of a sudden, everyone’s competing with companies all over the country for talent — and hanging on to the existing talent is that much more difficult. When people are being offered 20% higher salary with no requirement to relocate, that’s a proposition many people are going to consider.

Another interesting consequence is that tech labor force is probably geographically more evenly distributed than it’s ever been — and the workers residing outside the traditional tech hubs are benefiting accordingly — At least in the short-term. 

In the longer term, companies based in the smaller markets hope that they’ll have access to those same new tech migrants if work-from-home policies change yet again.  But that’s a big “if” …