There’s no question that search engines have made the process of gaining knowledge, and researching products and services, extremely easy — often nearly effortless. The search bots do the work for us, helping us find the answers we’re seeking in the blink of an eye.
So what’s not to love about search?
The thing about search engines is that the algorithms “reward” the purported wisdom of crowds – particularly since there’s more social interaction on websites than ever these days. It’s one thing for developers to optimize their websites for search – but there’s also the behaviors of those doing the searching and interacting with those same websites and pages.
Whether it’s tracking how much time visitors spend on a page as a proxy for relevance, or how visitors may interact with a page by rating products or services, the bots are continually refining the search results they serve up in an effort to deliver the highest degree of “relevance” to the greatest number of people.
But therein lies the rub. Popularity and algorithms drive search rankings. If people confine viewing of search results to just the first page – which is what so many viewers do — it limits their exposure to what might actually be more valuable information.
Over time, viewers have been “trained” to not to look beyond the first page of online results – and often not beyond the top five entries. That’s very convenient and time-efficient, but it means that better information, which is sometimes going to be found in the middle of search results rather than at the top, is completely missed.
As we rely more on ever-improving software, it’s tempting to assume that the search algorithms are going to be more and more airtight – and hence more effective than human-powered expertise.
But that isn’t the case – at least not yet. And a lot of things can slip through the gap that exists between the perception and the reality.
Canadian interactive media and search engine specialist extraordinaireGord Hotchkiss is one of my favorite columnists who write regularly on marketing topics. Invariably he does a fine job “connecting the dots” between seemingly disparate points — often drawing thought-provoking conclusions from them.
In short, a Hotchkiss column is one that is always worth reading. In his latest piece he starts out with a bold pronouncement:
“When the internet ushered in an explosion of information in the mid-to late-1990s there were many — I among them — who believed humans would get smarter.
What we didn’t realize then is that the opposite would eventually prove to be true.”
His point is that information technology has begun to change the time-honored ways humans are hard-wired to think, which is both fast and slow. In essence, two loops are required for mental processing: the “fast” loop pertains to our instinctive response to situations, whereas the “slow” loop is a more thoughtful processing of discerning reality.
[This line of thinking ties back to theories laid out in a book published in 2011 by psychologist and economist Daniel Kahneman titled Thinking, Fast and Slow.]
In Hotchkiss’ view, people need both loops – especially now, considering the complexity of the world.
A more complex world requires more time to absorb and come to terms with that complexity. But when the focus is only on thinking “fast,” the results aren’t pretty. As he observes:
“If we could only think fast, we’d all believe in capital punishment, extreme retribution, and eye-for-eye retaliation. We would be disgusted and pissed off almost all the time. We would live in a Hobbesian State of Nature [where] the ‘natural condition of mankind’ is what would exist if there were no government, no civilization, no laws, and no common power to restrain human nature.
The state of nature is a ‘war of all against all’ in which human beings constantly seek to destroy each other in an incessant pursuit for power. Life in the state of nature is ‘nasty, brutish and short.’”
Do any of us wish to live in a world like that? One would think not.
But here’s where Hotchkiss feels like things have gone off the rails in recent times. The Internet and social media have delivered to us the speed of connection and reaction that is faster than ever before in our lives and in our culture:
“The Internet lures us into thinking with half a brain … and the half we’re using is the least thoughtful, most savage half … We are now living in a pinball culture, where the speed of play determines that we have to react by instinct. There is no time left for thoughtfulness.”
In such an environment, can we be all that surprised at the sorry result? Hotchkiss, for one, isn’t, noting:
“With its dense interconnectedness, the Internet has created a culture of immediate reaction. We react without all the facts. We are disgusted and pissed off all the time. This is the era of ‘cancel and ‘callout’ culture. The court of public opinion is now less like an actual court and more like a school of sharks in a feeding frenzy.”
Not that every interaction is like that, of course. If you think of social media posts, there are many — perhaps more — that are wonderfully charming, even cloyingly affectionate.
Most people are quick to point out that there’s this good side to social media, too – and in that sense, social media merely reflects the best and worst of human nature.
But regardless of whether it’s negative or positive, pretty much all interactive media lives in the realm of “thinking fast.” All of it is digested too quickly. Too often it’s empty calories – the nutritional equivalent of salt-and-vinegar potato chips or cotton candy.
Hotchkiss’ point is that interactive communications and media have effectively hijacked what’s necessary for humans to properly pause and reflect in the “slow thinking” lane, and he leaves us with this warning:
“It took humans over five thousand years to become civilized. Ironically, one of our greatest achievements is dissembling that civilization faster than we think. Literally.”
It isn’t so much the size of the problem, but rather its implications.
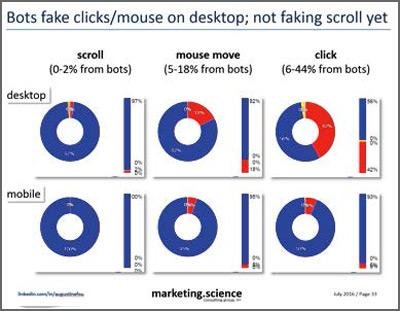
A recently published report by White Ops, a digital advertising security and fraud detection company, reveals that the source of most online ad fraud in the United States isn’t large data centers, but rather millions of infected browsers in devices owned by people like you and me.
This is an important finding, because when bots run in browsers, they appear as “real people” to most advertising analytics and many fraud detection systems.
As a result, they are more difficult to detect and much harder to stop.
These fraudulent bots that look like “people” visit publishers, which serve ads to them and collect revenues.
Of course, once detected, the value of these “bot-bound” ads plummets in the bidding markets. But is it really a self-correcting problem? Hardly.
The challenge is that even as those browsers are being detected and rejected as the source of fraudulent traffic, new browsers are being infected and attracting top-dollar ad revenue just as quickly.
It may be that only 3% of all browsers account for well over half of the entire fraud activity by dollar volume … but that 3% is changing all the time.
Even worse, White Ops reports that access to these infected browsers is happening on a “black market” of sorts, where one can buy the right to direct a browser-resident bot to visit a website and generate fraudulent revenues.
… to the tune of billions of dollars every year. According to ad traffic platform developer eZanga, advertisers are wasting more than $6 billion every year in fraudulent advertising spending. For some advertisers involved in programmatic buying, fake impressions and clicks represent a majority of their revenue outlay — even as much as 70%.
The solution to this mess in online advertising is hard to see. It isn’t something as “simple and elegant” as blacklisting fake sites, because the fraudsters are dynamically building websites from stolen content, creating (and deleting) hundreds of them every minute.
They’ve taken the very attributes of the worldwide web which make it so easy and useful … and have thrown them back in our faces.
Virus protection software? To these fraudsters, it’s a joke. Most anti-virus resources cannot even hope to keep pace. Indeed, some of them have been hacked themselves – their code stolen and made available on the so-called “deep web.” Is it any wonder that so many Internet-connected devices – from smartphones to home automation systems – contain weaknesses that make them subject to attack?
The problems would go away almost overnight if all infected devices were cut off from the Internet. But we all know that this is an impossibility; no one is going to throw the baby out with the bathwater.
It might help if more people in the ad industry would be willing to admit that there is a big problem, as well as to be more amenable to involve federal law enforcement in attacking it. But I’m not sure even that would make all that much difference.
There’s no doubt we’ve built a Frankenstein-like monster. But it’s one we love as well as hate. Good luck squaring that circle!
The panelists included Ted Koppel, former anchor of ABC News’ Nightline, Howard Kurtz, host of FAX News’ Media Buzz, and Judy Woodruff, co-anchor and managing editor of the PBS NewsHour show.
During the discussion, Ted Koppel expressed his dismay over the decline of journalism as a professional discipline, noting that the rise of social media and blogging have created an environment where news and information are no longer “vetted” by professional news-gatherers.
One can agree or disagree with Koppel about whether the “democratization” of media represents regression rather than progress, but one thing that cannot be denied is that the rise of “mobile media” has sparked a decline in the overall number of professional media jobs.
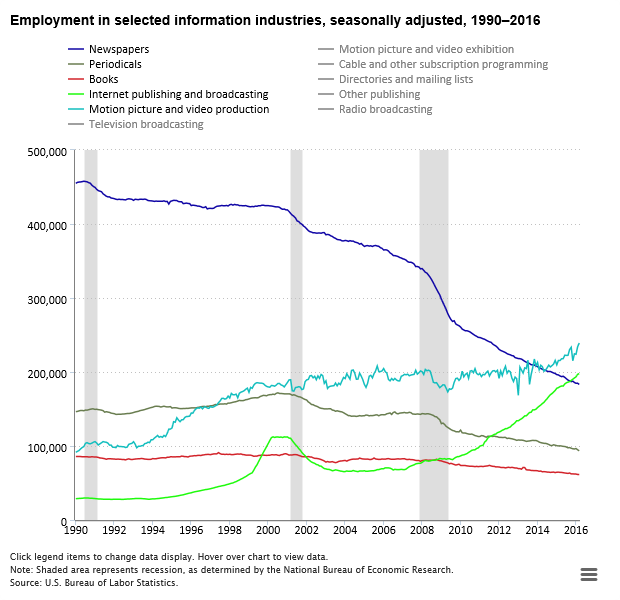
Data from the Bureau of Labor Statistics can quantify the trend pretty convincingly. As summarized in a report published in the American Consumers Newsletter, until the introduction of smartphones in 2007, the effect of the Internet on jobs in traditional media, newspapers, magazines and book had been, on balance, rather slight.
To wit, between 1993 and 2007, U.S. employment changes in the following segments looked like this:
Book Industry: Net increase of ~700 jobs
Magazines: Net decline of ~300 jobs
Newspapers: Net decline of ~79,000 jobs
True, the newspaper industry had been hard hit, but other segments not nearly so much, and indeed there had been net increases charted also in radio, film and TV.
But with the advent of the smartphone, Internet and media access underwent a transformation into something personal and portable. Look how that has impacted on jobs in the same media categories when comparing 2007 to 2016 employment:
Book Industry: Net loss of ~20,700 jobs
Magazines: Net loss of ~48,400 jobs
Newspapers: Net loss of ~168,200 jobs
Of course, new types of media jobs have sprung up during this period, particularly in Internet publishing and broadcasting. But those haven’t begun to make up for the losses noted in the segments above.
According to BLS statistics, Internet media employment grew by ~125,300 between 2007 and 2016 — but that’s less than half the losses charted elsewhere.
All told, factoring in the impact of TV, radio and film, there has been a net loss of nearly 160,000 U.S. media jobs since 2007.
You’d be hard-pressed to find any other industry in the United States that has sustained such steep net losses over the past decade or so.
Much to the chagrin of old-school journalists, newspaper readership has plummeted in recent years — and with it newspaper advertising revenues (both classified and display).
The change in behavior is across the board, but it’s particularly age-based. These usage figures tell it all:
In 2007, ~33% of Americans age 18 to 34 read a daily newspaper … today it’s just 16%.
Even among Americans age 45 to 64, more than 50% read a daily newspaper in 2007 … today’s it’s around one third.
And among seniors age 65 and up, whereas two-thirds read a daily paper in 2007, today it’s just 50%.
With trends like that, the bigger question is how traditional media have been able to hang in there as long as they have. Because if it were simply dollars and cents being considered, the job losses would have been even steeper.
Perhaps we should take people like Jeff Bezos — who purchased the Washington Post newspaper not so long ago — at their word: Maybe they do wish to see traditional journalism maintain its relevance even as the world around it is changing rapidly.
For those of us who spend practically every living minute of our day online, it seems almost unbelievable that there are actually some people in the United States who simply never go online.
The Pew Research Center has been researching this question for the past 15 years. And today, the percentage of “offline American adults” (people age 18 or over who don’t use the Internet) remains stuck at around 15% — a figure that has been stubbornly consistent for the past three years or so:
But up until then, the percentage had been declining, as can be seen in these milestone Pew survey years:
2000: ~48% of American adults not using the Internet
2005: ~32% not using
2010: ~24% not using
2015: ~15% not using
Part of the long-term shift has been new people interfacing with the Internet. But another factor is simply the “aging out” of older populations as they pass from the scene.
The demographic dynamics Pew finds on Internet usage show relatively little difference in behavior based on ethnicity — except that only about 5% of Asian-Americans never go online.
Rather, it’s differences in age particularly — but also in income levels and education levels — that are more telling.
The age breakdown is stark, and shows that at some point, we are bound to have near-total adoption of the Internet:
Age 18-29: ~3% don’t use the Internet
Age 30-49: ~6% don’t use
Age 50-64: ~19% don’t use
Age 65+: ~39% don’t use
Income levels are also a determining factor when it comes to Internet usage:
Less than $30,000 annual household income: ~25% don’t use the Internet
30,000 – 50,000 annual HH income: ~14% don’t use
$50,000 – $75,000 annual HH income: ~5% don’t use
Over $75,000 annual HH income: ~3% don’t use
And Pew also finds significant differences based on the amount of formal education:
Some high-school level education: ~33% don’t use the Internet
High school degree: ~23% don’t use
Some college: ~9% don’t use
College graduate or post-graduate education: ~4% don’t use
Lastly, while no difference in Internet usage has been found between urban and suburban Americans, the adoption rate in rural areas continues to lag behind:
Urban dwellers: ~13% don’t use the Internet
Suburban residents: ~13% don’t use
Rural areas: ~24% don’t use
One reason for the lower adoption rate in rural areas may be limited Internet access or connectivity problems — although these weren’t one of the key reasons cited by respondents as to why they don’t go online. Pew’s research has found these points raised most often:
Have no interest in using the Internet / lack of relevance to daily life: ~34%
The Internet is too difficult to use: ~32%
The expense of Internet service and/or owning a computer: ~19%
The results of Pew’s latest survey, which queried ~5,000 American adults, can be viewed here. Since the research is conducted annually, it will be interesting to see if Internet usage resumes its drive towards full adoption, or if the ~85% adoption rate continues to be a “ceiling” for the foreseeable future.
The key takeaway message from MarketLive’s latest e-commerce statistics is that smartphones are where the go-go action is in e-commerce.
If there’s any lingering doubt that smartphones are really on the march when it comes to e-commerce activity, the latest user stats are erasing all vestiges of it.
MarketLive’s 2nd Quarter e-commerce stats for 2015 reveal that mass-market consumers purchased ~335% more items via their smartphones than they did during the comparable quarter last year.
MarketLive’s report covers the buying activity of millions of online consumers. And the uptick it’s showing is actually more like a flood of increased activity. That’s plain to see in these year-over-year 2nd Quarter comparative figures for smartphones:
Catalog merchandise: +374%
Merchandise sold by brick-and-mortar establishments’ online stores: +207%
Furnishings and houseware items: +163%
The critical mass that’s finally been reached is most likely attributable to these factors:
The growing number of “responsive-design” websites that display and work equally well on any size device
One-click purchasing functionality that simplify and ease e-commerce procedures
Interestingly, the dramatic growth in smartphone usage for online shopping appears to be skipping over tablets. Smartphones now account for more than twice the share of online traffic compared to tablets (~30% versus ~13%).
Total e-commerce dollar sales on tablets have also fallen behind smartphones for the first time ever.
Evidently, some people are now gravitating from desktops or laptops straight to smartphones, with nary a passing glance at tablets.
Another interesting data point among the MarketLive stats is the fact that traffic emanating from search (paid as well as organic), is actually on the decline. By contrast, growth in traffic from e-mail marketing continues on its merry way, increasing ~18% over the same quarter last year.
One aspect remains a challenge in online commerce, however: The cart abandonment rate actually ticked up between 2014 and 2015. And conversion rates aren’t improving, either.
For the bottom line on what these new findings mean, I think Ken Burke, CEO of MarketLive, has it correct when he contends:
“Shoppers are seeking out their favorite brick-and-mortar brands online and expecting their websites to work on any device. We’re calling this trend ‘Commerce Anywhere the Customer Wants It.’ The more agile retailers and category leaders are outpacing their competitors by constantly adapting to – and embracing – a retail landscape where technology, consumers and markets are evolving at breakneck speed.”
Details on MarketLive’s statistics can be accessed here.
Too many business-to-business websites remain the “poor stepchildren” of the online world even after all these years.
So much attention is devoted to all the great ways retailers and other companies in consumer markets are delighting their customers online.
And it stands to reason: Those sites are often intrinsically more interesting to focus on and talk about.
Plus, the companies that run those sites go the extra mile to attract and engage their viewers. After all, consumers can easily click away to another online resource that offers a more compelling and satisfying experience.
Or, as veteran marketing specialist Denison ‘Denny’ Hatch likes to say, “You’re just one mouse-click away from oblivion.”
By comparison, buyers in the B-to-B sphere often have to slog through some pretty awful website navigation and content to find what they’re seeking. But because their mission is bigger than merely viewing a website for the fun of it, they’ll put up with the substandard online experience anyway.
But this isn’t to say that people are particularly happy about it.
Through my company’s longstanding involvement with the B-to-B marketing world, I’ve encountered plenty of the “deficiencies” that keep business sites from connecting with their audiences in a more fulfilling way.
Sometimes the problems we see are unique to a particular site … but more often, it’s the “SOS” we see across many of them (if you’ll pardon the scatological acronym).
Broadly speaking, issues of website deficiency fall into five categories:
They run too slowly.
They look like something from the web world’s Neanderthal era.
They make it too difficult for people to locate what they’re seeking on the site.
Worse yet, they actually lack the information visitors need.
They look horrible when viewed on a mobile device — and navigation is no better.
Fortunately, each of these problems can be addressed – often without having to do a total teardown and rebuild.
But corporate inertia can (and often does) get in the way.
Sometimes big changes like Google’s recent “Mobilegeddon” mobile-friendly directives come along that nudge companies into action. In times like that, it’s often when other needed adjustments and improvements get dealt with as well.
But then things can easily revert back to near-stasis mode until the next big external pressure point comes down the pike and stares people in the face.
Some of this pattern of behavior is a consequence of the commonly held (if erroneous) view that B-to-B websites aren’t ones that need continual attention and updating.
I’d love for more people to reject that notion — if for SEO relevance issues alone. But after nearly three decades of working with B-to-B clients, I’m pretty much resigned to the fact that there’ll always be some of that dynamic at work. It just comes with the territory.
Celebrating in the geriatric ward: The online banner ad turns 20.
It might come as a surprise to some, but the online banner ad is 20 years old this year.
In general, 20 years doesn’t seem very old, but in the online word, 20 years is ancient.
Simply put, banner ads represent the geriatric ward of online advertising.
In fact, there’s very little to love anymore about an advertising tool that once seemed so fresh and new … and now seems so tired and worn-out.
Furthermore, banner ads are a symbol of what’s wrong with online advertising. They’re unwelcome. They intrude on people’s web experience. And they’re ignored by nearly everyone.
A whole lotta … nothing? Online banner ads in 2015.
But despite all of this, banner ads are as ubiquitous as ever.
Consider these stats as reported by Internet analytics company ComScore:
The number of display ads served in the United States approaches 6 trillion annually.
Fewer than 500 different advertisers alone are responsible for delivering 1 billion of these ads.
The typical Internet user is served about 1,700 banner ads per month. (For 25 to 34 year-olds, it’s around 2,100 per month.)
Approximately 30% of banner ad impressions are non-viewable.
And when it comes to banner ad engagement, it’s more like … disengagement:
According to DoubleClick, Google’s ad serving services subisidary, banner ads have a click rate of .04% (4 out of every 10,000 served) for ads sized 468×60 pixels.
According to GoldSpot Media, as many as 50% of clicks on mobile banner ads are accidental.
According to ComScore, just 8% of Internet users are responsible for ~85% of the clicks on banner ads.
Come to think of it, “banner blindness” seems wholly appropriate for an advertising vehicle that’s as old as this one is in the web world.
The final ignominy is that people trust banner ads even less than they do TV ads: 15% vs. 29%, according to a survey conducted by market research company eMarketer.
Despite the drumbeat of negative news and bad statistics, banner advertising continues to be a bulwark of the online advertising system.
Publishers love them because they’re easy to produce and cost practically nothing to run.
Ad clients understand them better than other online promotional tactics, so they’re easier to sell either as premium content or as part of ad networks and exchanges.
There’s plenty of talk about native advertising, sponsored content and many other advertising tactics that seem a lot fresher and newer than banner ads. But I suspect we’ll continue to be inundated with them for years to come.
What do you think? Do you have a different prediction? Please share your thoughts with other readers here.
It seems like there’s a story every other day about security breaches affecting e-commerce sites and other websites where consumers congregate.
And now we have quantification of the challenge. Ghostery, a provider of apps that enable consumers to identify and block company tracking on website pages, has examined instances of non-secure digital technologies active on the websites of 50 leading brands in key industry segments like news, financial services, airlines and retail.
More specifically, Ghostery was looking for security “blind spots,” which it defines as non-secure tags that are present without the permission of the host company.
What it found was that 48 of the 50 websites it studied had security blind spots.
And often it’s not just one or two instances on a website. The analysis found that retail web pages host a high concentration of non-secure technologies: 438 of them on the Top Ten retail sites it analyzed (companies like Costco, Kohls, Overstock.com, Target and Walmart).
Financial services sites are also hit hard, with 382 blind spots identified, while airline websites had 223 instances. And they’re often present on the pages described as “secure” on these websites.
Scott Meyer, who is Ghostery’s chief executive officer, had this to say about the situation:
“Companies have very little understanding of what’s happening on their websites. The problem is not with any of the company’s marketing stacks, it’s with their own tech stacks. What these companies have now is marketing clouds, not websites, and they’ve gotten complicated and hard to manage.”
Scott Meyer, CEO of Ghostery (formerly The Better Advertising Project and Evidon).
There was one leading brand web site that came off looking squeaky clean compared to the others: Amazon. “Amazon is incredibly sophisticated; others are not,” Meyer noted.
The implications of avoiding addressing these security blind spots could be seriously negative. Bot networks often use non-secure technologies to gain entry to websites. Google is indexing company websites higher in search engine results based on their security ratings.
It makes it all the more important for companies to audit their websites and set up system alerts to identify the non-secure tags.
For the leading brands in particular, they just need to suck it up and do it for the benefit of their millions of customers.
The amount of translated content is also showing big-time growth.
According to an analysis by venture capitalist and Internet industry specialist Mary Meeker, in 2013 nine of the ten top global Internet properties were U.S.-based.
For the record, they were as follows (in order of ranking):
Google
Microsoft
Facebook
Yahoo
Wikipedia
Amazon
Ask
Glam Media
Apple
Only China-based Tencent cracked the Top Ten from outside the United States — and it just barely made it in as #10 in the rankings.
And yet … the same Top 10 Internet properties had nearly 80% of their users located outside America.
With such a disparity between broad-based Internet usage and concentrated Internet ownership, the picture was bound to change.
And boy, has it changed quickly: Barely a year later — as of March 2014 — the Top 10 listing now contains just six American-based companies.
Ask, Glam Media and Apple have all fallen off the list, replaced by three more China-based properties: Alibaba, Baidu and Sohu.
Paralleling this trend is another one: a sharp increase in the degree to which businesses are providing content in multiple languages.
For websites that offer some form of translated content, half of them are offering it in at least six languages. That’s double the number of languages that were being offered a year earlier.
And for a quarter of these firms, translated content is available in 15 or more languages.
What are the most popular languages besides English? Spanish, French, Italian and German are popular — not a great surprise there. But other languages that are becoming more prevalent include Portuguese, Chinese, Japanese and Korean.
In fact, the average volume of translated content has ballooned nearly 90% within just the past year.
The growing accuracy of computer-based translation modules — including surprisingly good performance in “idiomatic” language — is certainly helping the process along.
Moreover, when a major site like Facebook reports that its user base in France grew from 1.4 million to 2.4 million within just three months of offering its French-language site, it’s just more proof that the world may be getting smaller … but native language still remains a key to maximizing business success.
It’s one more reminder that for any company which hopes to compete in a transnational world, offering content in other languages isn’t just an option, but a necessity in order to build and maintain a strategic advantage.

 There’s no question that search engines have made the process of gaining knowledge, and researching products and services, extremely easy — often nearly effortless. The search bots do the work for us, helping us find the answers we’re seeking in the blink of an eye.