When it comes to smartphone capabilities … buyers want the basics.

With the plethora of smartphone models that seem to be released with ever-increasing frequently these days, one might think that the innovative features being added to the new smartphone models would be in high demand.

After all, the demand for smartphones looks as though it’s unquenchable; quarterly shipments of smartphones numbered some 366 million devices during the 3rd quarter of 2019 alone, according to data compiled by business consulting firm Strategy Analytics.

But the reality appears to be quite different. Recently, technology market research firm Global Web Index studied the popularity of various smartphone features, looking at a large sample of more than 550,000 consumers in the USA and UK.

As it turns out, the most desired smartphone feature is long battery life. And in fact, the top four smartphone features in terms of consumer importance don’t look like anything particularly jazzy:

  • Battery life: ~77% consider it the most desired smartphone feature
  • Storage capability: ~65%
  • Camera picture quality: ~62%
  • Screen resolution: ~48%

At the other end of the scale are four features which aren’t animating the market in any great way:

  • 5G compatibility: ~27%
  • Biometric security features: ~27%
  • Digital wellness features: ~16%
  • Virtual reality capabilities: ~10%

There’s no question that the newest smartphone models can do a lot more than their earlier iterations. But users want them to do the basics — and to do them well. Other capabilities are simply ornaments on the tree.

For more findings from the Global Web Index study, click here.

Smartphones go mainstream with all age groups.

Today, behaviors across the board are far more “similar” than they are “different.”

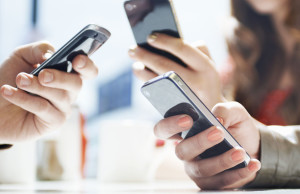
Over the past few years, smartphones have clawed their way into becoming a pervasive presence among consumers in all age groups.

That’s one key takeaway message from Deloitte’s 2017 Mobile Consumer Survey covering U.S. adults.

According to the recently-released results from this year’s research, ~82% of American adults age 18 or older own a smartphone or have ready access to one. It’s a significant jump from the ~70% who reported the same thing just two years ago.

While smartphone penetration is highest among consumers age 18-44, the biggest increases in adoption are coming in older demographic categories.  To illustrate, ~67% of Deloitte survey respondents in the age 55-75 category own or have ready access to smartphones, which is big increase from the ~53% who reported so in 2015.

It represents an annual rate of around 8% for this age category.

The Deloitte research also found that three’s little if any difference in the behaviors of age groups in terms of how they interact with their smartphones. Daily smartphone usage is reported by 9 in 10 respondents regardless of the age bracket.

Similarly-consistent across all age groups is the frequency that users check their phones during any given day. For the typical consumer, it happens 47 times daily on average.  Fully 9 in 10 report looking at their phones within an hour of getting up, while 8 in 10 do the same just before going to sleep.

At other times during the day, the incidence of smartphone usage quite high in numerous circumstances, the survey research found:

  • ~92% of respondents use smartphones when out shopping
  • ~89% while watching TV
  • ~85% while talking to friends or family members
  • ~81% while eating at restaurants
  • ~78% while eating at home
  • ~54% during meetings at work

As for the “legacy” use of cellphones, a smaller percentage of respondent’s report using their smartphones for making voice calls. More than 90% use their smartphone to send and receive text messages, whereas a somewhat smaller ~86% make voice calls.

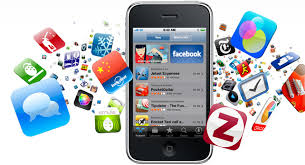
As for other smartphone activities, ~81% are sending and receiving e-mail messages via their smartphone, ~72% are accessing social networks on their smartphones at least sometimes during the week, and ~30% report making video calls via their smartphones – which is nearly double the incidence Deloitte found in its survey two years ago.

As for the respondents in the survey who use smartwatches, daily usage among the oldest age cohort is the highest of all: Three-quarters of respondents age 55-75 reported using their smartwatches daily, while daily usage for younger consumers was 60% or even a little below.  So, in this one particular category, older Americans are actually ahead of their younger counterparts in adoption and usage.

The Deloitte survey shows pretty definitively that it’s no longer very valid to segregate older and younger generations. While there may be some slight variations among younger vs. older consumers, the reality is that market behaviors are far more the same than they are different.  That’s the first time we’ve seen this dynamic playing out in the mobile communications segment.

Additional findings from the Deloitte research can be found in an executive summary available here.

Suddenly, smartphones are looking like a mature market.

The smartphone diffusion curve. (Source: Business Insider)

In the consumer technology world, the pace of product innovation and maturation seems to be getting shorter and shorter.

When the television was introduced, it took decades for it to penetrate more than 90% of U.S. households. Later, when color TVs came on the market, it was years before the majority of households made the switch from black-and-white to color screens.

The dynamics of the mobile phone market illustrate how much the pace of adoption has changed.

Only a few years ago, well-fewer than half of all mobile phones in the market were smartphones. But smartphones rapidly eclipsed those older “feature phones” – so that now only a very small percentage of cellphones in use today are of the feature phone variety.

Now, in just as little time we’re seeing smartphones go from boom to … well, not quite bust.  In fewer than four years, the growth in smartphone sales has slowed from ~30% per year (in 2014) to just 4%.

That’s the definition of a “mature” market.  But it also demonstrates just how successful the smartphone has been in penetrating all corners of the market.

Consider this:  Market forecasting firm Ovum figures that by 2021, the smartphone will have claimed its position as the most popular consumer device of all time, when more than 5 billion of them are expected to be in use.

It’s part of a larger picture of connected smart devices in general, for which the total number in use is expected to double between now and 2021 – from an estimated 8 billion devices in 2016 to around 15 billion by then.

According to an evaluation conducted by research firm GfK, today only around 10% of consumers own either an Amazon Echo or Google Home device, but digital voice assistants are on the rise big-time. These interactive audio speakers offer a more “natural” way than smartphones or tablets to control smart home devices, with thousands of “skills” already perfected that allow them to interact with a large variety of apps.

There’s no question that home devices are the “next big thing,” but with their ubiquity, smartphones will continue to be the hub of the smart home for the foreseeable future.  Let’s check back in another three or four years and see how the dynamics look then.

What’s Up with Apps These Days?

Results from comScore’s latest annual U.S. Mobile App Report point to some interesting user behaviors.

No one needs to be reminded of how important mobile apps have become in today’s world of communications. Just looking around any crowd of people, it’s clear that usage has become well-nigh ubiquitous.

And now, we have some new stats that help quantify what’s happening, courtesy of the most recent annual Mobile App Report published by global media measurement and analytics firm comScore.

Among the salient findings from this report:

  • Today, mobile devices represent two of every three minutes spent on digital media.
  • Smartphone apps alone account for nearly half of all digital media time spent – and three of every four minutes spent while on mobile.
  • Over the past three years, total time spent on digital media has grown by over 50%. Most all of that growth has been because of mobile apps.
  • Indeed, time spent on desktop media has actually dropped by more than 10%.

Despite the rapid rise of mobile app usage, there are a few findings in the comScore report that point toward some consolidation of the market, with certain apps being the recipient of strong brand loyalties.

Typically, while smartphone users have uploaded many apps on their devices – and may use several dozens of them on a monthly basis – nine out of every ten mobile app minutes are spent with just five top apps.

[Good luck to any app provider attempting to break into that rarefied group of top performers!]

At the same time, “push notification fatigue” appears to be a growing issue: More smartphone users are rejecting app update notifications than ever before.  According to comScore’s recent report, nearly 40% of users rarely or never agree to such update notifications – up significantly from around 30% last year.

Conversely, only about 25% often or always agree to updates, which is down from about one-third of users in last year’s survey.

This last set of figures doesn’t surprise me in the least. With so many apps housed on so many devices, one could easily spend an hour each day accessing nothing but app updates.

Especially considering how little additional functionality these ongoing updates actually deliver, the whole operation falls into the “life’s too short” category.

Facebook reigns supreme among smartphone apps — at least in the United States.

faWhich was the most popular smartphone app in the United States during 2015? If you guessed Facebook, you’d be correct.

According to Nielsen estimates, the Facebook app notched more than 125 million average unique users per month during 2015. It was an ~8% increase in the app’s user volume over the previous year.

The second most popular smartphone app was YouTube, but at fewer than 100 million, its average unique user volume was substantially lower than Facebook’s.

The Nielsen estimates are calculated based on a monthly survey of 30,000+ mobile subscribers age 13 and older in the United States, as well as a panel of ~9,000 English-speaking adults (age 18+).

Here is Nielsen’s “Top Ten” chart for the most popular smartphone apps in 2015:

  • Facebook app: ~127 million average unique monthly users
  • YouTube: ~98 million
  • Facebook Messenger: ~96 million
  • Google Search: ~95 million
  • Google Play: ~90 million
  • Google Maps: ~88 million
  • Gmail: ~75 million
  • Instagram: ~56 million
  • Apple Music: ~55 million
  • Apple Maps: ~47 million

Within the top ten list, the two apps with the highest user growth in 2015 were Facebook Messenger, which charted an increase in average monthly users of ~31%, and Apple Music, with ~26% growth.

Also noted by Nielsen, the level of smartphone penetration ticked up yet again in 2015, so that today four out of five mobile subscribers are using a smartphone rather than a feature phone.

fa anAs for the ongoing competition between Apple and Android for smartphone hegemony, it remains a real donnybrook but with Android ahead.

As of Q3 2015, Android devices represented ~52.5% of the subscriber base whereas ~42.5% of Americans used Apple iOS devices to access their apps.  (The remainder is made up of Blackberry users and phones operating on Windows.)

Additional information about the Nielsen evaluation and analysis can be viewed here.  It will be interesting to see how these trends might change in 2016.  Would anyone care to make any predictions?

The mouse that roared: Smartphones take on bigger screens – and they’re winning.

The key takeaway message from MarketLive’s latest e-commerce statistics is that smartphones are where the go-go action is in e-commerce.

SmartphonesIf there’s any lingering doubt that smartphones are really on the march when it comes to e-commerce activity, the latest user stats are erasing all vestiges of it.

MarketLive’s 2nd Quarter e-commerce stats for 2015 reveal that mass-market consumers purchased ~335% more items via their smartphones than they did during the comparable quarter last year.

MarketLive’s report covers the buying activity of millions of online consumers. And the uptick it’s showing is actually more like a flood of increased activity.  That’s plain to see in these year-over-year 2nd Quarter comparative figures for smartphones:

  • Catalog merchandise: +374%
  • Merchandise sold by brick-and-mortar establishments’ online stores: +207%
  • Furnishings and houseware items: +163%

The critical mass that’s finally been reached is most likely attributable to these factors:

  • The growing number of “responsive-design” websites that display and work equally well on any size device
  • One-click purchasing functionality that simplify and ease e-commerce procedures

Interestingly, the dramatic growth in smartphone usage for online shopping appears to be skipping over tablets. Smartphones now account for more than twice the share of online traffic compared to tablets (~30% versus ~13%).

Total e-commerce dollar sales on tablets have also fallen behind smartphones for the first time ever.

Evidently, some people are now gravitating from desktops or laptops straight to smartphones, with nary a passing glance at tablets.

Another interesting data point among the MarketLive stats is the fact that traffic emanating from search (paid as well as organic), is actually on the decline.  By contrast, growth in traffic from e-mail marketing continues on its merry way, increasing ~18% over the same quarter last year.

One aspect remains a challenge in online commerce, however: The cart abandonment rate actually ticked up between 2014 and 2015. And conversion rates aren’t improving, either.

Marketlive logoFor the bottom line on what these new findings mean, I think Ken Burke, CEO of MarketLive, has it correct when he contends:

“Shoppers are seeking out their favorite brick-and-mortar brands online and expecting their websites to work on any device. We’re calling this trend ‘Commerce Anywhere the Customer Wants It.’ The more agile retailers and category leaders are outpacing their competitors by constantly adapting to – and embracing – a retail landscape where technology, consumers and markets are evolving at breakneck speed.” 

Details on MarketLive’s statistics can be accessed here.

Is Telephone Landline Usage Doing a Disappearing Act?

phoneIt may be a surprise to some people, but we’re getting pretty close to half of all households in America that are now without any sort of telephone landline.

[Actually, it’s not quite there yet – the percentage is ~44%.  But the trend is clear, and it’s accelerating.]

The latest statistics come to us courtesy of GfK Mediamark Research.  And GfK’s consumer survey findings align with other published survey data from U.S. government sources.

Just five years ago, only about one in four American adults lived in cellphone-only households.  But since then, the cellphone-only population has jumped by ~70%.

And when we look at a breakdown by age demographics, it becomes even more obvious that we’re in the midst of a transformation.

Here are the stark figures:

  • Pre-Boomers (born before 1946): ~13% live in cellphone-only households
  • Baby Boomers (born from 1946 to 1965): ~32% live in cellphone-only HHs
  • Generation X (born from 1965 to 1976): ~45% live in cellphone-only HHs
  • Millennials (born from 1977 to 1994): ~64% live in cellphone-only HHs

Mirroring the age statistics are ownership rates for smartphones:  very high among millennials down to very low among pre-Boomers:

  • Millennials: ~88% own a smartphone
  • Generation X: ~79 own a smartphone
  • Baby Boomers: ~56 own a smartphone
  • Pre-Boomers: ~20% own a smartphone

[Additional topline findings from the GfK research can be viewed here.]

Based on the trends we’re seeing, how soon will it be that telephone landlines become a thing of the past?  I’d be interested in hearing your perspectives.

The “App Gap”: Mobile Apps Overtake All Others in Digital Media Consumption

Mobile apps overtaking other digital media consumptionIt was bound to happen.

The bulk of time Americans are spending on digital media … is now happening on mobile applications.

According to data released this past week by Internet and digital analytics firm comScore, the combined time that people expend using digital media breaks down as follows:

  • Mobile apps: ~52% of all time spent online
  • Mobile web surfing: ~8%
  • Desktop: ~40%

Apps are clearly in the driver’s seat – particularly in the mobile realm.  In fact, comScore estimates that apps account for 7 out of every 8 minutes spent on mobile devices.

On smartphones, the app usage is ~88% of all time spent, whereas on tablets, it’s ~82%.

This doesn’t mean that app usage is spread evenly throughout the population of people who are online.  Far from it.  Only about one-third of people download one app per month or more.  (The average smartphone user is downloading about three apps per month.)

The inevitable conclusion:  App usage is highly concentrated among a subset of the population.

Indeed, the 7% most active smartphone owners account for almost half of all the download activity during any given month.

But even if most users aren’t downloading all that many apps … they are certainly engaged with the ones they do have on their devices:  comScore reports that nearly 60% are using apps every day.

Here again, the data show that usage levels are much higher among smartphone users than they are with tablet users (where only about one quarter of the people use apps daily).

Where they’re spending their time is also interesting.  Well over 40% of all app time spent on smartphones is with a user’s single most used app.  (Facebook takes top honors — of course.)

And if you combine social networking, games and Internet radio, you’ve pretty much covered the waterfront when it comes to app usage.

When you think about it, none of this should come as much surprise.  We’re a mobile society – hourly, daily, monthly and yearly.  It only makes sense that most online time is going to be happening when people are away from their home or their desk, now that it’s so easy to be connected so easily from even the tiniest mobile devices.

And speaking of “easy” … is it really any wonder why people would flock to apps?  It’s less hassle to open up an app for news or information rather than searching individual sites via mobile.  People simply don’t have the patience for that anymore.

Samsung gets its marketing knuckles wrapped – twice.

Samsung logoTech manufacturing giant Samsung’s “questionable” marketing activities have been in the news this past week – again.

This time, it’s reported that the company has been fined a $340,000 penalty for paying people to post trash-talk comments about competitor HTC’s products in customer online forums in Taiwan.

Back in April, the Fair Trade Commission in Taiwan opened an investigation into allegations that Samsung had recruited certain employees along with freelance writers from the outside to flack the shortcomings of its competitors’ products.

In addition to the company being held culpable, two of Samsung’s outside marketing firms were fined for their part in the marketing shenanigans masquerading as natural content.

This is pretty big news in the world of smartphones.  HTC and Samsung are major competitors in this highly competitive marketplace, and both companies offer products that operate on the Android platform.

But Samsung’s fortunes have risen dramatically over the past year as its global smartphone market share jumped from ~19% to ~30%.

By contrast, HTC’s share declined from ~9% to slightly less than ~5% over the same period.

Evidently, Samsung couldn’t resist the temptation to kick a competitor when it was already on the ropes.

Chalk it up to the “take no prisoners” atmosphere in the cutthroat competitive world of mobile technology – the “New York Garment District mentality” writ large.

“Astro-turfing” isn’t new, of course.  But the practice is usually the province of smaller companies with fewer scruples … or marketing people who are simply unaware of proper marketing etiquette (and often backed by legal opinion).

Amateur hour
“Amateur hour” at Samsung’s marketing department makes the company look just … silly.

For a company as large and as sophisticated at Samsung, it does seem a little … odd.  And certainly not in good form.

But as it turns out, this isn’t the first time Samsung’s gotten caught with its marketing pants down.

Just a few months ago, the company was discovered bribing various people to “talk up” its development activities – and “talk down” their competitors – during the Samsung Smart App Challenge competition.

Android developer Delyan Kratunov went public with ongoing correspondence in which a viral marketing company working for Samsung offered him $500 to cite positive mentions on the Stack Overflow online community.

The instructions were specific:  Mr. Kratunov would need to ask a series of “casual and organic” questions about Samsung’s app challenge over a month-long period.

Later, the marketing company attempted to distance itself from the egregious behavior — but not before the incident had been exposed.

My response to Samsung is this:  You’re already winning.  There’s no need to engage in “adolescent business behavior” of this kind.

It’s in very bad form … and sooner or later it’ll come back to bite you.

Stuff like this always does eventually.

Smartphones and Tablets have Doubled Our Time Spent Online

screenjumpersWhat a difference a few years makes.

Back in February 2010, Americans over the age of 18 spent a total of ~451 billion minutes’ time on the Internet, according to comScore’s Media Metrix research.

By comparison, in February 2013, the total time spent online had nearly doubled to ~890 minutes.

The vast majority of the increase is attributable to tablet computers and smartphones rather than PCs:

  • PC minutes rose from ~388 billion to ~467 billion (+24%).
  • Smartphone minutes grew from ~63 billion to a whopping ~208 billion (+230%).
  • Tablet minutes grew from zero to 115 billion (tablets didn’t exist in 2010).

In fact, taken together, smartphones and tablets now account for nearly 60% of the time online spent by people age 18 to 24.  On the other hand, smartphones account for a relatively small 25% of time spent online by Americans age 50 or older.

This age divide is also clearly evident in comScore’s estimated breakdown of platform adoption:

All American Adults

  • PC only:  ~30%
  • “Screen jumpers” (PC + mobile):  ~63%
  • Mobile platforms only:  ~7%

Young Adults (age 18-24)

  • PC only:  ~22%
  • Screen jumpers:  ~65%
  • Mobile only:  ~13%

Older Adults (age 50+)

  • PC only:  ~48%
  • Screen jumpers:  ~51%
  • Mobile only:  ~1%

The comScore analysis also provides some interesting stats pertaining to online share of minutes by the type of content being accessed.

Most online time spent on PCs:

  • Business/Finance (~68%)
  • TV (~68%)
  • News/Information (~62%)
  • Sports (~62%)
  • Retail (~49%)
  • Health (~54%)

Most online time spent on smartphones:

  • Radio (~77%)
  • Social Media (~58%)
  • Weather (~55%)
  • Games (~48%)

Tablets don’t lead in any single category, but score particularly well in these two:

  • Games (~34% of time online is spent on tablets)
  • TV (~20% of time online is spent on tablets)

More details and insights from the comScore report can be found here.