Any way you slice it, Google continues to dominate the search ecosystem.

Just how big is Google in the world of search? I’ve seen percentages that are all over the map, but one thing is undeniable:  Google remains the overwhelming leader in search.

And it isn’t even close. Runners-up in the search engine derby include Bing/Yahoo and DuckDuckGo, but they’re so small so as to be mere asterisks at the bottom of the page.

… Which might be surprising to some. After all, as late as 2015 comScore was reporting that Google’s market share of desktop search was running around 64%, whereas the Bing family of search products (including Yahoo and AOL) was tracking in the low 30s.

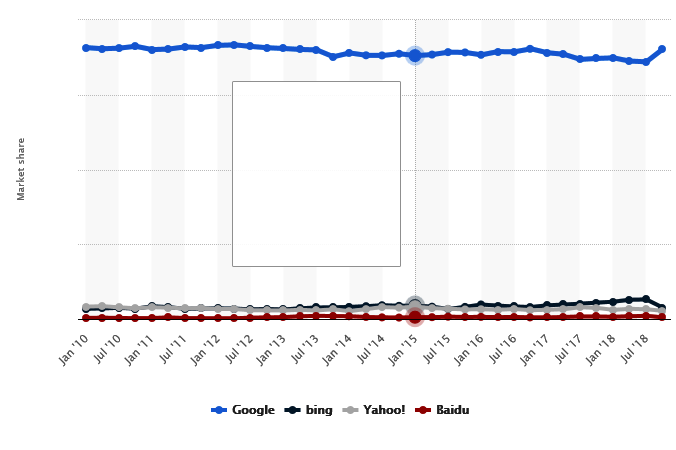
But it’s all in how you make the calculations. At the very same time, Statista was reporting that Google’s worldwide share of desktop search was approximately 89%.

Moreover, Statista’s trend line for Google between 2010 and the end of 2018 is remarkably consistent, with Google’s share of desktop search charting in a narrow range between 86% and 90%:

But I think it’s the data from marketing intelligence and analytics firm Jumpshot that gets us closest to what’s actually happening in the world of search. Jumpshot licenses anonymized ClickStream data from hundreds of millions of users.  It finds that ~63% of all online searches are through Google’s “core” function.

But then one needs to factor in additional Google-related search activity that occurs on Google Maps, Google image search and YouTube, which is owned by Google. When those figures are added to the mix, Google’s market share of search is indeed in excess of 90%, with all other players way, way behind.

This graph shows the makeup of Google’s dominant position as compared to its search competitors:

Source: Jumpshot (based on ClickStream data), 2018.

These dynamics explain why Google remains so entrenched – and why advertisers continue to devote so much of their search engineering advertising dollars to Google properties.

A “constant” in Google’s market strategy over the years has been to make it easy and effortless for users to perform a Google search wherever they are.  In years past, that meant making Google the Home Page on as many Internet browsers a possible. In more recent times it’s taken the form of building activity on Google-centric browsers (Google Chrome), mobile market share (Android), acquiring the dominant video platform (YouTube), and making a major push into voice search with Google Home.

Essentially, wherever someone is … Google is there as well. It’s very much like a commodity or a utility.  (Indeed, its very name has become synonymous with the verb “to search.”)

In case anyone is counting, Google processes an eye-popping 3.5 billion searches per day.  Is it any wonder that any competitor – even a platform like Bing with resources to spend – would have a near-insurmountable challenge getting millions of people to just try a different search option (much less start using it regularly).

Could the situation change?  I suppose nothing is immutable.  The market share figures don’t yet factor in iPhone data at scale.  Some other search product might emerge that is dramatically better-performing than Google.

But none of those factors are likely to change the overall search ecosystem. The fact is, Google dominates search … it has dominated search for years … and it’s on track to continue doing so in the future.

I close with a question to readers. If any of you prefer using a different search product besides Google, please share your reasons why in the comment section below.

In digital retail, there’s Amazon and then there’s … everyone else.

When it comes to online retailing in the United States, Amazon’s been cleaning up for years. And now we have new data from comScore that reveals that Amazon is as dominant online today as it’s ever been.

This chart illustrates it well:

dms
* MediaMetrix Multi-Platform, US, December 2017. Source: comScore 2018 State of the U.S. Online Retail Economy.

The chart shows that when comparing actual time spent by Americans at each of the Top 10 online retailers, Amazon attracts more viewing time than the other nine entities combined.

Even when considering only mobile minutes, where so much of the growth is happening for digital retailers, Amazon’s mobile viewing time exceeds the combined total digital traffic across eBay, Walmart, Wish, Kohl’s and Etsy.

Pertaining to the mobile sphere, there is an interesting twist that comScore has found in consumer behavior. It turns out, there’s a considerable disparity between the amount of time spent with mobile compared to its share of dollars spent – to the tune of a 40% gap:

srts
MediaMetrix Multi-Platform and ecommerce / mCommerce Measurement, Q4 2017. Source: comScore 2018 State of the U.S. Online Retail Economy.

In essence, the data show that whereas mobile represents nearly two-thirds of the time spent with online retail, it accounts for only one-fourth of the dollars spent on goods and services.

But this difference is easy to explain:  As the largest player in the field, Amazon fulfills a role similar to what Expedia or Trivago do in the travel industry.

Amazon gives consumers a way to scan the marketplace not only for product details but also for prevailing prices, giving them a sense of the expected price ranges for products or services — even if they ultimately choose to purchase elsewhere.

What’s Up with Apps These Days?

Results from comScore’s latest annual U.S. Mobile App Report point to some interesting user behaviors.

No one needs to be reminded of how important mobile apps have become in today’s world of communications. Just looking around any crowd of people, it’s clear that usage has become well-nigh ubiquitous.

And now, we have some new stats that help quantify what’s happening, courtesy of the most recent annual Mobile App Report published by global media measurement and analytics firm comScore.

Among the salient findings from this report:

  • Today, mobile devices represent two of every three minutes spent on digital media.
  • Smartphone apps alone account for nearly half of all digital media time spent – and three of every four minutes spent while on mobile.
  • Over the past three years, total time spent on digital media has grown by over 50%. Most all of that growth has been because of mobile apps.
  • Indeed, time spent on desktop media has actually dropped by more than 10%.

Despite the rapid rise of mobile app usage, there are a few findings in the comScore report that point toward some consolidation of the market, with certain apps being the recipient of strong brand loyalties.

Typically, while smartphone users have uploaded many apps on their devices – and may use several dozens of them on a monthly basis – nine out of every ten mobile app minutes are spent with just five top apps.

[Good luck to any app provider attempting to break into that rarefied group of top performers!]

At the same time, “push notification fatigue” appears to be a growing issue: More smartphone users are rejecting app update notifications than ever before.  According to comScore’s recent report, nearly 40% of users rarely or never agree to such update notifications – up significantly from around 30% last year.

Conversely, only about 25% often or always agree to updates, which is down from about one-third of users in last year’s survey.

This last set of figures doesn’t surprise me in the least. With so many apps housed on so many devices, one could easily spend an hour each day accessing nothing but app updates.

Especially considering how little additional functionality these ongoing updates actually deliver, the whole operation falls into the “life’s too short” category.

Banner Ads Turn 20 This Year …

… But who really wants to celebrate?

paint the town red
Celebrating in the geriatric ward: The online banner ad turns 20.

It might come as a surprise to some, but the online banner ad is 20 years old this year.

In general, 20 years doesn’t seem very old, but in the online word, 20 years is ancient.

Simply put, banner ads represent the geriatric ward of online advertising.

In fact, there’s very little to love anymore about an advertising tool that once seemed so fresh and new … and now seems so tired and worn-out.

Furthermore, banner ads are a symbol of what’s wrong with online advertising.  They’re unwelcome.  They intrude on people’s web experience.  And they’re ignored by nearly everyone.

Old banner advertising
A whole lotta … nothing? Online banner ads in 2015.

But despite all of this, banner ads are as ubiquitous as ever.

Consider these stats as reported by Internet analytics company ComScore:

  • The number of display ads served in the United States approaches 6 trillion annually.
  • Fewer than 500 different advertisers alone are responsible for delivering 1 billion of these ads. 
  • The typical Internet user is served about 1,700 banner ads per month. (For 25 to 34 year-olds, it’s around 2,100 per month.) 
  • Approximately 30% of banner ad impressions are non-viewable.

paying no attention to advertisingAnd when it comes to banner ad engagement, it’s more like … disengagement:

  • According to DoubleClick, Google’s ad serving services subisidary, banner ads have a click rate of .04% (4 out of every 10,000 served) for ads sized 468×60 pixels. 
  • According to GoldSpot Media, as many as 50% of clicks on mobile banner ads are accidental. 
  • According to ComScore, just 8% of Internet users are responsible for ~85% of the clicks on banner ads.

Come to think of it, “banner blindness” seems wholly appropriate for an advertising vehicle that’s as old as this one is in the web world.

The final ignominy is that people trust banner ads even less than they do TV ads:  15% vs. 29%, according to a survey conducted by market research company eMarketer.

Despite the drumbeat of negative news and bad statistics, banner advertising continues to be a bulwark of the online advertising system.

Publishers love them because they’re easy to produce and cost practically nothing to run.

Ad clients understand them better than other online promotional tactics, so they’re easier to sell either as premium content or as part of ad networks and exchanges.

There’s plenty of talk about native advertising, sponsored content and many other advertising tactics that seem a lot fresher and newer than banner ads.  But I suspect we’ll continue to be inundated with them for years to come.

What do you think?  Do you have a different prediction?  Please share your thoughts with other readers here.

The “App Gap”: Mobile Apps Overtake All Others in Digital Media Consumption

Mobile apps overtaking other digital media consumptionIt was bound to happen.

The bulk of time Americans are spending on digital media … is now happening on mobile applications.

According to data released this past week by Internet and digital analytics firm comScore, the combined time that people expend using digital media breaks down as follows:

  • Mobile apps: ~52% of all time spent online
  • Mobile web surfing: ~8%
  • Desktop: ~40%

Apps are clearly in the driver’s seat – particularly in the mobile realm.  In fact, comScore estimates that apps account for 7 out of every 8 minutes spent on mobile devices.

On smartphones, the app usage is ~88% of all time spent, whereas on tablets, it’s ~82%.

This doesn’t mean that app usage is spread evenly throughout the population of people who are online.  Far from it.  Only about one-third of people download one app per month or more.  (The average smartphone user is downloading about three apps per month.)

The inevitable conclusion:  App usage is highly concentrated among a subset of the population.

Indeed, the 7% most active smartphone owners account for almost half of all the download activity during any given month.

But even if most users aren’t downloading all that many apps … they are certainly engaged with the ones they do have on their devices:  comScore reports that nearly 60% are using apps every day.

Here again, the data show that usage levels are much higher among smartphone users than they are with tablet users (where only about one quarter of the people use apps daily).

Where they’re spending their time is also interesting.  Well over 40% of all app time spent on smartphones is with a user’s single most used app.  (Facebook takes top honors — of course.)

And if you combine social networking, games and Internet radio, you’ve pretty much covered the waterfront when it comes to app usage.

When you think about it, none of this should come as much surprise.  We’re a mobile society – hourly, daily, monthly and yearly.  It only makes sense that most online time is going to be happening when people are away from their home or their desk, now that it’s so easy to be connected so easily from even the tiniest mobile devices.

And speaking of “easy” … is it really any wonder why people would flock to apps?  It’s less hassle to open up an app for news or information rather than searching individual sites via mobile.  People simply don’t have the patience for that anymore.

Pinterest: Will it ever become a male hangout?

Pinterest logoHere’s a statistic about social media platform Pinterest that will probably surprise few people:  As of June 2014 statistics reported by digital analytics firm comScore, its user base is more than 70% female.

… Which means that Pinterest remains the most “gender imbalanced” of all the major social media platforms.

For the record, other social platforms have far more gender balance among their user bases – with at least 45% being male:

  • SnapChat:  52% male
  • Tumblr:  52%
  • Twitter:  48%
  • Facebook:  47%
  • Instagram:  45%
  • Pinterest:  28%

But here’s the thing:  Pinterest has been trying mightily hard to attract more male participants, but the proportional figures have yet to budge.

This points to a fundamental challenge.  It’s very difficult to change the image and atmospherics of a social platform once they’ve become so firmly entrenched.

And it’s not just a question of image.  The platform’s content says it all.

Jill Sherman, vice president of social and content strategy at marketing communications firm DigitasLBi, puts it this way:

“If you pull up Pinterest and go into any content section, you will see purses, dresses and women’s shoes — because women are the user base.  When 70% of the users are female, then 70% of the content is going to be female-oriented.” 

Pinterest for menHope springs eternal, however.  Pinterest is continuing its effort to attract more men.

Or at least … to make the site more “guy friendly” when a new member goes there signs up.  This means making sure to show items more stereotypically catering to men’s interests rather than things like women’s fashion items.

But how to get men to the stage of even signing up?  That challenge falls to Pinterest’s new “head of brand” – who just happens to be a man.

David Rubin
David Rubin

He’s David Rubin, erstwhile senior vice president of marketing at Unilever, where he worked on marketing the Axe brand of men’s body care products.

Mr. Rubin might wish to start his tenure by asking himself what would bring him to engage with Pinterest more … because according to news reports, Rubin had posted only 22 items on Pinterest prior to joining the company.

DigitasLBi’s Jill Sherman sees a challenge for Pinterest that is fundamentally basic.  “They haven’t cracked the motivation code:  How to attract men and keep them using the platform beyond saving things that pique their interest.”

I agree – and I’d go a step further.  Convincing people to visit Pinterest to find or view something of interest “feels” like a function a search engine such as Google Images is doing quite well already.  Who needs “yet another place” to tap into that functionality?  Especially if one is a male of the species?

In order for Pinterest to evolve beyond where it is today, perhaps it needs to look at what Facebook and others have been doing to create communities and interaction beyond just pretty pictures and videos.

It could be a tall order.

Smartphones and Tablets have Doubled Our Time Spent Online

screenjumpersWhat a difference a few years makes.

Back in February 2010, Americans over the age of 18 spent a total of ~451 billion minutes’ time on the Internet, according to comScore’s Media Metrix research.

By comparison, in February 2013, the total time spent online had nearly doubled to ~890 minutes.

The vast majority of the increase is attributable to tablet computers and smartphones rather than PCs:

  • PC minutes rose from ~388 billion to ~467 billion (+24%).
  • Smartphone minutes grew from ~63 billion to a whopping ~208 billion (+230%).
  • Tablet minutes grew from zero to 115 billion (tablets didn’t exist in 2010).

In fact, taken together, smartphones and tablets now account for nearly 60% of the time online spent by people age 18 to 24.  On the other hand, smartphones account for a relatively small 25% of time spent online by Americans age 50 or older.

This age divide is also clearly evident in comScore’s estimated breakdown of platform adoption:

All American Adults

  • PC only:  ~30%
  • “Screen jumpers” (PC + mobile):  ~63%
  • Mobile platforms only:  ~7%

Young Adults (age 18-24)

  • PC only:  ~22%
  • Screen jumpers:  ~65%
  • Mobile only:  ~13%

Older Adults (age 50+)

  • PC only:  ~48%
  • Screen jumpers:  ~51%
  • Mobile only:  ~1%

The comScore analysis also provides some interesting stats pertaining to online share of minutes by the type of content being accessed.

Most online time spent on PCs:

  • Business/Finance (~68%)
  • TV (~68%)
  • News/Information (~62%)
  • Sports (~62%)
  • Retail (~49%)
  • Health (~54%)

Most online time spent on smartphones:

  • Radio (~77%)
  • Social Media (~58%)
  • Weather (~55%)
  • Games (~48%)

Tablets don’t lead in any single category, but score particularly well in these two:

  • Games (~34% of time online is spent on tablets)
  • TV (~20% of time online is spent on tablets)

More details and insights from the comScore report can be found here.

The Free Lunch Ends on Facebook

Promoted posts on Facebook is the only way to get exposure anymore.
Promoted posts are the only way to ensure decent exposure on Facebook now.

It had to happen.  Suffering from a raft of unflattering news stories about its inability to monetize the Facebook business model and under withering criticism from investors whose post-IPO stock price has been battered, Facebook has been rolling out new policies aimed at redressing the situation.

The result?  No longer can companies or organizations utilize Facebook as a way to advance their brand “on the cheap.”

Under a program that began rolling out this summer and has snowballed in recent months, businesses must pay Facebook anywhere from a fiver to triple figures to “promote” each of their posts to the people who have “liked” their pages plus the friends of those users.

And woe to the company that doesn’t choose to play along or “pay along” … because the average percentage of fans who sees any given non-promoted post has plummeted to … just 16%, according to digital marketing intelligence firm comScore.

Facebook views this as a pretty significant play, because its research shows that Facebook friends rarely visit a brand’s Facebook page on a proactive basis. 

Instead, the vast degree of interaction with brands on Facebook comes from viewing newsfeed posts that appear on a user’s own Facebook wall.

What this means is that the effort that goes into creating a brand page on Facebook, along with a stream of compelling content, is pretty much wasted if abrand isn’t  willing to spend the bucks to “buy”exposure on other pages.

So the new situation in an ever-changing environment boils down to this:

  • Company or brand pages on Facebook are (still) free to create.  
  • To increase reach, companies undertake to juice the volume of “likes” and “fans” through coupons, sweepstakes, contests and other schemes that cost money.
  • And now, companies must spend more money to “promote” their updates on their fan’s own wall pages.  Otherwise, only a fraction of them will ever see them.

Something else seems clear as well:  The promotion dollars are becoming serious money

Even for a local or regional supplier of products or services that wishes to promote its brand to its fan base, a yearly budget of $5,000 to $10,000 is likely what’s required take to generate an meaningful degree of exposure.

Many small businesses were attracted to Facebook initially because of its free platform and potential reach to many people.  Some use Facebook as their de facto web presence and haven’t even bothered to build their own proprietary websites.

So the latest moves by Facebook come as a pretty big dash of cold water.  It’s particularly tough for smaller businesses, where a $10,000 or $20,000 advertising investment is a major budget item, not a blip on the marketing radar screen.

What’s the alternative?  Alas, pretty much all of the other important social platforms have wised up, it seems. 

For those businesses who may wish to scout around for other places in cyberspace where they can piggyback their marketing efforts on a free platform, they won’t find all that much out there anymore.  Everyone seems to be busily implementing “pay-to-play” schemes as well.

FourSquare now has “promoted updates” in which businesses pay to be listed higher in search results on its mobile app.  And LinkedIn has an entire suite of “pay-for” options for promoting companies and brands to target audiences.

It’s clearly a new world in the social sphere … but one that reverts back to the traditional advertising monetary model:  “How much money do you have to spend?”

Tablet Computer Adoption: Fast and Furious

Tablets are growing faster than smartphone adoptionThe tablet computer hasn’t been around long at all.  But it’s making a huge splash in the digital arena … and giving not only laptops but also smartphones a run for their money in the bargain.

Consider these data points as reported on recently by Mark Donovan, a senior vice president at comScore, a leading Internet cyber-analytics firm:

  • Tablet adoption is happening significantly faster than what was experienced with smartphones.
  • The majority of iPad users don’t own an iPhone or some other type of smartphone.
  • Tablet “early adopters” are equally male and female – a departure from the norm which typically finds early adopters of new digital technology being primarily young men.
  • There is very high usage of tablets for shopping, watching video, and other media consumption. That’s also a departure from what was experienced with smartphones, where it took much longer for consumers to become comfortable shopping from their smartphone devices.
  • People use tablets and smartphones differently – and at different times. For example, smartphone usage peaks during the day whereas tablets are used more in the evening.

That tablets are making big gains on laptop computers is no surprise at all, considering their lighter weight, nearly effortless portability, brighter screens, and the ease of using them in environments not conducive to a keyboard-and-mouse (like in bed).

But of the trends noted above, I think the most intriguing one pertains to tablet computer usage versus smartphones – specifically, how tablets are becoming an alternative to smartphones rather than an adjunct.

Indeed, it seems as if some people aren’t making the transition from feature phones to smartphones that everyone expected; they’re opting for tablets instead. We may see the adoption rates for smartphonesbegin to flatten out as a result.

Indeed, Adobe Systems reported in May 2012 that tablet traffic is growing at a rate ten times faster than smartphone traffic.

But if you really think about it, maybe these latest developments aren’t so surprising: Many folks have long complained about the “miniaturization” of display screens that are a necessary evil of mobile phones. Now that the tablet has come along, there’s finally an effective solution to that dilemma – and the market has responded accordingly, blowing away even the most optimistic sales forecasts for tablets.

Goodbye Hotmail … Hello Outlook

Hotmail becomes OutlookMicrosoft has finally bitten the bullet and acknowledged the catch-up ball it needs to play in the e-mail space.

Last week, Microsoft announced that it’s unveiling a completely revamped version of its Hotmail free online e-mail service.

Dubbed “Outlook” in a bid to transfer some of the goodwill from Microsoft’s popular Office email application to the free e-mail space, the successor product to Hotmail incorporates functionalities designed to make it more directly competitive with Google Gmail, which has been growing by leaps and bounds in recent times.

You may not realize it from the persistent dearth of industry press coverage about Hotmail, but it’s actually held the rank of the world’s largest online mail service, owning more than a third of the world market share (~325 million users), according to June 2012 reporting from cyber-statistics firm comScore.

But Microsoft’s margin over rivals has shrunk considerably, with Gmail hard on its tail at ~31% market share of users and Yahoo holding a similar percentage (~32%).

It may be surprising to learn that in the ever-changing digital space … but prior to this revamp Microsoft hadn’t updated any of the features or functionality of Hotmail in nearly a decade.

“A lot has changed in the last eight years, and we think it’s time for a fresh look at e-mail,” Chris Jones, a Microsoft exec, stated in a blog post that has to be the understatement of the decade.

Here’s some of what’s in store for users when they switch from Hotmail to Outlook:

  • A clean, uncluttered look – just like Gmail.
  • Tasteful, unobtrusive advertisements appearing in the right column of the screen – just like Gmail.
  • Users can link up with all major social media accounts to view the latest updates from their contacts and friends – just like Gmail.

Is this beginning to sound a bit repetitive?

But there is one feature that may give Outlook a bit of a leg up on its free online competitors: The service will automatically detect mass messages like sales notices, daily deals, newsletters and social updates and place them in separate folders. Users can customize this functionality to sort incoming e-mail any way they wish.

I haven’t used Hotmail in the past … although I might be tempted to consider Outlook now that these newest innovations have been added.

But the long-term success of Outlook – and any free e-mail platform – is going to be how effectively they can connect various online assets together to provide “one-stop convenience” for users.

One thing’s certain: There’s no way Microsoft can let another eight years go by before making more enhancements to its free e-mail service offering, considering the always-aggressive posture of Google and its Olympian competitive spirit.