In digital retail, there’s Amazon and then there’s … everyone else.

When it comes to online retailing in the United States, Amazon’s been cleaning up for years. And now we have new data from comScore that reveals that Amazon is as dominant online today as it’s ever been.

This chart illustrates it well:

dms
* MediaMetrix Multi-Platform, US, December 2017. Source: comScore 2018 State of the U.S. Online Retail Economy.

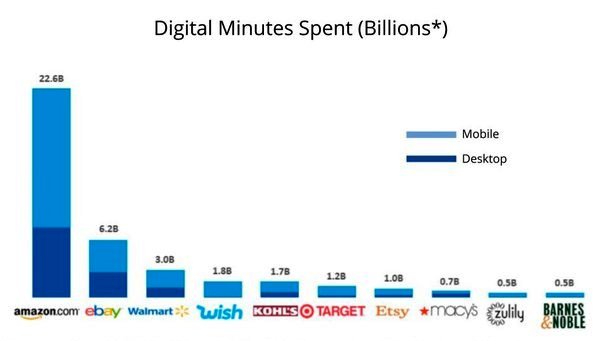
The chart shows that when comparing actual time spent by Americans at each of the Top 10 online retailers, Amazon attracts more viewing time than the other nine entities combined.

Even when considering only mobile minutes, where so much of the growth is happening for digital retailers, Amazon’s mobile viewing time exceeds the combined total digital traffic across eBay, Walmart, Wish, Kohl’s and Etsy.

Pertaining to the mobile sphere, there is an interesting twist that comScore has found in consumer behavior. It turns out, there’s a considerable disparity between the amount of time spent with mobile compared to its share of dollars spent – to the tune of a 40% gap:

srts
MediaMetrix Multi-Platform and ecommerce / mCommerce Measurement, Q4 2017. Source: comScore 2018 State of the U.S. Online Retail Economy.

In essence, the data show that whereas mobile represents nearly two-thirds of the time spent with online retail, it accounts for only one-fourth of the dollars spent on goods and services.

But this difference is easy to explain:  As the largest player in the field, Amazon fulfills a role similar to what Expedia or Trivago do in the travel industry.

Amazon gives consumers a way to scan the marketplace not only for product details but also for prevailing prices, giving them a sense of the expected price ranges for products or services — even if they ultimately choose to purchase elsewhere.

Holiday shopping behaviors: Black Friday is losing some of its luster.

It’s the beginning of October – which means that the holiday shopping season will soon be upon us.

… If it isn’t already, based on the holiday displays we’re already seeing cropping up at some major retail chain stores.

Of course, U.S. retailing firms have been gearing up for the season for months now, in terms of building merchandise inventories and so forth. But what sort of consumer shopping dynamics will they be facing this year?

According to new research published by Euclid, Inc. in its 2017 Evolution of Retail report which covers holiday physical and digital retail trends, Cyber Monday has now overtaken all of the other holiday-season shopping days in terms of consumer excitement.

That finding is based on a survey of ~1,500 U.S. consumers age 18 and older. While majorities of respondents report that they are excited about each of the three biggest revenue days of the holidays, for the first time ever Cyber Monday heads the list in terms of consumer interest and excitement:

  • Cyber Monday: ~72% of consumers report being excited about this shopping day
  • Black Friday: ~62%
  • Day after Christmas: ~55%

Clearly, online shopping continues to build momentum year over year. But the Euclid research also reveals that physical stores continue to have a major role in the “buying journey.”  Even among consumers in the 18-34 age group, three out of four respondents report that they visit physical stores on a regular basis to see products “in the flesh” – even if they purchase them online later.

Not surprisingly, “price” remain the biggest driver in consumer shopping behaviors during the holiday season, but convenience is another factor as well. It isn’t simply a store’s location that matters, but also how quickly shoppers can get in and out of the store that affects their views of “convenience.”

Interestingly, when comparing just in-store shopping plans, more respondents in the Euclid survey expect to be shopping on the day after Christmas (63%) than on Black Friday (60%) this year.

Perhaps the decisions by some big retailers to curtail store hours on that traditional first day of the holiday shopping season are being driven by more than simply altruism …

The complete Euclid report for 2017 can be downloaded here.

The “Skinny” on 2010 Holiday Spending

Consumer Holiday Spending
Holiday spending on the rise? Yes, but ...
The “early returns” from this year’s Black Friday retail sales are quite encouraging. Online retail sales are experiencing an even bigger bump in activity. The question is, do these positive early results foreshadow a strong holiday season overall?

Each year, Gallup attempts to answer that question in advance by conducting a poll every November in which it asks U.S. consumers for a prediction of the total amount of money they plan to spend on holiday gifts. This year’s poll findings were published this past week.

And the results? The good news from the consumer economy’s standpoint is that the average personal spending expectation has risen to $714 for 2010, which is ~12% higher than last year’s $638.

The not-so-good news is that we’re still in the doldrums when measured against most of the previous decade. In fact, only in the years of 2009, 2008 and 2002 has expected personal spending been lower than it is this year.

If we take an average of the ten years covering 2000-2009, the expected personal spending found by Gallup’s survey is $747, which means that 2010’s dollar amount doesn’t even come up to the average of the past decade.

Here’s another interesting finding from the survey: Evidently, the increase in expected holiday spending compared to last year is being driven by only a small percentage of consumers. Half of the Gallup respondents reported they would be spending “about the same” this year, whereas one third reported they would actually be spending less.

The remainder – fewer than 15% — reported they would be spending more.

And all of that activity on the Internet? We can be sure a goodly amount of it is driven by the desire to find the very best price available. And to prove that out, the latest online holiday shopping report survey from rich media firm Unicast finds that more than half of consumers are using the Web to research and compare deals between online stores and retail outlets.

The bottom line on all this: It’s a mixed picture with a slight lean on the scale in favor of optimism. Which is a darn sight more positive than what we saw in 2008 and 2009.

Happy Chris-kwanz-ukah, everyone.