America’s shopping malls struggle to avoid becoming dinosaurs.

dm

America’s department store chains – and anchor stores at countless shopping malls across the country – are reporting another rounds of disappointing sales and profit figures following the 2016 holiday season.

It underscores what we’ve been seeing all over the country – dead or dying malls.

In fact, retail industry analyst Jan Rogers Kniffen predicts that about one-third of malls in the United States will shut their doors in the coming years.

That’s about 400 of the ~1,100 enclosed malls.

Equally startling, of the ~700 that remain, all but around 250 are expected to continue to struggle.

The problem is multi-faceted. At an estimated 48 sq. ft. of retail space for every man, woman and child in America, that’s a footprint that gotten too big.

“On an apples-to-apples basis, we have twice as much per-capita retail space than any other place in the world,” Kniffen says, adding that the United States is “the most over-stored” country anywhere.

The oversupply of retail space is challenged by changing customer tastes, too. Online shopping is a huge problem for malls, as is the rising popularity of off-price stores in lieu of the department stores like Macy’s and Penneys that have served as important anchors for mall properties all over the country.

Now we hear reports that Macy’s is planning to close numerous store locations during 2017, joining Sears and Penneys which have been doing the same thing over the past several years.

How will malls survive in the future? Recently, the McKinsey & Co. consulting firm issued a report that highlighted five ways malls can remain relevant to consumers today and in the future:

Mall of America (Bloomington, MN): Expansion Rendering

Entertainment – Even in the age of “interactive everything,” consumers – particularly younger ones – continue to seek out gathering places and “experiences.”  It’s one reason why some shopping malls have had to deal with large numbers of young people flooding their spaces – not always with pleasant results.  Malls seeking out tenants that provide entertainment hubs — such as theme parks and gaming parlors, edutainment, and even virtual-reality content and immersive experiences — will be able to draw customers from a wider geographic area who crave social interaction.

Food and drink – “Food is the new fashion,” some people like to say.  Successful malls are getting in on that action, incorporating popular dining options along with unique ones as a way of becoming destination locations.

Retail – Still a core aspect of malls, but with new twists, such as creating retail centers that are also learning zones that bring together consumers, retailers and entertainment.  McKinsey uses the example of a sporting goods store that also includes a fitness studio, or offline showrooms for online retail players.  More reconfigurable spaces that can be used for pop-up stores, special product launches and seasonal offerings are also options with potential.

Transportation – Getting to and from mall properties with ease is growing in importance, and where some creative thinking might go a way towards making some malls more attractive than others.

Technology – The more that malls can create a “seamless chain” between online and on-site shopping, the better their chances are for staying relevant in the new retail environment.  McKinsey posits a number of initiatives, such as creating “virtu-real” formats that provide consumers with a more interactive retail experience through the use of touchscreen navigation portals, virtual fitting rooms, allowing smartphones for e-checkouts, and click-and-collect services to help blend the offline and online shopping experience.

In sum, for shopping malls it means fundamentally rethinking their role — and then adapting their strengths to those of the virtual/interactive world.

If we check back in another five years or so, we should have a pretty good idea which tactics have been successful – and which mall properties, too.

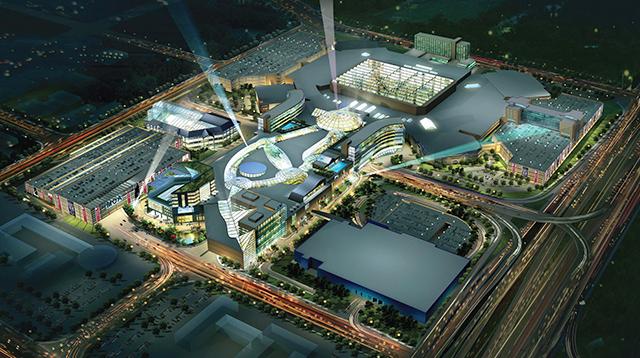
Hopefully, the shopping mall closest to your home won’t look like the one at the top of this article.

Will consumer spending bring holiday cheer to businesses in 2016?

hdsThe holiday season isn’t yet upon us, and already there are a plethora of prognostications being made as to how holiday sales will stack up compared to prior years.

These predictions come courtesy of numerous forecasters including the National Retail Foundation, Deloitte, Kantar Media, eMarketer, the International Council of Shopping Centers, Market Track and others.

So what’s in store? On balance, forecasters predict that holiday sales in the United States will post an increase of approximately 3.5%.  That’s higher than the 10-year rolling average of 2.5% but down a tick from last year’s 3.7% increase.

Still, at more than $655 billion in total sales, holiday spending continues to be the biggest single driver of the U.S. consumer market.

Hardly surprising, e-commerce sales are expected to continue their double-digit growth over last year’s holiday season, with various predictions ranging from 14% to 17% growth in this sector. Not only are consumers attracted by the convenience of online shopping, many of them believe they can find products at the cheapest price via online sources rather than taking a trip to the shopping mall.

Another factor that drives at least some people to shop on their online devices is their aversion to the crush of holiday shopping at the stores. A McKinsey study has found that nearly one-third of U.S. consumers basically hate Black Friday (the day after Thanksgiving), and make it a point to stay as far away from it as possible.

But there’s one drawback for businesses about online holiday shopper dynamics, however:  Those consumers tend to be less brand loyal than is typical. RJ Metrics calculates that the typical e-commerce business acquires nearly 25% of its new customers during just the months of November and December.  Tempering that healthy statistic is the lifetime value of those consumers, which RJ Metric has determined is about 13% lower than the lifetime value of customers acquired at other times of the year.

You might be wondering what amount of money the typical U.S. consumer will spend on his or her holiday shopping this year. Wait for it:  The 2015 per capita amount is expected to be $935.

That figure may seem quite rich … but it’s actually a little bit lower than 2015’s average spend-per-person, which at $953 happens to have been the all-time high ever recorded.

Does the new $935 forecast signify a reversal of a trend … or is it just a pause in an otherwise ever-increasing amount of money that consumers are willing to plunk down as part of their celebration of the holiday season?

Check back in about a year and we should have an answer.

What’s driving innovation in consumer packaged goods these days?

Consumer packaged goodsWith the steady rise in the number (and variety) of consumer packaged goods offerings, one might wonder if the factors that drive CPG innovation are the same today as they’ve been in the past.

There’s no dearth of research to help give us clues to the answer.  In the first half of this year alone, major CPG research results have been published by the likes of Accenture, Deloitte, Forrester, IRI and Kantar – and that just covers the first half of the alphabet!

The broad takeaway from these reports is that there are six major trends driving innovation in the industry.  Three of them are just as important as they’ve ever been, and three additional ones are becoming more significant as time goes on.

The three “classic” trends that drive CPG innovation as much as ever are convenience, value, and specialization.

They’re fundamental, they’re significant, and they haven’t lost their importance based on what’s happening in the larger marketplace or the economy:

Convenience is a major driver because consumers are always looking to get what they need faster and with less effort than before.  If a product saves time and delivers multi-benefit solutions, consumers will respond.

Value is always perennially important.  When the perceived value of a product goes down because of price pressures or a lack of differentiating benefits, brand loyalty is adversely affected.

Specialization – Product formulation and packaging can affect the way consumers feel about products.  The more that can be provided in the way of a “just-for-me” solution as opposed to “one-size-fits all,” the better.

If they concentrate on these three trends, most CPG brands do pretty well.  But there are three additional trends that appear to be gaining momentum.  Add them to the repertoire, and an additional competitive edge can be established:

Portability – As consumers’ lives have become more mobile than ever, a premium is placed on brand that can deliver on-the-go offerings.

Environmental Impact – It’s been a long time coming, but this trend finally appears to be reaching some semblance of critical mass. More consumers are considering environmental factors — not just as attributes for products that are “nice to possess,” but actually necessary for making a responsible choice. It’s more than the product itself; it’s also sourcing, manufacturing, distribution and disposal.

Health Impact – The days of CPG products being big on convenience but bad on health are numbered. Thanks to better education and more out-of-pocket medical-related cost responsibilities, health awareness among consumers has never been higher. It may not be translating yet into improved health metrics like lower obesity rates, but there’s pretty clear evidence that more people understand health risks and are taking more responsibility for their own personal health and that of their family members.  Products that can credibly claim to “healthy” benefits stand to gain in the competitive landscape.

Do you feel that there are other trends besides these six that that are influencing the development of consumer packaged goods today?  Perhaps ones associated with cultural diversity … or something else?  If so, please share your thoughts with other readers here.

Americans and the economy as 2015 begins: Caution continues.

As we’ve closed out the year 2014, more than a few people – from politicians to business leaders and business journalists – have sought to reassure us that the American economy is not only on the right track, it’s back in a big way.

Bronx CheerBut evidently, word hasn’t trickled down to “John Q. Public.”  Or if it has, it’s been greeted by a gigantic Bronx Cheer.

We have the latest evidence of this in management consulting firm McKinsey & Company’s most recent annual Consumer Sentiment Survey, which was conducted in September 2014 with results released last month.

The bottom-line on consumer sentiment is that despite the recent spate of decent economic news and higher employment figures, people are still reluctant to increase spending, and thriftiness remains the order of the day.

While people don’t think things are deteriorating … they don’t think they’re becoming much better, either.

So … treading water is about all.

It’s not too difficult to figure out why sentiment continues to be so skittish.  After all, median household income for Americans, adjusted for inflation, actually declined in recent years and hasn’t rebounded.

With people still feeling the earnings squeeze, it’s only natural that McKinsey’s findings show consumer sentiment still in the doldrums, with only ~23% feeling optimistic about America’s economy.

Consider these further findings from the research:

  • About 40% of respondents report that they are living “paycheck to paycheck”
  • Around 39% are at least somewhat worried about losing their job
  • Approximately 34% feel they have decreased ability to make ends meet financially

Not surprisingly, respondents with lower family incomes (under $75,000 per year) have higher concerns, and roughly 40% of those households report cutting back or delaying purchases as a result.

[Even among people living in households earning $150,000+ per year, one in five say that they’ve cut back or delayed purchases because of financial uncertainty.]

Activities we commonly associate with recessionary eras continue to be practiced by consumers.  According to McKinsey’s research, those practices include:

  • Looking for ways to save money (comparison shopping, coupon use, etc.): ~55 of respondents report doing so
  • Purchasing more products online to save money: ~48%
  • Cutting spending over the past year: ~40%
  • Doing more shopping at “dollar stores”: ~34%
  • No longer preferring/buying more expensive product brands over private-label substitutes: ~33%

Where things really look different “on the ground” than in the economists’ forecasts is what the public is saying about their future behaviors:  McKinsey logoMcKinsey believes that consumers and their attitudes have been permanently changed by the years of austerity.

The strongest indication of this?  Nearly 40% of the survey respondents say that they’ll likely never go back to their pre-recession approaches to buying and spending.

As McKinsey concludes in its report:  Cautious is the new normal … and it’s unlikely to change anytime soon.

More details on McKinsey’s survey findings can be viewed here.

What Will Retail Look Like in Five Years?

retailIt’s a question many people are asking:  To what extent is the digital revolution fundamentally changing shopping habits? 

A new report from Forrester Research titled “U.S. Cross-Channel Retail Forecast, 2012 to 2017” attempts to answer this question.

Its prediction:  just over 10% of total U.S. retail sales will be online purchase in five years’ time.

By comparison, in 2012, e-commerce accounted for about 5% of total U.S. retail spending, so Forrester is projecting a doubling of e-commerce volume.

Forrester also projects that by 2017, ~60% of retail sales in the United States will involve the Internet – either as a direct commercial transaction or as part of buyers’ pre-purchase research on laptops, tablets or smartphones.

The sectors most likely to be influenced by online research are grocery, apparel, home improvement and consumer electronics – no doubt abetted by the ability to access customer reviews and comparison prices during shopping excursions, Forrester reports.

These findings and more are included in Forrester’s report which can be found here (it’s a for-purchase study).

Is AdTrap the answer to our prayers when it comes to blocking online advertising?

ad blocking deviceYou may have heard of AdTrap … or maybe you haven’t.

AdTrap is a newly developed device that intercepts online ads before they reach any devices that access a person’s Internet connection.

That basic action means that people are able to surf the web – including viewing videos – without the onslaught of online advertisements that seem to become more and more pervasive with every passing month.

The fundamental promise that the developers of AdTrap are making is a return to the “good ol’ days” of web surfing.

You know, back when most web pages you downloaded contained text and pictures – and virtually no advertising.

AdTrap’s motto is a simple and powerful one:  The Internet is yours again.”

Not surprisingly, there’s a good deal of excitement surrounding this new product.  In fact, interest has been so great that the invention attracted more than $200,000 in funding — raised in a 30-day Kickstarter campaign in early 2013.

Those funds are now being used to manufacture the first AdTrap units for shipment to “early adopter” consumers across the country.

How New an Idea Is This?

advertisingIn actuality, there have been a plethora of (often-free) software and browser plug-ins offered to consumers that can block online advertisements. 

But most of them have significant limitations because they’ve been designed to work only with specific browsers or on specific devices.

Free is good, of course.  But the developers of AdTrap are banking on the willingness of consumers to shell out $139 for their product – a rectangular box that looks a lot like a wireless router and that intercepts advertisements before they reach a laptop, tablet or mobile device.

The beauty of AdTrap is that it will work on every device connected to a person’s network.  Situated between the modem and router, it takes just a few minutes to set up.  

CNN technology correspondent Dan Simon reports that AdTrap does an effective job blocking advertising content.  But not perfectly; ads still appear on Hulu content, for example. 

But the developers of AdTrap report that they’re working on ways to block even more content going forward, including ads on Hulu.

Is this Bigger than Merely Blocking Ads?

Beyond the collective sigh of relief you’re likely hearing from those reading this blog post … what are the larger implications if AdTrap and similar devices are adopted by consumers on a large scale?

One not-so-positive implication may be that websites will no longer offer be able to offer content without charge, since so many publishers’ business models rely on advertising content to help pay most of the bills.

If advertising isn’t appearing thanks to AdTrap, people aren’t getting paid.

So let’s think about this for a minute:  It’s true that the Internet was blissfully free of wall-to-wall advertising 15 years ago compared to today. 

But cyberspace was also far less robust in terms of the quantity and quality of the informational and entertainment content available to us.

So yes … having a device to block 80% or more of the ads served to us is a very attractive proposition.  But if it means that some of our favorite sites move to pay-walls as a result, it might be that making a $139 investment in an AdTrap device isn’t such a “no-brainer” choice in the final analysis.

What do you think of this development — pro or con?  Please share your thoughts with other readers here.

America’s “Summer of Funk”

Consumers are in a funk in the Summer of 2012.

How much do American consumers spend in an average day? According to a July 2012 Gallup Poll, they spend about $70 per day in stores, gas stations, restaurants and online. (Housing, utility costs and vehicle purchases are extra.)

It turns out that this figure is a pretty big drop from the average daily spend of $104 Gallup found in 2008.

That meme we’re hearing on the campaign trail about people’s livelihoods having shrunk over the past three or four years? Evidently, it’s a fact.

And Gallup is also finding that upper-income Americans have undergone the same degree of spending reduction as everyone else. Their spending is now down to about $116 per day.

Evidently, confidence in the U.S. economy and the stock market’s uneven performance have taken their toll on the psyche of even the affluent classes in America. And Gallup isn’t the only organization charting this. Ipsos MediaCT is finding a similar story in its surveys.

Last week, Stephen Kraus, an Ipsos senior vice president and author of several books on the upper-income sector of society, wrote: “Widespread uncertainty plays a role in a fundamental fact of today’s “affluent” marketplace. For the most part, affluents today simply don’t feel affluent.”

Krauss continues, “This feeling isn’t new; for most, it is part of the lingering hangover of The Great Recession. But it is particularly pronounced in the summer of uncertainty.

Krauss concludes his remarks with this rather gloomy observation: “It’s a summer of uncertainty indeed – about the economy, about the future, and even about one’s own standing in today’s financial hierarchy.”

Reading these very latest reports on the level of uncertainty – even resignation – that people have about the economy, it underscores the collective funk the American people seem to be in as the 2012 presidential campaign grinds on inexorably to its conclusion.

Perhaps once Election Day has come and gone, Americans will “snap out of it” and begin to feel brighter about the future.

Perhaps. But don’t hold your breath. 

(Still) Seeking the Sweet Spot with QR Codes

QR codesI’ve blogged before about how QR codes – those splotchy icons at which someone can point their mobile device and be taken to a website for product information, a coupon or some other type of content – seem to be having difficulty becoming accepted by the mainstream of U.S. consumers.

And now we have yet more evidence to suggest that QR codes may never achieve the level of potential that marketers have hoped for them.

Youth marketing and esearch firm Archrival give us the latest clues as to the lack of adoption we’re seeing when it comes to QR codes. Here are two key findings from a survey it conducted among 500+ students at 24 American college campuses in late 2011:

 Although ~80% of respondents owned a smartphone and claimed to have come in contact with QR codes, only ~21% were actually able to successfully scan the QR code example that was presented in the Archrival’s survey.

 Three out of four respondents reported that they’d be “unlikely” to scan even one QR code in the future.

What’s the problem? Archrival uncovered a number of hurdles when it comes to QR codes. Several of them could be classified as “deal breakers” in the overall scope of things:

 Many survey respondents did not realize that a third-party app needs to be activated in order to scan a QR code. They mistakenly assume that it can be activated with their camera.

 Other respondents believe that the QR code-reading process is too lengthy and cumbersome.

And on a more fundamental level, doubts are being expressed about the value or usefulness of the web landing pages that are promoted via the QR codes.

What we may be witnessing is a dynamic that’s similar in some respects to what happened with CD-ROMs about a decade ago. There was once a boomlet of CD-ROMs being sent via mail to consumer and B-to-B customers. CDs were viewed as a great way to provide extensive rich content that was difficult to download and expensive to print traditionally.

But because the tool was “one step removed” (it needed to be loaded into a desktop computer in order to be viewed), the rate of interaction with these CDs turned out to be abysmal.

Similarly with QR codes, first there’s the need to possess a smartphone with a barcode scanning app installed. Once properly equipped, people then need to take the time to find and launch the app on their mobile device before pointing the camera at the QR code.

For many in today’s “instant gratification” world, taking those extra steps, however simple, may be a bridge too far.

Gallup Sees Deterioration in Americans’ Perceptions of Major Industry Sectors

Decline in perceptions of U.S. industriesThe past decade hasn’t been kind to the image of most industries in the United States. And given the economic and sociopolitical upheavals experienced by nearly every strata of society, it’s not hard to understand why.

This isn’t just conjecture, either. For years, the Gallup polling organization has surveyed Americans’ opinions of 25 major industry sectors every August to determine if their overall opinion of each of them is positive, neutral or negative.

The results of the 2011 survey of 1,008 respondents (age 18 and over) have now been released, and they show that a majority of Americans view just five of the 25 industries in a positive light:

 Computer industry: ~72% rate positive
 Restaurant industry: ~61%
 Farming and agriculture: ~57%
 The Internet: ~56%
 Grocery industry: ~52%

Interestingly, when comparing these results to ten years ago (August 2001), just two of these five sectors have improved their positive ratings: the Internet and the computer industry.

At the other end of the scale, seven of the 25 industry sectors scored 30% or lower in positive ratings:

 Banking industry: ~30% rate positive
 Airline industry: ~29%
 Legal field: ~29%
 Healthcare industry: ~27%
 Real estate industry: ~23%
 Oil and gas industry: ~20%
 Federal government: ~17%

The remaining 13 industries in Gallup’s survey came in between 30% and 50% on the scale – hardly stellar ratings, but not in the basement like the hapless sectors listed above.

Over the past decade, Gallup has observed that a clear majority of the industries – 19 of the 25 – have seen declines in their positive scores.

The most precipitous ones include the usual suspects, led by – you guessed it – the federal government:

 Federal government: Down 24 percentage points since 2001
 Real estate industry: Down 23 points
 Banking: Down 17 points
 Educational field: Down 15 points
 Accounting industry: Down 11 points
 Healthcare industry: Down 10 points

It’s little wonder why we’re seeing these six industries striking out so badly with the American public; they’re precisely the ones associated most with various political or economic problems.

By contrast, the positive views about the computer industry and the Internet reflect the continuing innovation and financial success of many businesses in this sector.

This can’t be lost on consumers – many of whom have directly benefited through the steady stream of new products and services introduced by companies in these sectors over the past decade.

And as for agriculture, groceries and restaurants … well, we all have to eat, no matter what the economic situation! Besides, there’s been little controversy seen in these categories, and they’re mature sectors have been smooth-running in this country for years.

One hopes the next decade will witness a reversal in the downward trajectory of the public’s perceptions of American industries. In at least a few of the cases, it’s hard to imagine how they could sink any lower!

Challenging Popular Myths about Who Controls Household Spending

Who controls more consumer household spending ... women or men?
Who controls consumer household spending? Women ... men ... or both?
Among the “everyone knows” factoids in marketing, it’s accepted pretty much without question that women are the purchasing decision-makers in households far more than men. Whether it’s decisions on consumer spending or healthcare services … women are much more likely to be making those decisions compared to men.

And the figure commonly cited? Women are responsible for ~80% of the decisions. But how accurate is this … or is it time to reconsider this notion?

A survey conducted last year of ~4,000 Americans age 16 and older by The Futures Company, a London-based marketing consulting firm, found that ~37% of women claimed they have primary responsibility for shopping decisions in their household, while ~85% claimed they have primary or shared responsibility.

And the figures for the male respondents in this survey? Substantially the same, it turns out: 31% claimed they have primary shopping responsibility and 84% claimed that the responsibility is shared.

Emily Parenti, marketing director at Futures, concluded that the survey results “tell a different story” than the common perception of how much women control the purse-strings in households.

Indeed, the Futures survey is one of the first ones that actually goes so far as to quantify the issue. Ira Mayer, president of EPM Communications which publishes the newsletter Marketing to Women, has attempted to find the origin of the accepted 80% figure – but has come up empty.

“There is never any sourcing of the number,” Mayer says. And yet, “it’s become accepted folklore.”

When challenged to cite corroboration, students of marketing point to the book Marketing to Women, published in 2002 by Marti Barletta, wherein the claim is made that women “handle 80% to 90% of spending and purchasing for the household.”

And yet … Barletta has never been able to cite the source for this claim, either. Instead, she considers it “one of those rules-of-thumb numbers that everyone in the industry uses.”

Perhaps marketers need to take a look at this rule-of-thumb again. Because in addition to the Futures survey, a 2008 online research survey conducted by Boston Consulting Group asked women and men to estimate what percentage of household spending they influence or control.

True to form, the average answer given by women in the BCG survey was 73%. But the average answer given by men was 61%.

So in essence, both genders are claiming responsibility for a controlling or influence more than 50% of the spending in their household.

This points to a difference in perspective that likely won’t be going away anytime soon. Indeed, Marti Barletta still claims to be “pretty comfortable” with the 80% figure for female control over household spending. “Even being conservative, I wouldn’t go below 75%,” she asserts.

Whatever the correct figure actually is, one thing we can be certain of is that the notion of women having overwhelming control of household spending is off-base. And so, consumer product manufacturers would be wise to recalibrate their thinking as they engage in their product development and marketing activities and programs.