Can the World Economic Forum be any less useful or relevant?
Most people in business and politics have heard of the World Economic Forum (WEF), best known for holding its annual meeting for the world’s glitterati every January in Davos, Switzerland.
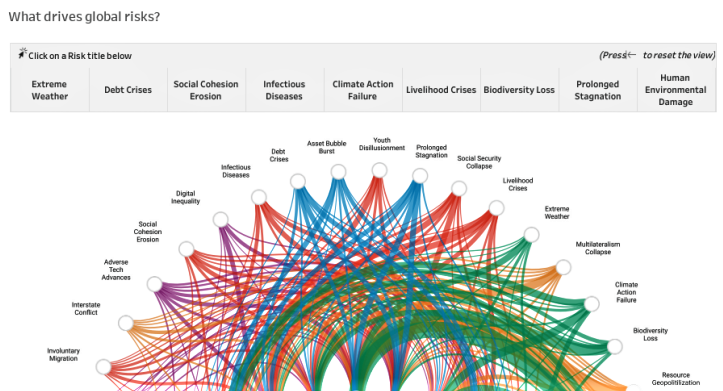
Beyond that international confab, WEF provides a set of “Transformation Maps” on its website which are described as “a constantly refreshed repository of knowledge about global issues, from climate change to the future of work.”
“Transformation Maps are the World Economic Forum’s dynamic knowledge tool,” the website declares. “They help users to explore and make sense of the complex and interlinked forces that are transforming economies, industries and global issues.”
The maps present insights written by so-called experts along with machine-curated content. Together, “the information allows users to visualise and understand more than 250 topics and the connections and inter-dependencies between them, helping in turn to support more informed decision-making by leaders.”
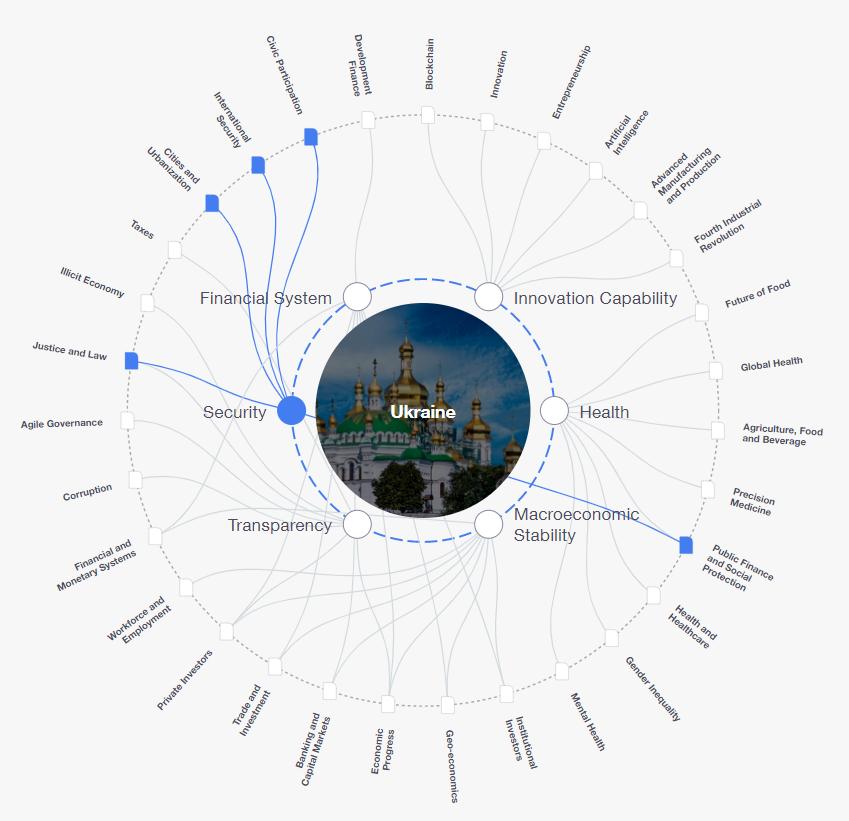
That page displays 293 different topics. Scrolling down a good ways finally brings up “Ukraine” … and here’s what is displayed after clicking on the “Security” issue:
Explaining how the chart was developed, the website reports:
“This Transformation Map explores key issues for Ukraine based on its rankings in the most recent edition of the World Economic forum’s Global Competitiveness Index.”
For the record, those six “key issues” are Financial System, Innovation Capability, Health, Macroeconomic Stability, Transparency and Security.
The Security issue then links to five other topics (Public Finance and Social Protection, Justice and Law, Cities and Urbanization, International Security and Civic Participation).
Curious to see what content would be displayed, I clicked the International Security topic, which causes the International Security Transformation Map to appear. Only then did I finally learn that:
“The return of great power competition has been accompanied by the outbreak in Ukraine of Europe’s largest ground war since World War II.”
I must admit that I am quite impressed with how these Transformation Maps have helped me to visualize and understand the connections and inter-dependencies between Ukraine and International Security … and it is now completely clear to me how these tools support more informed decision-making by leaders. [Feel free to insert snark emoji here.]
Now that we’re down the road a good ways with the COVID-19 pandemic, it’s interesting and perhaps instructive to make a comparison between the current pandemic, and the 1918 H1N1 (influenza) pandemic, colloquially known as the “Spanish Flu,” that happened a little over a century ago.
There is no firm consensus on when the 1918 H1N1 pandemic actually began, but according to the U.S. Center for Disease Control and Prevention, it was first identified in U.S. military personnel in the spring of 1918 and ran its course for at least 44 weeks until May 1919, killing approximately 675,000 people in the United States.
In as much as the U.S. population was about 100 million at that time, the 1918 H1N1 pandemic’s death rate was about 6.4 per thousand people (0.6% of the population).
By contrast, the COVID-19 pandemic has been underway for 89 weeks (and counting) in the U.S., killing about 783,000 people here so far. The U.S. population had grown to about 330 million by 2020, so the COVID-19 death rate thus far is about 2.4 per thousand people (0.2% of the population).
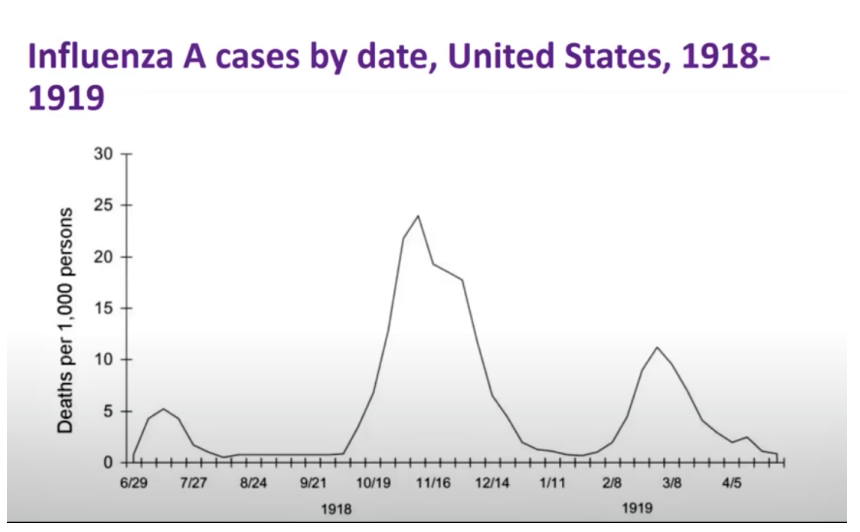
University of California – San Francisco epidemiologist George Rutherford has compiled a summary chart for the 1918 H1N1 pandemic in the U.S. According to the data, Spanish Flu’s first wave occurred in July 1918, followed by a second and far deadlier wave between October and December 1918 – and then a third less-deadly wave in February and March 1919, as depicted in Dr. Rutherford’s chart. At the peak of the second wave in November 1918, the U.S. experienced 24 deaths per thousand population per week.
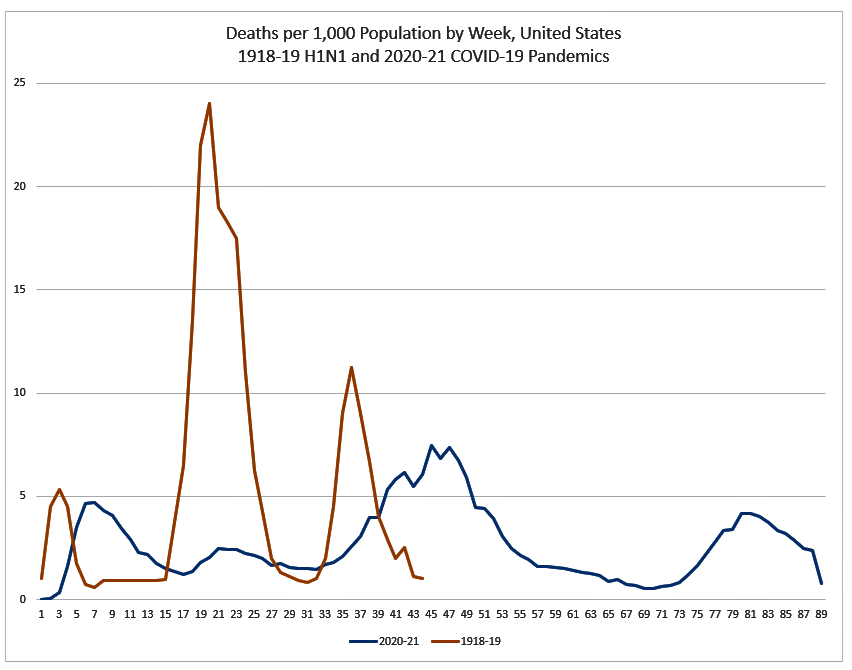
It’s interesting to see how this historical data compares to the COVID-19 pandemic, which began in the U.S. with a first wave between March and June 2020, followed by a smaller wave between July and September 2020. The largest and deadliest wave occurred between October 2020 and March 2021, when the weekly death rate peaked at 7 per thousand population. The fourth and most recent wave began in August 2021 until the present. You can view the weekly deaths per thousand population for both pandemics on this chart:
What’s clear is that, so far, the COVID-19 pandemic has lasted twice as long, while being one-third as deadly as the 1918 H1N1 pandemic.
This leads to an interesting insight. On the economic front, with comparatively little government regulation or monetary relief to citizens, the business cycle back in the early part of the 20th century tended to be shorter but much more volatile than it is today, exhibiting higher highs followed by lower lows.
Similarly, the degree of government regulation and involvement in matters of public health, including strong support for the rapid development of new vaccines, has been much greater during the COVID-19 pandemic than it ever was during the 1918 H1N1 pandemic.
It would seem that increased government involvement during economic and public health crises tends to moderate the ill effects — but at the cost of prolonging the misery.
The question is whether this connection is causation or coincidence. Please share your own thoughts in the comment section below.
(h/t Nelson Nones for researching and plotting the comparative stats.)
This past February I ordered an 18,000 BTU window air conditioning unit through the local GE dealer in the town where I live. It’s the largest such window unit you can buy, and there aren’t very many alternative options available from competitors.
Not surprisingly, the particular unit I ordered is manufactured in China (I am not aware of any similar models that are made in the United States). At the time I placed my order, I was informed that due to COVID-related disruptions of global deliveries, the earliest I could expect my unit to be received and installed was in April.
I wasn’t very surprised at this news, and figured that the delay would be perfectly fine for getting the AC unit installed and working in our home before the onset of the notoriously hot and humid summer months where we live here on Maryland’s Eastern Shore.
Since then, we’ve had several more pushbacks in the anticipated product delivery – first June … then August. And now the latest schedule I’m being told is for an October delivery – and even that date is “iffy.”
I think my situation isn’t unusual in these COVID-crazy times. Considering that the pandemic began towards the end of 2020, we are now 20 months later and the ripple effects are still being felt all throughout the global movement of products.
In fact, the recent coronavirus outbreaks that have occurred in Chinese port cities just this past month have caused even greater shipping delays than what had been encountered during 2020; they’re actually the worst shipping delays seen in 20 years. It means that the impacts will likely be felt all the way to the holiday shopping season at the end of this year — at a minimum.
Among the myriad of products and supplies that have been seriously affected are:
Appliances
Batteries
Food products
Furniture
Hospital, dental and surgical equipment/supplies
Measuring instruments
Plastic materials
Printed circuit boards
Semiconductor processing equipment
… and these are just some of the most notable examples.
With the Delta variant apparently causing a COVID-pandemic redux, it’s pretty impossible to gauge just how long it will take to work through the product shortages that have with us for so long already.
But what’s quite clear is that all of the initial estimates were woefully off the mark … so why would we expect anything different now?
What sort of product shortages have you experienced in the past few months, “thanks” to COVID – either in your business or at home? Please share your experiences (surprisingly good or unsurprisingly bad) with other readers here.
Remote work has turned each new hire into a national competition.
Historically, one of the challenges faced by smaller urban markets was their ability to hang on to talent. Younger workers often found it more financially lucrative following their education to relocate to major metropolitan areas in order to snag higher paying positions with the companies based there.
In time, however, the high cost of living in the large metro markets, coupled with the desire to ditch the unbearable congestion in those areas, led to the formation of new businesses outside the major tech centers that found it easier to compete with the major urban areas for talent.
Established companies found the same dynamics at work, too. The rise of markets like Charlotte, Salt Lake City, Pittsburgh and Boise underscored that the spread of the “new economy” had migrated to places beyond the traditional hubs of Boston, Washington, New York City, San Francisco/Silicon Valley, Los Angeles and others.
Then the COVID pandemic came along. Suddenly, it didn’t matter where employees lived as companies quickly figured out ways to have, in some cases, nearly their entire workforce working remotely.
It didn’t take long for employees in some of the market hardest-hit by COVID to flee to far-flung regions. New York City residents moved to the Hudson River Valley, South Florida and other locations. For California residents it was off to Nevada, Montana or Idaho. Boston-based workers decamped for Vermont or Maine.
It soon became apparent that for many tech jobs, the need to be clustered together in offices simply wasn’t that critical. And in an ironic twist, smaller-city startups and other firms are now starting to feel the effects of the establishment biggies poaching their own employees.
It’s particularly ironic; whereas before, companies that couldn’t compete with Silicon Valley heavyweights on salary could offer a whole lot of lifestyle to even the playing field. Now they’re finding that “work from anywhere” policies have nullified whatever advantages they had.
Those big-city salaries can be used to purchase a lot of house in whatever kind of environment desired — even if it’s a lakeside cabin in the middle of nowhere.
It also means that, all of a sudden, everyone’s competing with companies all over the country for talent — and hanging on to the existing talent is that much more difficult. When people are being offered 20% higher salary with no requirement to relocate, that’s a proposition many people are going to consider.
Another interesting consequence is that tech labor force is probably geographically more evenly distributed than it’s ever been — and the workers residing outside the traditional tech hubs are benefiting accordingly — At least in the short-term.
In the longer term, companies based in the smaller markets hope that they’ll have access to those same new tech migrants if work-from-home policies change yet again. But that’s a big “if” …
Millions of Americans age 20 to 24 fall into the NEET category: “Not in Employment, Education or Training.”
The COVID-19 pandemic has exposed some interesting fault-lines in the socio-economic fabric of the United States. One of these relates to young adults — those between the ages of 20 and 25. What we find paints a potentially disturbing picture of an economic and employment situation that may not be easily fixable.
A recently issued economic report published by the Center for Economic and Policy Research (CEPR) focuses on the so-called “NEET rate“– young Americans who are not employed, not in school, and not in training.
As of the First Quarter of 2021, the NEET category represented nearly 4 million Americans between the ages of 20 and 24. This eye-popping statistic goes well beyond the particular circumstances of the pandemic and may turn out to be an economically devastating trend with a myriad of adverse ripple effects related to it.
Look at any business newspaper or website these days and you’ll see reports regularly about worker shortages across many sectors — including unfilled jobs at the lower end of the pay scale which offer employment opportunities that fit well with the capabilities of lower skilled workers newly coming into the workplace.
At this moment, pretty much anyone who is willing to look around can easily find employment, schooling, or training of various kinds. But for millions of Americans in the 20-24 age cohort, the job opportunities appear to be falling on deaf ears. Bloomberg/Quint‘s reaction to the CEPT study certainly hits home:
“Inactive youth is a worrying sign for the future of the [U.S.] economy, as they don’t gain critical job skills to help realize their future earnings potential. Further, high NEET rates may foster environments that are fertile for social unrest.”
… Daily urban strife in Portland, Minneapolis and Seattle, anyone?
It doesn’t much help that younger Americans appear to be less enamored with the basic economic foundations of the country than are their older compatriots. A recent poll by Axios/Momentive has found that while nearly 60% of Americans hold positive views of capitalism, those sentiments are share by a only little more than 40% of those in the 18-24 age category.
Moreover, more than 50% of the younger group view socialism positively compared to only around 40% of all Americans that feel the same way.
The coronavirus pandemic may have laid bare these trends, but it would be foolish to think that the issues weren’t percolating well before the first U.S. businesses began to lock down in March 2020.
And more fundamentally, one could question just how much government can do to reverse the trend; perhaps the best thing to do is to stop “helping” so much … ?
More information about the CEPR report can be viewed here. What are your thoughts on this issue? Please share your views with other readers here.
Responses from two people in particular are worth highlighting for the “countervailing views” that they espouse. I think both have merit.
The first response came from my brother, Nelson Nones, who has lived and worked outside the United States for decades. His perspectives are interesting because, while fully understanding domestic events and policies, he also brings an international orientation to the discussion due to his own personal circumstances. Nelson is looking to history for his perspectives on the inflation issue, offering these comments:
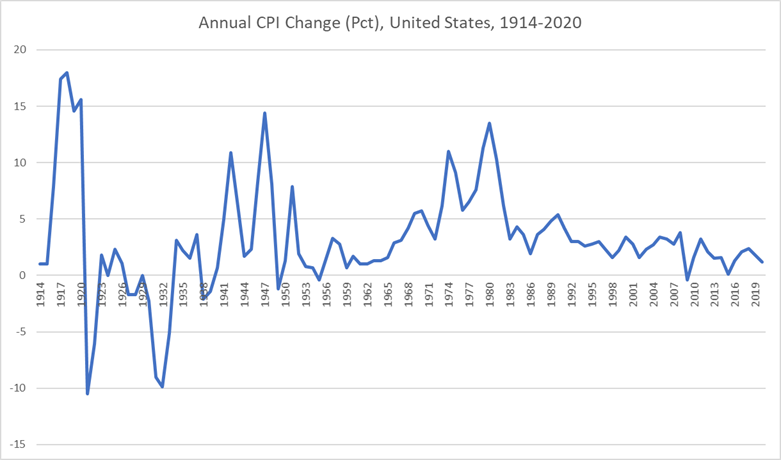
The chart below shows annual U.S. CPI percentage change for the past 106 years:
Projecting the latest (April 2021) Consumer Price Index forward to an entire year suggests that the U.S. will experience a 3.1% inflation rate in 2021. That would be higher than in any year since 2011, which was a bounce-back year following the Great Recession. Otherwise, the generic inflation trend has been consistently down since 1982 (nearly 40 years).
If the historical trends are any guide, and if we are indeed entering a persistent inflationary phase, it would take another decade before inflation growth approaches the levels seen during the 1970s.
But I think the likeliest scenario is experiencing a sharp uptick this year due to pent-up demand following the COVID-19 pandemic that will causie spot shortages, followed by resumption of a downward trend over the following ten years or so.
That’s similar to the pattern you can observe in the chart [above] during the years following the end of World War II, which had also created massive pent-up consumer demand.
Consider that the coronavirus pandemic hasn’t really altered the underlying economic fundamentals. The past 40 years has witnessed an explosion of manufacturing capacity in China and other developing countries, and that hasn’t gone away. Meanwhile, dependency on oil — a key driver of inflation in the 1970s — has shrunk due to improved energy efficiency and aggressive exploitation of renewable energy resources, which for all practical purposes are in infinite supply.
Another factor, which doesn’t get as much attention as it probably should, is declining birth rates and aging of the population on a global scale, leading to a slower rate of population growth in the future that may constrain demand for consumer products in comparison to the past century. Let’s face it — we old farts just don’t consume as much as growing families do!
So yes, we should keep an eye on inflation — but I don’t think we’re in for a repeat performance of the horrible 1970s.
Echoing Nelson’s thoughts are the perspectives of another business veteran — an editor and publisher who has been intimately involved in the commercial/B-to-B field for decades. Here is what he wrote to me:
I don’t want to get into a public debate with the inflationistas because I will never convince them that this is likely not a replay of the 1970s and early 80s inflationary period pre-[Paul] Volcker. (Speaking personally, I didn’t own a house until I was 42 for the very reasons you cited in your blog post, and I was just a lowly editor back then.)
What we’re seeing today is simply the price shock of suddenly soaring demand, aggravated in the case of some commodities such as steel by Trump-era tariffs.
All commodities are tied to the price of crude oil, the most volatile of all commodities, which is long-denominated in U.S. dollars. WTI crude pricing is now at around $63 per bbl. — about where it was in early 2020 before the pandemic hit. It went negative for a time during the worst period of the crash in worldwide demand that was brought about by the pandemic. Tanks couldn’t be found into which to put the excess crude coming out of the ground from U.S. fracking. Traders freaked out, as they sometimes do.
So naturally, the percentage changes today look jaw-dropping. I can go through all the other commodities mentioned in your post and provide simple explanations as to why each is currently on the rise. Logistical bottlenecks are a big problem with everything — but as with oil, most of the issue is the sudden surge in demand as the pandemic winds down even as production and logistics aren’t yet prepared to fulfill the need.
In other words, the situation has very little to do with government spending — especially since most of the infrastructure money isn’t even allocated, let alone spent. Also, the Biden administration has yet to raise a single tax. It can’t. Only the House Ways and Means Committee can initiate tax changes, and those must then go through the Senate to become law. Senate Minority Leader McConnell and his allies have made sure nothing has gotten through.
Of course, it never hurts to keep an eye on things — especially with structural inflation as you noted in your article. But it’s important to look also at other, broader data. The Producer Price Index in April did reflect the increase in commodities prices, but the Consumer Price Index, even though it had a month of robust increases, remains below 3% annualized. And the Personal Consumption Expenditure Price Index, which is what the Fed pays attention to the most, is still tracking under 2% on an annualized basis. (A little inflation can be a good thing, actually.)
On the income side, average wage rates aren’t rising; they’re more likely to be falling in the future as low-wage service workers, including those in foodservice, re-enter the market.
So in my view the things people see with inflation are most likely short-term issues. Let’s look at it again in six months to a year. I’d also suggest that people read economist Paul Krugman’s columns in the New York Times for a bit of perspective that’s counter to the views of the inflationistas, if only for balance. The monetarists have been wrong since Volcker squeezed out the inflationary spiral. It was painful, though — so we’ll want to keep an eye on things.
Considering the views put forward above, I think it’s fair to conclude that “the jury’s out” on whether we’re actually entering a prolonged inflationary period. If you have additional thoughts or perspectives to share on either side of the issue, I’m sure other readers would be interested to hear them. Feel free to leave a comment below.
The rise in lumber prices has received a certain degree of coverage in the news in recent weeks and months. For anyone who used the “pandemic period” to engage in home remodeling or renovation projects – perhaps moving away from “open concept everything” to reintroduce the designated spaces of yesteryear – the eye-popping price of lumber has come as something of a shock.
As for explaining the sharp increase, it’s logical to think that prices are directly correlated to the increased demand for the product. But this explanation is incomplete; the steep price rise in a wide range of commodities well beyond just lumber tells us that inflation isn’t relegated to just a few high-demand product categories. It’s the closest thing to “across the board” that we’ve seen in over 40 years — and the issue seemed to come out of nowhere.
Price inflation has been such a non-factor for so many decades, most consumers don’t even have personal memories of it. But those of us “of a certain age” remember well how difficult it was to navigate an “inflation-everywhere” environment where annual salary increases could never keep pace with rising prices.
It was difficult on people with fixed incomes, of course, but perhaps worse for young consumers who found that struggling to save for a down payment on a house purchase was a losing proposition as the gap widened rather than narrowed year over year. Living like a monk while scrimping and saving for a house gets old when you realize that your efforts aren’t getting you anywhere near where you’re attempting to go …
As for the situation now, the inflation warning signs are all around us if we dare to look. According to a report published in the May 21, 2021 issue of The Wall Street Journal, lumber may exhibit the most visible spike in prices, but consider what futures prices are showing for a whole range of commodities when compared to just one year ago:
Gold: +7%
Platinum: +29%
Wheat: +31%
Cotton: +40%
Coffee: +42%
Sugar: +52%
Silver: +56%
Natural gas: +65%
Soybeans: +81%
Crude oil: +85%
Cooper: +86%
Gasoline: +96%
Corn: +108%
Lumber: +278%
It doesn’t take a degree in economics to know that these sorts of trends are pretty alarming. Whenever it has an opportunity to take hold, inflation is one of the most insidious of economic problems – and one that’s extremely difficult to reverse. Inflation is also very debilitating for the personal budgets of the large majority of consumers, and it causes the most harm to those on the lower rungs of the economic ladder.
The next few months will tell us if this particular inflation is going to be a temporary phenomenon or not. How much of the commodity price increases are attributable to transitory events that will ease as the world’s economies move further from lockdown?
But if this inflation turns out to be something more structural or more directly correlated to the massive increase in government spending paid for by the expanded money supply, expect the economic (and political) climate to begin to look vastly different in the coming months.
Inflation will be uncharted territory for most people. But a few of us veterans will be around to provide context and counsel — and perhaps engage in a bit of “Sister Toldja” commentary while we’re at it …
As the United States emerges from the COVID crisis, the shape of the American economy is coming into clearer view. Part of that picture is the growing realization that lockdown policies, vaccination rollouts and government stimulus actions have created imbalances in many sectors — imbalances that will time to return to equilibrium.
Everyone knows the business sectors that have been hammered “thanks” to COVID: hospitality and foodservice, travel and tourism, the performing arts, sports and recreation, commercial real estate.
At the same time, other corners of the economy have blossomed — home remodeling, consumer electronics … and the public sector. This last one isn’t a function of any kind of increased demand, but rather pandemic-long guaranteed continuing income to workers on the public payroll.
As we emerge, factories and the building trades are finding it difficult to ramp up their operations to meet growing demand, hampered in part by supply chain issues and shortages of raw materials and parts sourced from offshore suppliers. As of now, most economists believe that such shortages won’t turn out to be long-term problems — but we shall see over time if this is actually the case.
Another imbalance is what’s been happening to the labor force. Government stimulus checks and unemployment benefits have been sufficiently robust so as to depress the number of workers seeking a return to employment in certain sectors — particularly in the service industries. As just one example, restaurants everywhere are finding it more than a little difficult to staff their reopened locations.
The latest forecasts are for the U.S. economy to grow at a blistering pace during the balance of 2021 — perhaps as high as an 8% or 9% seasonally adjusted rate of growth. That would be historic. But not everyone is going to benefit.
In a recent Wall Street Journal article, David Lefkowitz of UBS Global Wealth Management points out that “the very sudden stop to the economy and then the very quick restart has created a lot of havoc — a lot of businesses have gotten caught flat-footed.” But beyond this is the very real likelihood that inflation will emerge as a key factor in the economy, for the first time in more than 40 years.
Viewed holistically, the situation in which we find ourselves is one where many new and unusual “ingredients” have gone into the economy over the past year, resulting in an economic brew that is just as unusual — and perhaps even unique in our history.
An artificially depressed economy due to government fiat … followed by massive economic stimulus paid for by expanding the money supply … coupled with sudden demand propelling certain industries over others due to government-driven dictates: for sure it’s a new mix of factors. Considering this, I’m not at all sure that very many people inside or outside of government have a clear handle on what the next 18 months will actually bring.
But that doesn’t mean we can’t speculate about it, right? In the comment section below, please share your perspectives on what’s in store for the U.S. economy. I’m sure others will be interested in reading your thoughts.
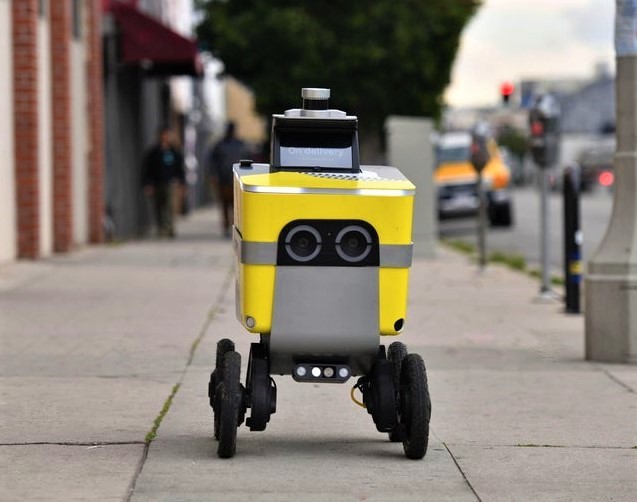
It had to happen: New state laws are now classifying robots as humans – specifically when it comes to traffic laws.
With the proliferation of delivery robots in quite a few urban areas, the issue was bound to arise. Car and Driver magazine reports that the state of Pennsylvania now defines delivery robots as “pedestrians” under a newly implemented law.
More specifically, the Pennsylvania legislative measures stipulate that “autonomous delivery robots” can lawfully maneuver on sidewalks, roadways and pathways. They’re allowed to carry cargo loads as heavy as 550 lbs. at speeds up to 25 mph. on roadways. (On pedestrian pathways and sidewalks, their speeds are capped at 12 mph.)
Pennsylvania is just the latest state to pass new laws regulating autonomous driving and flying technologies. Indeed, there are now a dozen states that allow delivery robots access to roads as well as pedestrian pathways.
A gita and its owner out for a stroll.
The new laws raise some interesting questions. Undeniably, delivery robots are a popular option for businesses and logistics companies; in a relatively short period of time their deployment has evolved well-past that of being merely a “novelty factor.” “The sidewalk is the new hot debated space that the aerial drones were maybe three or five years ago,” reports Greg Lynn, CEO of Piaggio Fast Forward, a robotics design firm that offers a suitcase-sized robot called gita that follows its owner around.
But deploying robots onto street- and sidewalk-grids that were mapped out decades ago – when there were no expectations of the sci-fi scenarios of autonomous vehicles – can be quite problematic from a safety standpoint.
Of course, we’ve faced this issue before – and not so very long ago – with the emergence of the Segway “people mover.” Those contraptions have caused more than a few problems (accidents and injuries) in urban centers around the world, leading some European center-cities to effectively ban their use — such as in Budapest and Barcelona.
And in the city of San Francisco – no technology backwater – delivery robots have been prohibited from operating on most city streets. Municipal leaders have cited potential safety concerns. Moreover, the National Association of City Transportation Officials (NACTO) has gone on record stating that robots “should be severely restricted, if not banned outright.”
One thing’s for sure: With the fast-growing phenomenon of delivery robots and other autonomous vehicles, the whole notion of “sharing the road” has taken on an additional dimension.
Do you have any interesting reports to share from what you may have encountered in your own town or region? Please share your observations with other readers.
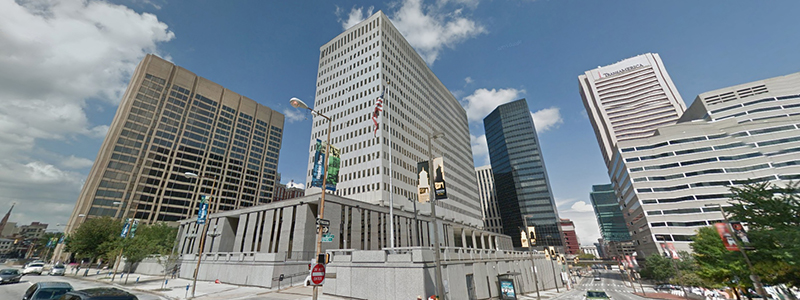
One of the many ripple-effects of the COVID-19 pandemic is the effect it’s had on the demand for commercial office space.
In a word, it’s been pretty devastating.
The numbers are stark. According to an estimate published by Dallas-based commercial real estate services and investment firm CBRE Group, Inc., as of the end of 2020, nearly 140 million sq. ft. of office space was available for sublease across America.
That’s a 40% jump from the previous year. Not only that, it’s the highest sublease availability figure since 2003, which means the situation is worse than even during the Great Recession of 2008.
Of course, it isn’t surprising to expect that more sublet space would become available during periods of economic downturn, when many businesses naturally look for ways to cut costs. But those dynamics typically reverse when the economy picks up again. This time around, it’s very possible – even probable – that the changes are permanent.
The reason? Many companies that reduced their office space footprint in 2020 didn’t doing so because they we’re suffering financially. It was because of government-mandated lockdowns. And now they’re expecting many of those employees to continue working from home, either part-time or full-time, after the pandemic subsides.
Employee surveys have shown that many workers prefer to work from home where they can avoid the hassle and expense of daily commuting. It’s understandable that they don’t want that to change back again. In many business sectors which don’t actually need their workforce be onsite to produce revenue, companies are simply ratifying a reality that’s already happened. Accordingly, they’ve changed their expectations about employee attendance at the office going forward.
Commercial landlords are now feeling the long-term effects of this shift in thinking. Rents for prime office space fell an average of 13% across the United States over the past year. In places like New York and San Francisco the drop has been even steeper — as much as a 20% contraction.
For many of the lessees, it’s less onerous to sublease space to others rather than attempt to undertake the messy business of renegotiating long-term lease contracts with landlords. Still, there’s pain involved; sublease space historically comes with a significant discount — around 25% — but with the amount of sublet space that’s been coming onstream, those discounts may well go even deeper due to the lack of demand.
The cumulative effect of these leasing dynamics is to put even more downward pressure on broader rental rates, as the deeply discounted space that’s available to sublet puts more pressure on the price of “regular” office space. It’s a classic downward spiral.
Is there a natural bottom? Most likely, yes. But we haven’t reached it yet, and it’ll be interesting to see when — and at what level — things finally even out. In the meantime, it isn’t a very pretty picture.
What are you witnessing with regards to office space dynamics within your own firm, or other companies in your business community? Please share your thoughts below.

 Most people in business and politics have heard of the World Economic Forum (WEF), best known for holding its annual meeting for the world’s glitterati every January in Davos, Switzerland.