
 Now that we’re down the road a good ways with the COVID-19 pandemic, it’s interesting and perhaps instructive to make a comparison between the current pandemic, and the 1918 H1N1 (influenza) pandemic, colloquially known as the “Spanish Flu,” that happened a little over a century ago.
There is no firm consensus on when the 1918 H1N1 pandemic actually began, but according to the U.S. Center for Disease Control and Prevention, it was first identified in U.S. military personnel in the spring of 1918 and ran its course for at least 44 weeks until May 1919, killing approximately 675,000 people in the United States.
In as much as the U.S. population was about 100 million at that time, the 1918 H1N1 pandemic’s death rate was about 6.4 per thousand people (0.6% of the population).
By contrast, the COVID-19 pandemic has been underway for 89 weeks (and counting) in the U.S., killing about 783,000 people here so far. The U.S. population had grown to about 330 million by 2020, so the COVID-19 death rate thus far is about 2.4 per thousand people (0.2% of the population).
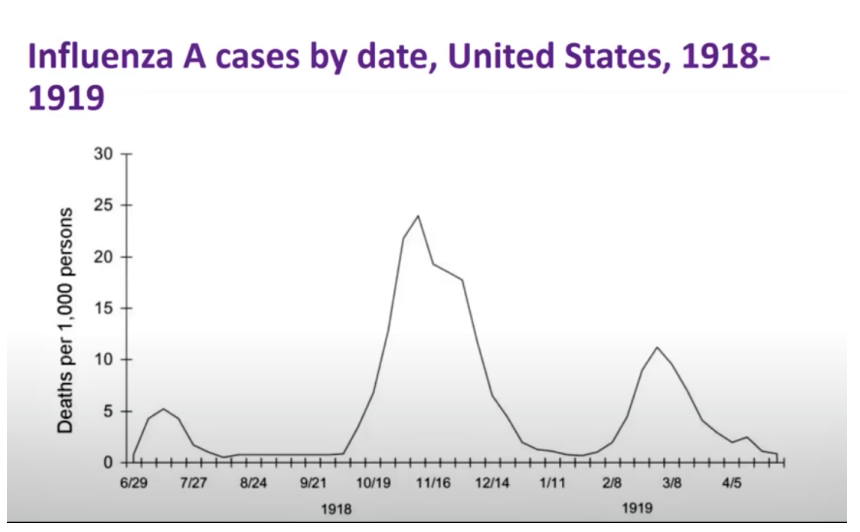
University of California – San Francisco epidemiologist George Rutherford has compiled a summary chart for the 1918 H1N1 pandemic in the U.S. According to the data, Spanish Flu’s first wave occurred in July 1918, followed by a second and far deadlier wave between October and December 1918 – and then a third less-deadly wave in February and March 1919, as depicted in Dr. Rutherford’s chart. At the peak of the second wave in November 1918, the U.S. experienced 24 deaths per thousand population per week.
It’s interesting to see how this historical data compares to the COVID-19 pandemic, which began in the U.S. with a first wave between March and June 2020, followed by a smaller wave between July and September 2020. The largest and deadliest wave occurred between October 2020 and March 2021, when the weekly death rate peaked at 7 per thousand population. The fourth and most recent wave began in August 2021 until the present. You can view the weekly deaths per thousand population for both pandemics on this chart:
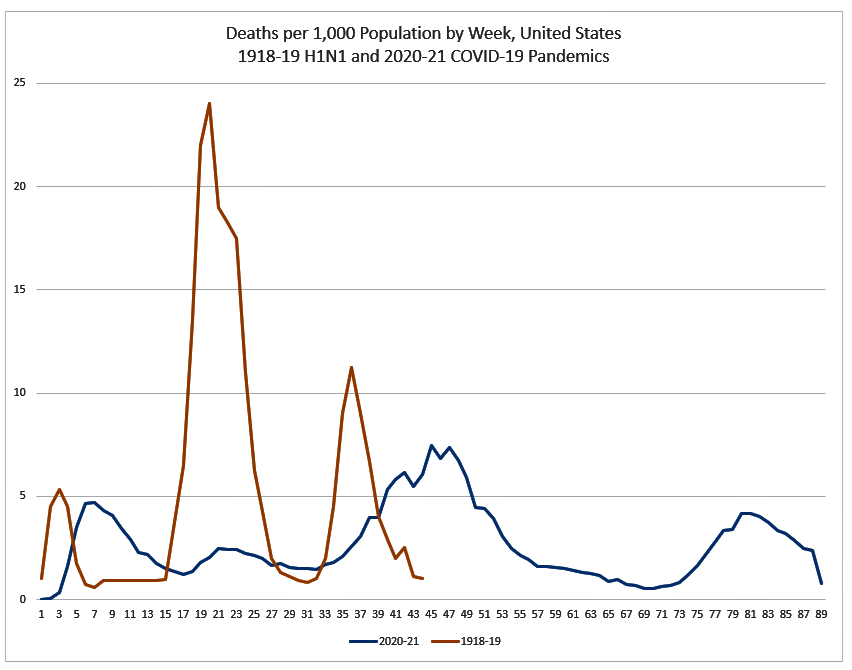
What’s clear is that, so far, the COVID-19 pandemic has lasted twice as long, while being one-third as deadly as the 1918 H1N1 pandemic.
This leads to an interesting insight. On the economic front, with comparatively little government regulation or monetary relief to citizens, the business cycle back in the early part of the 20th century tended to be shorter but much more volatile than it is today, exhibiting higher highs followed by lower lows.
Similarly, the degree of government regulation and involvement in matters of public health, including strong support for the rapid development of new vaccines, has been much greater during the COVID-19 pandemic than it ever was during the 1918 H1N1 pandemic.
It would seem that increased government involvement during economic and public health crises tends to moderate the ill effects — but at the cost of prolonging the misery.
The question is whether this connection is causation or coincidence. Please share your own thoughts in the comment section below.
(h/t Nelson Nones for researching and plotting the comparative stats.)
