Responses from two people in particular are worth highlighting for the “countervailing views” that they espouse. I think both have merit.
The first response came from my brother, Nelson Nones, who has lived and worked outside the United States for decades. His perspectives are interesting because, while fully understanding domestic events and policies, he also brings an international orientation to the discussion due to his own personal circumstances. Nelson is looking to history for his perspectives on the inflation issue, offering these comments:
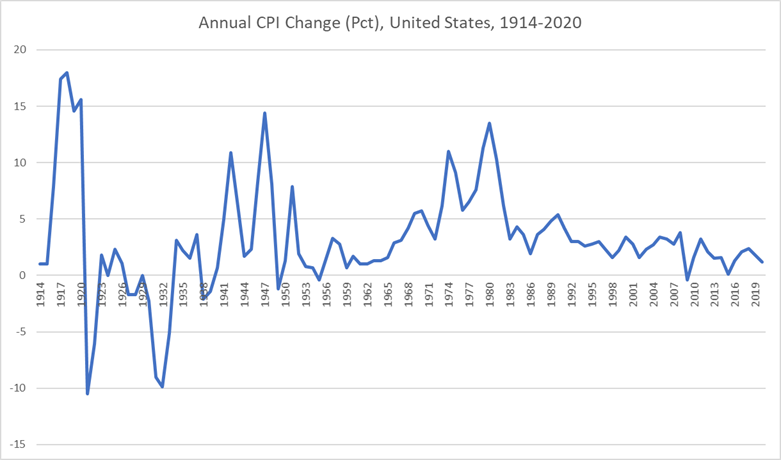
The chart below shows annual U.S. CPI percentage change for the past 106 years:
Projecting the latest (April 2021) Consumer Price Index forward to an entire year suggests that the U.S. will experience a 3.1% inflation rate in 2021. That would be higher than in any year since 2011, which was a bounce-back year following the Great Recession. Otherwise, the generic inflation trend has been consistently down since 1982 (nearly 40 years).
If the historical trends are any guide, and if we are indeed entering a persistent inflationary phase, it would take another decade before inflation growth approaches the levels seen during the 1970s.
But I think the likeliest scenario is experiencing a sharp uptick this year due to pent-up demand following the COVID-19 pandemic that will causie spot shortages, followed by resumption of a downward trend over the following ten years or so.
That’s similar to the pattern you can observe in the chart [above] during the years following the end of World War II, which had also created massive pent-up consumer demand.
Consider that the coronavirus pandemic hasn’t really altered the underlying economic fundamentals. The past 40 years has witnessed an explosion of manufacturing capacity in China and other developing countries, and that hasn’t gone away. Meanwhile, dependency on oil — a key driver of inflation in the 1970s — has shrunk due to improved energy efficiency and aggressive exploitation of renewable energy resources, which for all practical purposes are in infinite supply.
Another factor, which doesn’t get as much attention as it probably should, is declining birth rates and aging of the population on a global scale, leading to a slower rate of population growth in the future that may constrain demand for consumer products in comparison to the past century. Let’s face it — we old farts just don’t consume as much as growing families do!
So yes, we should keep an eye on inflation — but I don’t think we’re in for a repeat performance of the horrible 1970s.
Echoing Nelson’s thoughts are the perspectives of another business veteran — an editor and publisher who has been intimately involved in the commercial/B-to-B field for decades. Here is what he wrote to me:
I don’t want to get into a public debate with the inflationistas because I will never convince them that this is likely not a replay of the 1970s and early 80s inflationary period pre-[Paul] Volcker. (Speaking personally, I didn’t own a house until I was 42 for the very reasons you cited in your blog post, and I was just a lowly editor back then.)
What we’re seeing today is simply the price shock of suddenly soaring demand, aggravated in the case of some commodities such as steel by Trump-era tariffs.
All commodities are tied to the price of crude oil, the most volatile of all commodities, which is long-denominated in U.S. dollars. WTI crude pricing is now at around $63 per bbl. — about where it was in early 2020 before the pandemic hit. It went negative for a time during the worst period of the crash in worldwide demand that was brought about by the pandemic. Tanks couldn’t be found into which to put the excess crude coming out of the ground from U.S. fracking. Traders freaked out, as they sometimes do.
So naturally, the percentage changes today look jaw-dropping. I can go through all the other commodities mentioned in your post and provide simple explanations as to why each is currently on the rise. Logistical bottlenecks are a big problem with everything — but as with oil, most of the issue is the sudden surge in demand as the pandemic winds down even as production and logistics aren’t yet prepared to fulfill the need.
In other words, the situation has very little to do with government spending — especially since most of the infrastructure money isn’t even allocated, let alone spent. Also, the Biden administration has yet to raise a single tax. It can’t. Only the House Ways and Means Committee can initiate tax changes, and those must then go through the Senate to become law. Senate Minority Leader McConnell and his allies have made sure nothing has gotten through.
Of course, it never hurts to keep an eye on things — especially with structural inflation as you noted in your article. But it’s important to look also at other, broader data. The Producer Price Index in April did reflect the increase in commodities prices, but the Consumer Price Index, even though it had a month of robust increases, remains below 3% annualized. And the Personal Consumption Expenditure Price Index, which is what the Fed pays attention to the most, is still tracking under 2% on an annualized basis. (A little inflation can be a good thing, actually.)
On the income side, average wage rates aren’t rising; they’re more likely to be falling in the future as low-wage service workers, including those in foodservice, re-enter the market.
So in my view the things people see with inflation are most likely short-term issues. Let’s look at it again in six months to a year. I’d also suggest that people read economist Paul Krugman’s columns in the New York Times for a bit of perspective that’s counter to the views of the inflationistas, if only for balance. The monetarists have been wrong since Volcker squeezed out the inflationary spiral. It was painful, though — so we’ll want to keep an eye on things.
Considering the views put forward above, I think it’s fair to conclude that “the jury’s out” on whether we’re actually entering a prolonged inflationary period. If you have additional thoughts or perspectives to share on either side of the issue, I’m sure other readers would be interested to hear them. Feel free to leave a comment below.
It’s an important issue that deserves an equally thoughtful response, so I invited Nelson to share his own thoughts on the issue. Here’s what he wrote to me:
The introduction of new contact tracing apps for smartphones has raised quite a few privacy fears around the globe. This is a very hot topic right now which deserves attention. However, to keep my original article about the ability to conduct effective contact tracing on point, I purposely sidestepped the privacy issue — other than mentioning privacy fears briefly in the ‘Technology Limitations’ section of the article.
Here I’ll expand a bit. Naturally, the coronavirus pandemic has raised a lot of concern about Orwellian “big brother” surveillance and government overreach, but what many people may not realize is that it’s not about expanding “the target population of surveillance and state control” as the commenter notes. When it comes to public health, governments – including state governments in the United States – have possessed these powers for a long time.
I first discovered this in my own personal life about 20 years ago. I was at work in Long Beach one day when I received a call from the California Department of Health, informing me that I was confirmed to have a highly contagious gastrointestinal infection and ordering me to submit regular stool samples until my tests came back negative. I was informed that if I did not do so, I could be forcibly quarantined — and fined or even jailed — if I refused to cooperate.
My first question to myself was, “How the h*ll and why the h*ll did they target me?”
I had recently returned from a trip to Thailand and started having GI issues, so I went to my doctor and gave a stool sample. They performed a lab analysis which confirmed a particular type of infection that was listed on the Department of Health’s watch list, so I was informed that my doctor was obliged by law to report my case to the Department of Health.
The Health Department, in turn, was obliged by law to contact me and issue the orders given to me – and by law I was obliged to comply with their orders.
The reason that nations, states and provinces have such powers is to contain and control the spread of infectious diseases. This means that governments have the power to forcibly isolate people who are confirmed to be infected — and they also have the power to forcibly quarantine people who are suspected (but not yet confirmed) to be infected.
Whether or not, and how, they choose to exercise those powers depends on the nature of the disease, how it’s transmitted, whether or not an epidemic or pandemic has been declared, and whether or not proven cures exist. Moreover, rigorous protocols are in place to protect people against the abuse of those powers.
But the bottom line is: in most countries, including the United States, if you are unfortunate enough to catch an infectious and communicable disease, you have no constitutional right to prevent the government from identifying you and potentially depriving you of your civil liberties, because of the risk that you could unknowingly infect other people.
Think of it as a civic duty — just as you have no constitutional right to prevent the government from ordering you to perform jury service.
Medical science is so advanced these days that most diseases can be contained and controlled without having to inconvenience more than a relatively small number of people, which is why most people have no idea that governments possess such vast powers. But COVID-19 is a once-in-a-century outbreak that’s so novel, so poorly understood, and so communicable that nearly everyone in the world is being deprived of their civil liberties right now out of an abundance of caution.
Realistically, one could expect these restrictions to remain in place unless and until COVID-19 vaccines and/or therapies are invented, proven and made available to the public – at which time it will (hopefully) be possible to manage COVID-19 like the seasonal flu, which doesn’t require draconian public health measures.
As for the new smartphone apps, have a look at this recent article that appeared in Britain’s Express newspaper which will give you a good idea of how “hot” this topic has become.
The key question here is whether or not the database backend (which is the software that my company Geoprise makes) is “centralized” or “decentralized.” A “centralized” backend follows the Singapore model and contains personally-identifiable information (PII) about everyone who registers the app with a public health authority and/or is confirmed to be infected.
Conversely, some researchers are proposing a “decentralized” backend which serves only as a communications platform, and only ever receives anonymized and nonlinkable data from the smartphones.
This is the privacy and security model that Apple and Google are following, but there is no way that such a “decentralized” backend could ever serve as a contact tracing database in the traditional sense. That’s because a traditional contact tracing database, by definition, always contains linkable PII. (Incidentally, our Geoprise software could be used in either a “centralized” or “decentralized” manner.)
The key thing to understand about even the most “centralized” of the smartphone apps, such as Singapore’s TraceTogether app, is that they contain numerous privacy and security safeguards. Here’s a short list:
The data which is captured and retained on individual devices identifies a particular smartphone only by an encrypted “TempID” which changes periodically (Singapore’s recommendation is to change the TempIDs every 15 minutes). This makes it impossible for a smartphone owner or eavesdropper to reconstruct complete histories of encounters held on the devices in a personally-identifiable way.
As my original article states, the contact tracing apps don’t use or store geo-location data (i.e. “where your smartphone was”) because GPS measurements are too unreliable for proximity-sensing purposes. Instead they use the device’s Bluetooth radio to sense other Bluetooth-enabled devices that come within very close range (i.e. “devices that were near your smartphone”).
The apps are opt-in. You can’t be compelled to download the app or register it with the public health authority (unless you happen to live in Mainland China — but that’s yet another story!).
Only people who are confirmed to be infected are ever asked to share their history of encounters with the public health authority.
Sharing your history of encounters is voluntary. You can’t be compelled to upload your contact tracing history to the public health authority’s backend server.
Apple and Google appear to be taking this a step further by:
Allowing smartphone owners to “turn off” proximity sensing whenever they wish (such as when meeting a secret lover during trysts, or for more innocuous occasions).
Allowing smartphone owners to delete their history of encounters on demand, and to erase all data when uninstalling the app.
“Graceful dismantling” – to quote one researcher:“The system will organically dismantle itself after the end of the epidemic. Infected patients will stop uploading their data to the central server, and people will stop using the app. Data on the server is removed after 14 days.”
The bottom-line on privacy and government overreach, I think, is for everyone to step back a safe distance from one another, and take a deep breath …
In recent days, news reports about the coronavirus pandemic have gravitated from a shortage of ventilators and possible overcrowding in the nation’s hospitals to how best to reopen the economy (and society).
The challenge, of course, is how to “reopen” in responsible ways that don’t result in a new flare-up of COVID-19 cases.
One of the biggest obstacles in the way of bringing the economy – and life – back to some semblance of “normal” is being able to know who has, or has had, the coronavirus — and beyond that identifying who the people are that each affected person has interfaced with in the previous weeks.
There’s the old-fashioned way of doing contract tracing: undertaking in-depth interviews with patients to learn who they have interfaced with for 15 minutes or longer over a period of 2-3 weeks … and then interviewing those persons plus the people they’ve interfaced with … and so on down the line.
Those suspected of being exposed can then be directed to quarantine themselves for the requisite two-week period so as to arrest the spread of the virus.
The other challenge with traditional contact tracing is that the data being collected is based on memory and recollections, which as we all know are prone to fallibility.
In our tech-savvy world, some giants are “on the case” – entities like Google and Apple that have teamed up to use cellphone tracking technology to “keep tabs” on people’s movements and thereby know what people may have been exposed to the COVID-19 virus.
Of course, this solution is also prone to gaps in coverage, as phones aren’t turned “on” at all times, not to mention that significant swaths of the population – particularly the elderly – aren’t using cellphones equipped with the types of location information functionalities that can be tracked. (Surprisingly perhaps, smartphone penetration worldwide still languishes at only around 45% of cellphone users.)
And then there’s always the issue of “privacy” lurking the background – a factor which can’t be ignored in a world where many people are already suspicious of governments snooping into their private lives.
But there could be other methods to employ by which contact tracing can be made more efficient, and more accurate – and at a more reasonable price tag.
Recently my brother, Nelson Nones, whose company, Geoprise Technologies Corporation, specializes in encrypted data management, outlined just such a practical solution that can accomplish this trio of disparate-yet-important goals.
I find the article as persuasive as it is understandable to a technology layperson like myself. Moreover, it seems as though the solutions proposed could become an essential software-as-a-service (SaaS) solution not just for government agencies but for private business organizations, too.
Action is already happening, but so far, the results have been somewhat mixed despite strong support from governments, private businesses and end-users. Functionalities need to continue to build.
But it looks like we may be on our way … and that’s extremely good news for anyone who has an interest in reopening the economies of the world – and going back to living life the way humans were meant to live it.
Regular readers of Nones Notes Blog know that my brother, Nelson Nones, has lived and worked outside the United States for nearly 25 years – much of that time in East Asia. So naturally I was curious about his perspectives on the spread of the Coronavirus from its epicenter in Wuhan, China, what precautions he is taking in the face of the threat, and his perspectives on how the actions of Asian countries affected by the outbreak may be mitigating the potential effects of the virus.
Here is what Nelson wrote to me in response to my query:
The Coronavirus has not affected my business here in Bangkok to date. I did make a trip to Singapore during the last week of January and to Taiwan during the first week of February, after arriving back in Thailand from the U.S. on January 12th. I haven’t been sick at all – before or since.
However, in an abundance of caution I am keeping myself at home as much as possible, and I have decided not to travel anywhere until the current hullabaloo dies down.
As for the situation here in Thailand, this country is actually the location of the first COVID-19 (Coronavirus) case ever recorded outside Mainland China. This was back on January 13th, just two weeks after China first notified the World Health Organization (WHO) of the new disease, and only two days after China recorded its first COVID-19 death.
The patient here in Thailand was a Chinese woman who had traveled from Wuhan, the epicenter of the pandemic.
Since then, Thailand has recorded 42 additional cases for a total of 43 patients, of whom only one died (on Sunday March 1st), and 31 have recovered. This leaves 11 active cases – all considered mild.
The first case of human-to-human virus transmission within Thailand was recorded on January 16th, affecting a taxi driver. Of the 43 cases confirmed so far, 25 affected Chinese citizens; seven affected Thai citizens with travel histories to China, Japan or South Korea; seven affected Thai citizens who work in the tourism or healthcare industries; and the remaining four were other domestic cases (of which only two potentially represent “community spread”). Thailand’s infection growth factor peaked on January 26th.
Being one of the world’s most popular tourist destinations (especially from China), Thailand has never imposed any travel restrictions, even from China (nor has the U.S. ever imposed any COVID-19 travel restrictions on Thailand), but all arriving international passengers are screened by an initial body temperature check. Those who fail the initial screening are required to disclose their travel histories within the past 14 days, in detail. If they have travelled to or from any affected areas, and exhibit any COVID-19 symptoms, they are immediately quarantined at a specially-designated hospital for isolation and treatment.
Under the circumstances, and considering its geographic proximity to China as well as the normal volume of Chinese tourist travel, I think Thailand’s containment efforts so far have been successful and offer some lessons for the United States. Containment in India, Indonesia and Bangladesh so far is even more impressive (Indonesia reported its first two cases only on March 2nd).
Displayed below is a listing of South, Southeast and East Asian countries, ranked by population (together with the U.S. for comparison purposes), showing the number of cases and deaths reported so far:
The countries shaded in green, above, are those which did not require advance visas for Chinese citizens holding ordinary passports, prior to the imposition of temporary COVID-19 travel restrictions. These countries were either visa-free or allowed “visa on arrival.”
The countries in red typeface, above, are those which had imposed temporary COVID-19 travel restrictions as of early February 2020. These include “entry bans on Chinese citizens or recent visitors to China, ceased issuing of visas to Chinese citizens and re-imposed visa requirements on Chinese citizens or countries that have responded with border closures with China.” (See https://en.wikipedia.org/wiki/Visa_requirements_for_Chinese_citizens for source data.)
It’s quite clear from the data above that, excluding Mainland China itself, there is little or no correlation between the incidence of COVID-19 cases or deaths and the leniency of a country’s previous or current travel restrictions in so far as Mainland Chinese are concerned.
Indeed, all of the four countries having a higher number of cases than Thailand (Japan, South Korea, Hong Kong and Singapore) required advance visas before the COVID-19 outbreak, and all but one (Hong Kong) had imposed COVID-19 entry bans as of February 2nd.
Conversely, apart from Thailand, the countries which did not require advance visas before the COVID-19 outbreak have averaged fewer than one case per country (although all of them except Cambodia and East Timor had imposed temporary COVID-19 travel bans by February 2nd).
The countries shown in bold typeface above are those which are geographically closest to the COVID-19 epicenter. An average of 570 COVID-19 cases have been reported within each of these 10 countries; only Laos has been immune so far. Conversely, an average of 6 COVID-19 cases have been reported within each of the remaining 26 countries (excluding China itself).
From these data, I’ve drawn the following four generalizations:
Outside of Mainland China, international travel bans and visa restrictions are not effective tools for controlling the spread of COVID-19 disease within a country.
Geographic proximity to Mainland China is well-correlated to the historical spread of COVID-19 disease in South, Southeast and East Asia.
Vigilant screening and disposition of suspected cases is vital to containing the spread of COVID-19 disease, as Thailand’s experience demonstrates.
Allowing high concentrations of suspected cases to form without treatment, such as Wuhan (China), the Diamond Princess docked at Yokohama (Japan) and Shincheonji church at Daegu (South Korea), is a recipe for disaster.
Of course, the virus and its spread is an evolving narrative, and Nelson’s observations may soon be overwhelmed by new developments. Still, I was somewhat surprised to read that the situation is not quite as dire as the news reporting here in the U.S. would seem to indicate.
Have you heard from overseas friends or colleagues about how they are responding to the Coronavirus outbreak? Please share their perspectives with other readers here.
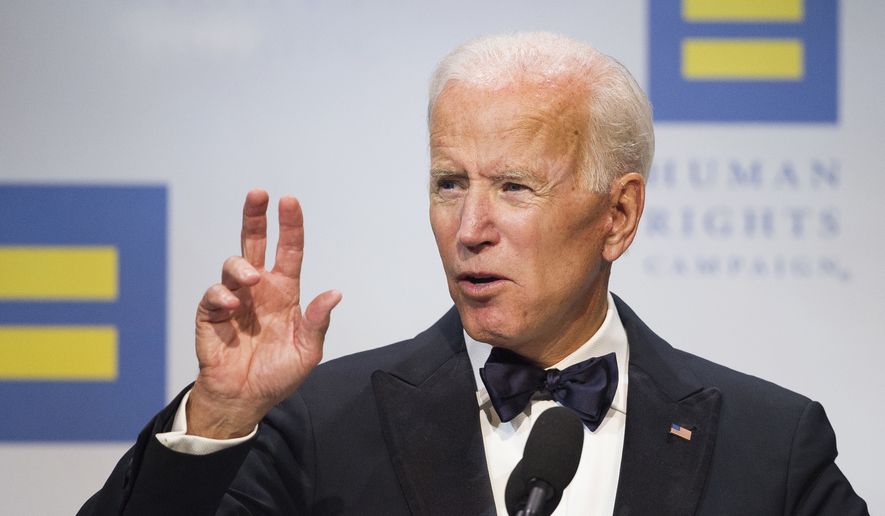
Astonishingly tone-deaf and factually questionable: “China is going to eat our lunch? Come on, man … they can’t even figure out how to deal with the fact that they have this great division between the China Sea and the mountains … in the west. They can’t figure out how they’re going to deal with the corruption that exists within the system. I mean, you know, they’re not bad folks, folks. But guess what? They’re not competition for us.” (Former Vice President Joe Biden, May 1, 2019)
In recent months, we’ve been hearing a wide range of views about China’s economic and political aspirations and their potential implications for the United States.
Some of the opinions being expressed seem to be polar opposites — such as President Donald Trump’s pronouncements that the United States has been “ripped off” by China for decades. Contrast this with former Vice President Joe Biden’s dismissive contention that China represents no competition for the United States at all.
The column is titled Trump Is Waging (and Winning) a Peaceful World War III Against China. My curiosity aroused, I decided to get in touch with my brother, Nelson Nones, who has lived and worked in the Far East for the past 20+ years. Being an American “on the ground” in countries like China, Taiwan, South Korea, Thailand and Malaysia gives Nelson an interesting perspective from which to be a “reality check” on the views we’re hearing locally.
I sent Nelson a link to the Morris op-ed and asked for his reaction. Here is what he communicated back to me:
I think Dick Morris is correct to contend that the Chinese government’s long-term vision is bigger than just accumulating more wealth and power. In fact, I wrote about this topic in the book I co-authored with Janson Yap, when describing China’s “Belt and Road” initiatives as a geographic positioning threat to Singapore.
I wrote:
“As a land-based strategy, the SREB [Silk Road Economic Belt] promises greater long-term rewards for China than the MSR [Maritime Silk Road]; these would echo the impact of the completion of the first transcontinental railroad in 1869, which marked the beginning of the ascendancy of the U.S. to becoming one of the preeminent economic empires of all time.”
The context here is, if you look back through history, the world’s most dominant economic empires were either terrestrial or maritime — but not both — until the U.S. came along. As I further wrote in the book:
“After gaining control over both strategic land and maritime trade routes with the completion of the Panama Canal in 1913, America became the first land-based and maritime economic empire in history; its dominance has spanned over a century, from 1916 to the present. Uncoincidentally, the American economic empire began when the Panama Canal was completed, but the Panama Canal has arguably contributed far less to America’s GDP than the country’s investments in transcontinental rail and road transportation infrastructure.”
In short, I am absolutely sure China’s government aspires to overtake the U.S. as the world’s dominant terrestrial and maritime economic empire, and to hold that position for at least a century if not longer. But this would not be the first time in history that China has held such a position.
For the historical context, refer to: http://fortune.com/2014/10/05/most-powerful-economic-empires-of-all-time/. There you will see that the U.S. produced half the world’s economic output in circa 1950. China’s Song Dynasty was the world’s preeminent economic empire in circa 1200 AD, producing 25% to 30% of global output. Only the U.S. and the Roman Empire have ever matched or exceeded that marker.
I can tell you from my considerable experience on the ground in China that the strategic vision of its leaders is grounded in much more than just backward-looking grievance and necessity. Although the 19th Century Opium Wars (which were fought during the Qing Dynasty against the British Empire, and occurred during the period of the British Empire’s economic ascendancy) are often trotted out in China’s government-controlled English language dailies, the Chinese people I know have little or no knowledge of the Opium Wars or the colonial victimization China allegedly suffered a century and a half ago.
But they are acutely aware, and genuinely proud, of China’s emergence as a leading economic powerhouse; and this is how the Chinese government maintains its legitimacy.
China’s ambitions, in other words, have much more to do with reinstating its former glory (the Song Dynasty economic empire) than with righting wrongs (dominance by colonial powers), and are fundamental props for maintaining the Chinese Communist Party’s grip on power.
This view renders many of Dick Morris’ comments unnecessarily hyperbolic; for example “[China’s] goal is to reduce the rest of the world to colonial or dominion status, controlled politically, socially, intellectually, and economically by China. In turn, China is run by a handful of men in Beijing who need not pay the slightest attention to the views of those they govern or the nations they dominate.”
No, China’s goal is to become the world’s dominant economic empire but, just as the Americans before them, they don’t have to exert the same degree of control over the rest of the world as they do within their own territory to achieve this goal.
And no, they require constant support from the Chinese population to achieve this goal, even though they run an authoritarian state. Why else would they devote so many resources to the “Great Chinese Firewall” if there is no need to “pay the slightest attention to the views of those they govern”?
Yes, Trump’s trade war with China is important but his motive is to reverse the flow of jobs and capital out of the U.S. to China, which is not the same thing as launching an “economic World War III.” At a more practical and mundane level, it’s to fulfil a pile of campaign promises which Trump made when he was running for President, and to secure the loyalty of his base.
_______________________________
So there you have it: the perspectives of someone “on the scene” in the Far East — holding a view that is more nuanced than the hyperbole of the alarmists, but also clear-eyed and miles apart from the head-in-the-sand naiveté of other politicians like Joe Biden.
Let’s also hope for a more meaningful and reality-based discourse on the topic of China in the coming months and years.
In recent weeks, there has been an uptick in articles appearing in the press about the downside risks of the Internet of Things (IoT). The so-called “Weeping Angel” technique, which essentially allows hackers to turn a smart television into a microphone, is one eyebrow-raising example included from the CIA files released by WikiLeaks recently. Another is the potential for hacking into the systems of autonomous vehicles, enabling cargo to be stolen or the vehicles themselves to be held for ransom.
Some of it seems like the stuff of science fiction – or at the very least a modern form of cloak-and-dagger activity. Regular readers of the Nones Notes blog know that when we’re in the midst of a “collective angst” about a topics of this nature, I like to solicit the views of my brother, Nelson Nones, who has been in the fields of IT and operations management for decades.
I asked Nelson to share his perspectives on IoT, what he sees are its pitfalls, and whether the current levels of concern are justified. His comments are presented below:
Back in 1998, I was invited to speak about the so-called “millennium bug” (also known as the “Y2K bug”) at a symposium in Kuching, Malaysia. It was a hot topic at that time, because many computer systems then in use hadn’t been designed or built to deal with calendar dates beyond the end of the 20th century.
The purpose of my presentation was to educate the audience about the nature of the problem, and how to mitigate it. During the question-and-answer session which followed, a member of the audience rose and began to speak rather hysterically of the threat which the millennium bug posed to civilization as we knew it.
His principal concern was the millions of embedded sensors and controllers in use throughout industry which were not programmable and would therefore need to be replaced. In his view, very few people knew which of those devices were susceptible to the millennium bug, or where they were running.
As a result, he felt that many flawed devices would go undetected, causing critical infrastructures such as power generation plants, electricity grids and aircraft to fail.
Needless to say, his dire predictions did not come to pass and humankind sailed into the 21st century with barely a murmur. This isn’t to say that the millennium bug wasn’t a real threat – it certainly was – but rather that providers and users of information technology (IT) mostly did what was necessary to prepare for it. As Britain’s Guardian newspaper reported in April 2000, “In truth, there have been bug incidents … none of this, however, adds up to global recession, or infrastructure collapse, or accidental nuclear war, as the most heated prophets were anticipating.”
It is for similar reasons that I take much of today’s hype over security vulnerabilities of IoT with more than a pinch of salt.
It’s worth noting that, technologically speaking, IoT isn’t really very new at all. As the prophet of doom at my 1998 symposium (correctly) observed, sensors, software, actuators and electronic controllers have been integral components of automated industrial systems for the past thirty years at least.
What’s new is that these technologies have begun to be accepted and deployed by consumers. I say “begun” because I don’t know anyone who has actually rigged a “smart home” to work in the all-encompassing way breathlessly envisioned by purveyors of home automation technology; but I do know people who use the technology for specific purposes such as home security, thermostat control and recording TV programs.
Just last week I spoke with someone who is beta testing a self-driving Tesla automobile, but he confessed that he still won’t take his hands off the wheel because he doesn’t really trust the self-driving technology yet.
What’s also new is that businesses are extending their use of sensors and controllers well beyond the confines of plants, factories and warehouses. For example, trucking companies routinely use global positioning system (GPS) sensors to monitor fleet locations in real-time.
Aircraft engine makers such as Rolls-Royce and GE rely on management and monitoring systems to transmit information from sensors to ground stations for real time analysis, during flight. Many problems which are detected in this manner can be instantly corrected during flight, by relaying instructions back to controllers and actuators installed on the engine.
The common denominator for what’s new is the use of existing Internet infrastructure; hence the “I” in “IoT.”
In earlier times, sensors, software and electronic controllers could communicate only through local area networks (LANs) which were physically isolated and therefore impermeable to external attacks. But when those devices are connected to the public Internet, in theory anyone can access them — including cyber-criminals and governments engaged in sabotage or espionage, or who want to hold things for ransom, surreptitiously watch live feeds, or deploy botnets for distributed denial of service (DDoS) attacks.
It is clear, therefore, that the root causes of privacy and security concerns arising from increasing IoT usage are mainly network security lapses, and not the things themselves.
Ensuring the highest possible degree of network security is no easy task. Above and beyond arcane technical details such as encryption, installing network firewalls, and opening and closing of ports, it means deploying multiple layers of defenses according to specific policies and controls, and that requires skills and knowledge which most consumers, and even many businesses, do not possess.
Still, one doesn’t have to be a network geek to implement basic security mechanisms that far too many people overlook. In search of easy pickings, cyber-criminals usually prefer to exploit the huge number of unlocked doors begging for their attention, rather than wasting time trying to penetrate even slightly stronger defenses.
For example, many people install wireless networks in their homes but forget to change the default router password and default network name (SSID) – or they pick a password that’s easy to guess. In addition, many people leave their network “open” to anyone having a wireless card by failing to implement a security key such as a WPA, WPA2 or WEP key, or by choosing a weak security key.
An attacker can discover those lapses in a matter of seconds, or less, giving them full administrative authority and control over the compromised network with little risk of detection. This, in turn, would give the attacker immediate access to, and remote control over, any device on the network which is switched on but does not require authentication; for example, network printers, data storage devices, cameras, TVs and personal computers (PCs) which are not configured to require a user logon.
Plugging those security holes doesn’t require specialist knowledge and shouldn’t take more than an hour for most home networks. Recognizing the security concerns, an increasing number of hardware and software vendors are preconfiguring their products in “full lockdown” mode, which provides basic security by default and requires users to apply specialist knowledge in order to open up their networks as necessary for greater convenience.
This is precisely what Microsoft did over a decade ago, with great success, in response to widely publicized security vulnerabilities in its Windows® operating system and Internet Explorer browser.
It’s all too easy to imagine the endgames of hypothetical scenarios in which the bad apples win by wresting control over the IoT from the good guys. But just like the millennium bug nearly two decades ago, it is wiser to heed the wisdom of Max Ehrmann’s Desiderata, published back in 1927:
“Exercise caution in your business affairs, for the world is full of trickery … but do not distress yourself with dark imaginings.”
Going forward, I’m confident that a healthy dose of risk intelligence, and not fear, will prove to be the key for successfully managing the downside aspects of IoT.
_________________________
So those are Nelson’s views on the Internet of Things. What about you? Are you in agreement, or are there aspects about which you may think differently? Please share your thoughts with other readers.
Regular readers of the Nones Notes blog will know that my brother, Nelson Nones, sometimes contributes his thoughts and perspectives for the benefit of other readers. As someone who has lived and worked outside the United States for the past two decades, Nelson’s perspectives on domestic and international events and megatrends are always insightful — and often different from prevailing local opinions.
That has certainly been the case during 2016. In a year of four major election surprises, my brother correctly predicted the results at the ballot box in every single case. Below is a guest post written by Nelson in which he explains how he arrived at predictions that were so much at odds with the prevailing views and conventional wisdom.
Oh, and by the way … I was one of the “confidantes” Nelson refers to in his post, so I can personally vouch for the fact that his “fearless predictions” were made before the events happened — even if they were delivered to a skeptical (and at times incredulous!) audience.
_______________________________________
A TALE OF FOUR PREDICTIONS
By Nelson M. Nones, CPIM
Bangkok, Thailand — 13th November 2016
Rodrigo Duterte and Donald Trump
A handful of my confidantes across the world can vouch that I correctly predicted four momentous events during the past fifteen months: that Donald Trump would be the US Republican nominee, United Kingdom (UK) citizens would vote to leave the European Union (EU), Rodrigo Duterte would be elected President of the Philippines and Trump would win the US Presidency.
To my knowledge, no one else correctly predicted all four events.
Skeptics might dismiss my predictions as reckless, and credit my successes to dumb luck, but my confidantes can also attest that these predictions were the products of diligent analyses which I freely shared alongside the predictions themselves. What did I do to gain insights into the future that most others did not see?
Independent, Globally-Connected Thinking
Although I’m American, I have lived and worked in Thailand since 2004, and elsewhere in Asia and Europe for 16 years of the past two decades. During that time I’ve had the good fortune to visit or reside in over 40 countries on five continents, and form long-lasting professional relationships with knowledgeable people all over the world.
Not only has this experience given me a truly global perspective, it also filters out most of the distractions that partisans everywhere deliberately craft to alter what people think. Happily, for instance, I almost never encounter the barrage of negative attack advertising which fills every US election cycle. Avoiding so much propaganda, instead of continually having to confront and fend it off, has given me freedom and time to nurture and hold a much more independent and finely balanced point of view than I could ever have acquired by sitting in a single locale.
By now, the repudiation of globalization and free trade, and the rise of nationalist, populist fervor are universally recognized as key reasons why these four events unfolded as they did. Most people have come to realize or accept this only in hindsight, but my global perspective made the eventual gathering of these forces obvious years ago.
In 1999, while living in London, I published the article “Deflation’s Impact on Business Information System Requirements” in which I anticipated that deflation would force manufacturers to reduce their variable labor costs and warned, “These actions will have adverse and increasing social effects. Worker demands for improved economic security may lead to renewal of isolationist policies in some locales, which would effectively reverse the economic liberalization and globalization trends of recent years. Business models designed to optimize performance in the previous climate of unrestricted free trade will be adjusted to account for the artificial incentives and penalties created by new government regulations.” My inspiration was a special section of The Economist, “Could it happen again?” published on February 18th, 1999 which declared, “It is conceivable that the world may be in for a new period of global deflation (meaning falling consumer prices) for the first time since the 1930s” and concluded, “The world economy is, in short, precariously balanced on the edge of a deflationary precipice … history has shown that once deflation takes hold, it can be far more damaging than inflation.”
At that time, global inflation had fallen to 3.6% per year, from a peak of 14.8% in 1980. By 2014, global inflation had fallen further to 1.7%, and the best-fitting linear trend over the previous 44 years suggested to me that prices could stop rising altogether by 2018 globally, after which a period of negative inflation (“deflation”) might ensue, with prices falling perhaps by 0.4% in 2020. From this I concluded that the rise of isolationism, and the concomitant demise of globalization, economic liberalization and free trade, were near at hand.
First Hand Observation
It is one thing to sit in a chair, reading and writing about such things, and quite another to see the evidence up close and in person.
Nigel Farage
I spent four months of 2013 working in the UK, which gave me plenty of opportunity to watch local television news. One person who seemed to make headlines every day was the controversial politician Nigel Farage, then a Member of the European Parliament and Leader of the UK Independence Party (UKIP) who would spearhead the campaign to leave the EU nearly three years later. Earlier in 2013, he had led UKIP, a Eurosceptic and right-wing populist party, to its best performance ever in a UK election. Key planks in its platform at that time sound eerily familiar now and included deporting migrants, legalizing handguns, destroying wind farms (which many climate change deniers like to condemn as wasteful and unattractive), privatizing the National Health Service (NHS) and improving relations with Vladimir Putin. Just like Trump would do in 2016, UKIP ran strongest among less-educated voters in predominantly white, blue-collar areas, while faring much worse in areas dominated by college graduates, immigrants and minorities.
The following year I had the opportunity to travel by train from Paris to London. It was the first time I’d passed through the Channel Tunnel, that most emblematic symbol of free trade and European economic integration. But as the train approached the tunnel’s French portal, I was struck by the tight security and double fencing meant to prevent migrants from climbing or jumping onto trains bound for the UK. These were impressively similar to the border fencing and controls separating El Paso, TX from Ciudad Juárez, Mexico which my family and I visited in early January, 2015.
Later, I spent July and August 2015 in the Pacific Northwest. Trump was all over the news, both before and after his infamous Republican primary debate on August 6th. I instantly noticed the many similarities between Trump’s rhetoric and what I’d heard from Nigel Farage two years before. Just like Farage, Trump appeared to be running a campaign requiring no television advertising whatsoever. By provoking so much controversy, he seemed to receive thirty minutes’ free television interview time for every thirty seconds any other candidate got.
Based on these observations, on August 19th, 2015, I wrote a confidante, “Last week, at lunch, I made a prediction to our project team in Washington state: Trump will win the Republican nomination, and he will probably win the Presidency too (or at least come very close to winning it).” I added, “Right now, he is looking like a steamroller, and all the other candidates (Hillary [Clinton] included), are looking like ants who can’t run fast enough to get out of the way.”
Fast-forward to October, 2016, when I next visited the U.S. and drove all the way from New York to Minnesota through Pennsylvania, Ohio, Indiana, Illinois and Wisconsin. These states, with the exception of New York and Illinois, form the majority of the “blue wall” which Trump successfully breached on Election Day, losing only Minnesota by a tiny margin. I noticed, particularly outside the big cities of New York, Cleveland, Chicago, Saint Paul and Minneapolis, that Trump’s lawn signs and bumper stickers seemed to outnumber Clinton’s by something like four to one. I even spotted a few homemade Trump signs or marquees, but not a single one for Clinton.
My arrival in the U.S. coincided with the Washington Post release of the video containing Trump’s lewd comments about women. Yet while I was driving across America, even as new accusers came forward with fresh allegations of sexual assault and Trump’s prospects, according to media pronouncements, sagged precipitously toward new lows, the lopsided proportion of Trump lawn signs and bumper stickers appeared to stay firmly planted in place.
Hypothesis Framing
As early as August, 2015, long before the Republican primaries got underway, I began to formulate a hypothesis to explain why Trump could possibly win the nomination as well as the US Presidency. At the time, Trump led the Republican polls and there was talk that he would hit a 25 or 30 percent “ceiling” of support which, if true, would put the Republican nomination out of his reach.
I decided to test this notion using Lee Drutman’s analysis of an American National Election Studies (ANES) 2012 Time Series data set (Lee Drutman, “What Donald Trump gets about the electorate,” Vox, August 18th, 2015). Drutman’s thesis was that Trump, as well as Bernie Sanders, were playing to a sizeable number of voters representing up to 40 percent of the total electorate. In very broad terms, according to Drutman, the electorate breaks down like this:
40 percent are “Populists” – of which 55 percent are strongly Republican, lean Republican or are independent; attracted to Trump and Sanders.
33 percent are “Liberals” – of which 80 percent are strongly Democratic, lean Democratic or are independent, thus forming the core of Clinton’s support (and presumably would vote for Sanders as well).
21 percent are “Moderates” – evenly divided between Democratic, independent and Republican, thus more likely than not to vote for Clinton on the Democratic side or a mainstream Republican like Jeb Bush on the Republican side.
4 percent are “Business Republicans” – attracted to mainstream Republicans.
2 percent are “Political Conservatives” – attracted to other Republicans in the field.
Considering this, I reckoned that Trump, being the only populist candidate in the Republican field, could potentially attract all the Republican as well as independent “Populists” and thereby conceivably garner up to 58 percent of the Republican primary vote, far exceeding any 25 or 30 percent “ceiling” and more than enough to win nomination.
Thereafter, assuming Clinton won the Democratic nomination, I reasoned that in the general election Trump, as the only “Populist” standing for the Presidency and also the Republican nominee, could potentially attract all the “Populists,” Republican “Moderates,” “Business Republicans” and “Political Conservatives,” thereby taking about an eighth of Clinton’s natural support away from her and giving him up to 52 percent of the popular vote.
My reasoning was simplistic, but good enough to frame my working hypothesis: Trump wins the nomination, and the US Presidency, by running as a populist under the Republican brand.
Later on, right before the Brexit referendum, another of my confidantes, who is British, mentioned rumors that published polls were understating the true extent of support for leaving the EU because likely voters, who actually intended to vote for leaving, were reluctant to admit this fact to the pollsters. Indeed, the final compilation of polls released by The Economist on the eve of the referendum revealed 45 percent each for leaving and remaining, and 10 percent undecided, yet 52 percent actually voted to leave. This meant that seven out of every ten supposedly undecided voters ultimately chose to leave. It’s not improbable that many of them truly intended to do so all along. But if this were true, polling data alone could not be relied upon to predict the outcome.
This insight led me to frame a supplementary hypothesis just before the US general election. In consequence of Trump’s many campaign missteps and personal indiscretions, a “closet” vote exists comprising likely voters who fully intend to vote for Trump in the privacy of a ballot booth, but are too ashamed to admit it to a pollster (or anyone else, for that matter).
Data Gathering
As much as I prefer gathering and analyzing my own data, instead of relying on secondary sources, this option was out of the question. I would have to rely on whatever public polls were available.
Fortunately even in Thailand, using high-speed Internet it is possible to instantly retrieve and compile data from thousands of public polls. But not all public polls are alike. Some have better track records than others. Some rely on questionable methodologies or don’t disclose their methodologies at all. While some are issued by reputable and supposedly impartial polling organizations, others come from partisan outfits. Last, and most importantly, some are less timely than others. A poll’s usefulness for predicting the winner decays rapidly with the passage of time.
Nonetheless, when doing empirical analyses, data of any kind or quality is always better than no data at all, so I employ a simple set of rules to separate the wheat from the chaff.
First, in countries such as the UK and Philippines, I analyze only national polls because national elections are decided by popular vote across the whole country. But for US data, considering how the Republican nomination process and the US Electoral College are designed to work, I completely disregard national US polls, and analyze only polls taken at the state and territorial levels. Unless no other polling data is available, I also disregard any poll taken over a period exceeding one week, or which is not documented to have been designed and taken according to standard opinion polling practices, or for which the polling dates, sample size, margin of error and confidence level are not disclosed.
Second, because polls are merely snapshots of an electorate at specific moments in time, for any given election I only use the most recent poll, after combining all the polls taken on the same day by weighting their frequencies according to sample size. To determine when a poll was taken, I use the last date it was conducted in the field and not the date it was released.
The US general election, and other national elections, are held on the same day so I prefer to wait until a few days before each election before gathering any data. However the US Republican nominating process is a sequence of 56 separate statewide or territorial elections, caucuses or conventions held over a period lasting just over four months. It is therefore necessary to refresh the analysis nearly every week, as late as possible before the next scheduled events, using previously-bound delegate counts together with the latest polling data.
Model Building
To turn poll results into election predictions, you need models. A model is simply an algorithm for converting the frequency distribution of the latest poll into a projection which takes all working hypotheses and applicable decision rules into consideration.
Modeling a national election decided by popular vote is quite straightforward. The poll’s reported frequency distribution is adjusted, if required, according to the working hypotheses. The candidate or proposition preferred by the greatest adjusted number (or percentage) of respondents is deemed the winner.
For example, the final compilation of polls available on the eve of the Brexit referendum reported that the percentage of respondents who preferred to leave the EU was exactly the same as the percentage of respondents who preferred to remain. A smaller percentage of respondents was undecided. According to the working hypothesis, the number of respondents who claim to be undecided but actually prefer to leave exceeds the number of respondents who claim to be undecided but actually prefer to remain. Because any possible adjustment conforming to the working hypothesis would break the tie in favor of respondents who preferred to leave, I predicted that the UK would choose to leave the EU.
Modeling Republican primary contests is much more complicated. Each state or territory sends its prescribed number of delegates to the national nominating convention. Most of those delegates are bound to vote for a specific candidate, at least during the initial balloting round, but the rules for binding those delegates vary widely based on proportional, winner-takes-all and other voting systems.
32 of the 56 states and territories bind their delegates proportionally according to each candidate’s share of the vote in a primary election, convention or local caucuses. Candidates may also need to exceed a minimum threshold before earning any delegates. The outcome is decided exclusively at the state or territorial level in some of these states and territories, while in the others outcomes are decided separately for each congressional district and, for some, at the state level also to bind their at-large delegates.
To illustrate, New York has 95 delegates comprising three delegates from each of its 27 congressional districts, plus 14 at-large delegates. It holds an April primary election to bind the delegates from each of its congressional districts proportionally, and uses the statewide popular vote to proportionally bind the at-large delegates. At both the congressional district and state levels, candidates must receive at least 20 percent of the popular vote and, at both levels also, a candidate who receives more than 50 percent of the popular vote wins all delegates. Finally, if at least two candidates receive 20 percent or more of the vote, the candidate with the most votes receives two delegates and the candidate with the second most votes receives one.
18 other states and territories use the winner-takes-all system which binds all delegates to the single candidate who received the largest number of popular votes in a primary election or local caucuses. Just as for states and territories using the proportional voting system, outcomes are decided either at the state or territorial level, by congressional district or at both levels.
California, for instance, has 172 delegates comprising three delegates from each of its 52 congressional districts, plus 13 at-large delegates. It holds a June primary election to bind the delegates from each of its congressional districts on a winner-takes-all basis, and uses the statewide popular vote to bind the at-large delegates, again on a winner-takes-all basis. Florida, on the other hand, holds a March primary election to bind all of its 99 delegates on statewide winner-takes-all basis.
West Virginia Republicans, uniquely, hold a primary election in which its 34 delegates are elected directly. Only the delegates’ names appear on the ballot.
Lastly, 5 states and territories don’t bind their delegates at all, nor do they hold primary elections. Instead they select their delegates at local caucuses or state nominating conventions.
Given the voting system differences and wide disparities between the rules, my basic approach is to model each state or territory separately. This allows me to take as many local variations into account as possible. Inevitably, though, compromises must be struck to deal with missing data and other uncertainties.
Although polling data is available for most states and territories, very little is available for individual congressional districts. In 2016, data were published only for congressional districts in New York and California. Accordingly, I modeled New York and California at both the state and congressional district levels, but elsewhere only at the state or territorial level which effectively employs statewide or territorial poll results as proxies for congressional districts.
Finally, for West Virginia as well as other states and territories whose delegates are unbound, I could only use statewide or territorial poll results as proxies to predict the outcomes of their primary elections, conventions or local caucuses.
To arrive at predictions for the Republican nomination, I saw no need to apply any supplemental working hypotheses. Instead, I used the unadjusted frequency distributions reported for the polls most recently taken in each state or territory, and then applied the relevant state or territorial model to project the number of delegates bound to each candidate in each state or territory. I summed these projections by candidate, and then added the actual number of delegates already bound to each candidate, to arrive at the national projection. The candidate projected to enter the national convention with at least 1,237 bound delegates (half the total of national convention delegates plus one) was deemed the eventual winner.
Incidentally, if no candidate was projected to enter the convention with at least 1,237 bound delegates, I made no attempt to model or project the eventual winner. In other words, I didn’t try to predict who would win the nomination on the second or subsequent rounds of balloting.
As mentioned earlier, I refreshed these projections nearly every week during the Republican primary season to reflect the actual outcomes of previous primary elections, conventions and local caucuses, and to incorporate the most recent polling data available.
Turning finally to modeling the US general election, under the Electoral College system each state, along with the District of Columbia, has a prescribed number of electors. All but two states use a winner-takes-all system which binds those electors to the single candidate who received the greatest number of popular votes. The exceptions are Maine and Nebraska, where each congressional district has one elector who is bound to the candidate receiving the greatest number of popular votes in that district. The remaining two electors from each of those states are bound to the candidate receiving the largest number of votes statewide, on a winner-takes-all basis. However, due again to the lack of polling data for individual congressional district in these states, I modeled Maine and Nebraska only at the state level, thus effectively employing statewide poll results as proxies for congressional districts.
To predict the outcome of the US general election, I applied alternate versions of the supplemental working hypothesis described earlier to the unadjusted frequency distributions reported for the polls most recently taken in each state.
The first alternate relied strictly on the actual outcome of the Brexit referendum. There, seven out of every ten presumably undecided voters ultimately chose to leave. So, I adjusted each state’s frequency distribution by allocating 70 percent of the undecided percentage to Trump, and the remainder to Clinton.
The second alternate moderates the actual Brexit referendum outcome as suggested by one of my confidantes. It assumes that half the undecided voters do not vote, and 70 percent of those who do vote for Trump. I adjusted each state’s frequency distribution by allocating 35 percent of the undecided percentage to Trump (that is, half the number of presumably undecided Brexit referendum voters who ultimately chose to leave), and 15 percent (remainder of those who presumably voted) to Clinton.
I then applied the statewide winner-takes-all model to project the number of electors bound to each candidate from each state. I summed these projections by candidate to arrive at the national projection. The candidate projected to win at least 270 bound electors (half the total of Electoral College votes plus one) was deemed the winner.
Rigorous Application of Data to the Models
All the races I predicted were hotly contested. Above and beyond civilized advertising, policy briefings, campaign rallies, speeches and debates, partisans of every stripe blasted falsehoods, negative attacks, dirty tricks, leaks, and endless spin through every available mass media and social media channel in their attempts to reinforce or change what voters were thinking.
Underlying this noise were the inevitable disruptions arising from transformational change. Although Switzerland’s Parliament voted, in March 2016, to retract its application to join the EU, and both Greenland and Algeria chose to leave the EU’s predecessors long ago, until the Brexit referendum no EU member state had ever exercised its right to withdraw under the current Treaty on European Union (TEU) Article 50. The withdrawal of the UK, which is the EU’s second-largest economy, is a transformational change for Europe which, according to many commentators, is likely to create serious repercussions and might be an existential threat to the EU itself.
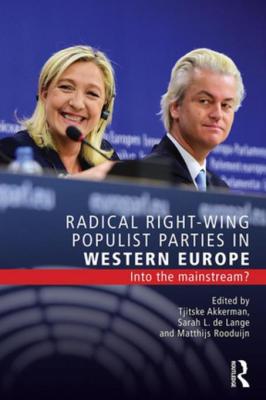
The rise of populism, and “renewal of isolationist policies in some locales, which would effectively reverse the economic liberalization and globalization trends of recent years” as I warned back in 1999, are symptoms of even broader transformational change that in the worst case harkens back to the dark days preceding World War II. Donald Trump, Nigel Farage and Rodrigo Duterte are by no means the only populists ascending to the worldwide political stage today. Others include Norbert Hofer (Austria), Marine Le Pen (France), André Poggenburg (Germany), Pawel Kukiz (Poland), Marian Kotleba (Slovakia), Recep Tayyip Erdoğan (Turkey) and Nicolás Maduro as well as his predecessor Hugo Chávez (Venezuela). Narendra Modi became India’s Prime Minister on a populist platform, although he recently stated that he is avoiding a “populist course.” In Thailand, the populist politician Thaksin Shinawatra rose to power democratically, and so did his sister, Yingluck, after Thaksin was deposed in a 2006 military coup. And Italy’s conservative populist Silvio Berlusconi first took power in 1994, though he is no longer Prime Minister.
Increasingly, these developments are rendering conventional political wisdom obsolete. The old-school ways, which rely upon centrist voters to nominate and elect mainstream candidates who lean either left or right, are becoming increasingly irrelevant. The advice of pols who cut their political teeth before the mid-nineties can no longer be counted upon to reliably predict the future.
Which is to say, to predict elections correctly in this day and age, it’s vital to filter out as much partisan noise and conventional wisdom as possible, and trust both the data and the models to speak for themselves. For me, time and time again, this meant resisting the temptation to fiddle with my projections based on what television, the Internet and even my confidantes were saying.
As mentioned earlier, during the Republican primary season I refreshed my projections nearly every week to reflect the actual outcomes as they occurred, remove candidates as they dropped out of the race, and incorporate the most recent polling data available. I began my first analysis on March 3rd, 2016, just after the “Super Tuesday” primaries, and it projected Trump would come up 87 delegates short. After that, every one of my subsequent analyses indicated Trump would win, except the one I published on March 25th, 2016, just after the Utah caucuses and the Arizona primary, when I projected he would fall 9 delegates short. My final analysis, on April 29th, 2016, projected Trump would enter the convention with 86 more delegates than he needed. The following Tuesday, Trump performed significantly better than my final projection, sweeping all of Indiana’s 57 delegates, and his main opponent Ted Cruz dropped out. It was game over.
The Philippine Presidential election was scheduled to take place the next week, on Monday, May 9th, 2016. I didn’t pay much attention until I spotted news reports labeling Duterte the “Trump of the East.”
Duterte had led every one of the 19 polls taken after March 25th, 2016, except three. Grace Poe, an independent businessperson, consistently placed second but never within the statistical margin of error. Curiously, another candidate, Mar Roxas, was tied with Poe in the first and led the second two of the three polls putting Duterte second or third. The last of those polls, which showed Roxas surging to a five-point lead, was also the final poll to be conducted before the election. Its immediate predecessor, conducted two days earlier by a highly-regarded polling organization, had shown Duterte leading Poe by 11 and Roxas by 13 points.
Shifts of that magnitude over such a short period of time always look suspicious to me. I started digging. It didn’t take long to discover that the organization which released the three polls showing Duterte second or third had never published any other polls, and the first of those three polls had been conducted merely three weeks before the election. I also learned that Roxas and his Liberal party were favored by outgoing Philippines President, Benigno Aquino III, himself a Liberal.
This was all the evidence I needed to disregard the final Philippines poll, and substitute its immediate predecessor. Seeing no need to apply any supplemental working hypotheses, I projected Duterte to win by 11 points. He actually won by 15.6 points over Roxas, and 17.6 points over Poe.
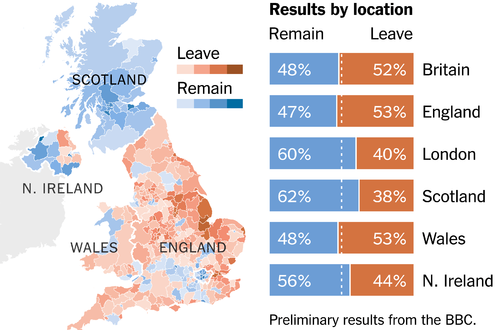
Next up was the Brexit referendum scheduled for June 23rd, 2016. I hadn’t initially planned to predict the outcome, but a lengthy conversation with my British confidante motivated me to give it a try. Using the working hypotheses, data and models I’ve already described, it took almost no time to predict that UK voters would choose to leave the EU. I shared my prediction with two confidantes in Singapore and sat back to watch the result, which ended up looking like this:
I began to analyze the US general election only on Sunday, November 6th, 2016. To save time, I quickly narrowed the scope of my analysis to 18 battleground states. These were Arizona, Colorado, Florida, Georgia, Iowa, Maine, Michigan, Minnesota, Missouri, Nevada, New Hampshire, New Mexico, North Carolina, Ohio, Pennsylvania, Utah, Virginia and Wisconsin. Victory appeared all but assured for Trump or Clinton in the remaining 32 states, as well as the District of Columbia, so I allocated their electoral votes as all key media outlets were unanimously projecting.
The latest available polls covering 13 of the 18 battleground states were conducted on November 6th, 2016, so most of the data was very recent. Altogether, I relied upon 31 polls from 16 different polling organizations. Notably, the oldest poll was conducted on October 25th, 2016, covering Minnesota. It showed Clinton with a 10 point lead. As it turned out, Clinton won Minnesota by only 1.4 points.
The latest polls, before any adjustments, pointed to a Clinton victory with 277 electoral votes versus 261 for Trump.
After adjusting the poll frequencies according to both the first and second alternate supplemental working hypotheses, the Electoral College model projected Trump the winner. So, I published my final prediction that Trump would win the US Presidency with 276 electoral votes versus 262 for Clinton.
U.S. Presidential Election Prediction by Nelson Nones
As at this writing, Michigan’s unofficial results show that Trump finished ahead of Clinton by just 13,107 votes in Michigan (0.3 points) but major news organizations, including the Associated Press (AP), have not yet called the race. If Trump’s current lead holds in Michigan, he will receive 306 electoral votes and Clinton will receive 232. Otherwise Trump will receive 290 electoral votes and Clinton will receive 248.
It’s perhaps premature to judge my forecast accuracy because Michigan still hasn’t been called. But if Michigan holds for Trump, my performance looks like this:
On a geographic basis, I have correctly predicted 50 of 55 (91 percent). The total includes 50 states, plus the District of Columbia, plus the four congressional districts in Maine and Nebraska.
On an electoral vote basis using either of the supplemental working hypotheses, I have correctly predicted 478 of 538 (89 percent).
In terms of the actual outcome, my prediction was 100 percent accurate.
I’ve also compared the latest polls as well as my projected winning margins against the actuals reported so far. The average statistical margin of error among the 31 polls within the scope of my final US general election analysis was 3.3 percent. So far, their average actual error is 4.2 percent with a 2 percent standard deviation, and the actual polling error exceeded the statistical margin of error in half the states I analyzed. Meanwhile, for either of the supplemental working hypotheses, the average actual error for my projected winning margins is 3.0 percent with a 0.5 percent standard deviation.
These performance measures tell me that none of my working hypotheses are likely to be disproven by the actual outcomes. Indeed, had I not framed them, and relied solely upon the latest available polls instead, I doubt that I would have correctly predicted any of these events except the Philippines Presidential election.
Conclusion
My method boiled down to framing hypotheses, adjusting the latest available polls according to my working hypotheses, if any, and running the adjusted data through deterministic models of voting systems and rules to project the winners. Along the way, especially during the Republican primary season, I discovered and corrected numerous errors of my own making. I am indebted to my confidantes for their information and critiques, and also for pointing out important details such as specific delegate allocation rules I’d overlooked. As such, my endeavors were error-prone at times and remained a constant work in process throughout.
In truth, along the way I judged my approach to be quite primitive. I didn’t (and couldn’t, from halfway round the world) consider the myriad soft factors or nuances that other prominent forecasters, with seemingly vast resources at their disposal, appeared to be incorporating into probabilistic models which seem far more elegant than mine.
But in the end, it’s the degree of objectivity combined with diligent work that really counts. And I can truthfully say that I did my best to leave my personal preferences outside the door, trust my cumulative experience and first-hand observations, incorporate my previous research, maintain a balanced point of view, and ultimately let the data points themselves guide me to my conclusions.
The political environment in the United States and Europe has been an endless source of fascination this year — and of course it’s been influenced by a myriad of factors.
To try to make sense of it all, how much of what is happening is due to new challenges to the social order … and how much is due to changes in economic well-being in an era of globalization?
My brother, Nelson Nones, has lived and worked outside the United States for the past two decades. His business is based in East Asia, and much of his work is done in Europe as well as in Asia and North America. I find his perspectives quite interesting and often different from the “conventional wisdom” heard here at home, because Nelson’s is truly a worldview borne of first-hand experience and observations across many regions.
I asked Nelson to share his thoughts on how globalization has affected the average person — hopefully looking beyond “perceptions” and other qualitative factors and instead focusing on hard metrics. Nelson’s analysis is insightful — and surprising in some respects. Here is what he reported:
The “Era of Globalization” covers the last quarter-century, beginning with the fall of Communism and continuing to the present day. It began with the opening of national economies which were previously barred from global trade and migration – the former Soviet Union, Mainland China, India, Brazil and others.
Major economic blocs also emerged to liberalize free trade and migration, most notably the Euro Area but also NAFTA in North America, and ASEAN in Southeast Asia.
In five of the world’s eight major regions, economic well-being has trended quite consistently during this time.
In North America (the United States, Mexico and Canada) and the Euro Area, economic well-being initially grew but peaked between 1999 (North America) and 2001 (Euro Area), and has declined ever since. North America’s well-being has fallen 22% since its peak; the Euro Area’s has fallen 20%.
By contrast, economic well-being in the East Asia and Pacific as well as South Asia regions has grown steadily. It has risen by 74% over the past quarter century in the East Asia and Pacific region, and by 68% in the South Asia region.
Economic well-being in Central Europe and the Baltics has also risen steadily after 1992, up 45% within the past 23 years.
In the remaining three regions, trends in economic well-being have been less consistent. The MiddleEast and North Africa declined steadily after its 2009 peak; down 7% during the last six years, and down 10% over the entire 25-year period.
The Latin America and Caribbean region peaked in 1994, and is down 15% over the past 21 years.
Bringing up the rear is the Sub-Saharan Africa region, which is down 20% over 25 years, although economic well-being grew marginally during nine of those 25 years.
Interestingly, the trend in economic well-being has been least consistent in the Russian Federation. It fell 49% between 1990 and 1998, rose 118% between 1999 and 2008, and then fell 5% during the last seven years. Overall, economic well-being in the Russian Federation rose 7% over the last 25 years.
Here’s a graphical representation of the trends noted above:
In very broad terms, what do these trends tell me?
The hands-down winners during the Era of Globalization have been the East Asia and Pacific (including China, Japan, Korea, Southeast Asia, Australia and New Zealand), Central Europe and the Baltics, and South Asia (primarily India) regions.
Not surprisingly, these regions (despite a few exceptions, like Pakistan) are generally peaceful and orderly today, abetted by the rule of authoritarian governments in many countries.
Although they profited during the first decade or so, the biggest losers during the Era of Globalization have been the North America and Euro Area regions.
One could reasonably argue that the UK’s recent Brexit vote, rising far-right sentiments in Western Europe and the popularity of Donald Trump and Bernie Sanders in the current U.S. Presidential election cycle are all recent symptoms of this underlying trend.
One could just as reasonably argue that the oil curse, authoritarianism, widespread unemployment (or underemployment), the rise of radical Islam, war and terrorism are symptoms of the persistent declines in economic well-being throughout the Middle East and North Africa during the Era of Globalization.
Nevertheless, the Sub-Saharan Africa as well as Latin America and Caribbean regions have underperformed even the Middle East and North Africa region during the Era of Globalization. Might these regions become hotbeds of significant unrest in the not-too-distant future?
Looking at things from this perspective, it becomes easier to understand the “pressure points” we’re witnessing in the political environment in the United States and Europe. I didn’t realize the degree to which North America and the Euro Area were “the biggest losers” over the past quarter century. Seeing it spelled out like this, perhaps we can have a little more empathy for the people who feel dissatisfied and who are looking for change.
How easily that change can occur — and whether it will turn out to be a net benefit — well, those are entirely different questions!
__________________
In brief, the methodology behind the analysis is as follows:
1. Data source is the World Bank World Development Indicators database, last updated 19th July 2016.
2. Raw data is gross domestic product (GDP) per capita per year, in constant International Dollars, adjusted for purchase price parity (PPP). Use of constant International Dollars strips out the effects of inflation or deflation. The PPP adjustment accounts for differences in the cost of living within each region; GDP is adjusted down for regions having higher-than-average living costs, while GDP is adjusted up for regions having lower-than-average living costs.
3. The index for each region and year is calculated as the regional GDP at PPP, divided by worldwide GDP at PPP.
4. The graph pictured above depicts the natural logarithms of the calculated indexes for each region and year. Hence worldwide GDP at PPP is zero (0); GDP at PPP values lower than the worldwide average are negative, while GDP at PPP values higher than worldwide average are positive.
There’s no question that Apple’s refusal to help the FBI gain access to data in one of the iPhones used during the San Bernardino massacre has been getting scads of coverage in the news and business press.
Apple’s concerns, eloquently stated by CEO Tim Cook, are understandable. From the company’s point of view, it is at risk of giving up a significant selling feature of the iPhone to enable a “back door” access to encrypted data.. Apple’s contention is that many people have purchased the latest models of iPhones for precisely the purpose of protecting their data from prying eyes.
On the other hand, the U.S. government’s duty is to protect the American public from terrorist activities.
Passions are strong — and they’re lining up along some predictable social and political fault lines. After having read more than a dozen news articles in the various news and business media over the past week or so, I decided to check in with my brother, Nelson Nones, for an outsider’s perspective.
As someone who has lived and worked outside the United States for decades, Nelson’s perspectives are invariably interesting because they’re formed from the vantage point of “distance.”
Furthermore, Nelson has held very strongly negative views about the efforts of the NSA and other government entities to monitor computer and cellphone records. I’ve given voice to his perspectives on this topic on the Nones Notes blog several times, such as here and here.
So when I asked Nelson to share his perspectives on the Apple/FBI, I was prepared for him to weigh in on the side of Apple.
Well … not so fast. Shown below what he wrote to me:
______________________
This may come as a surprise, but I’m siding with the government on this one. Why? Three reasons:
Point #1: The device in question is (and was) owned by San Bernardino County, a government entity.
The Fourth Amendment of the U.S. Constitution provides, “The right of the people to be secure in their persons, houses, papers, and effects, against unreasonable searches and seizures, shall not be violated …”
The investigation that the FBI wants to conduct could either be thought of as a seizure of property (the iPhone), or as a search (accessing the iPhone’s contents). Either way, Fourth Amendment protections do not apply in this case.
Within the context of the Fourth Amendment, seizure of property means interfering with an individual’s possessory interests in the property. In this case, the property isn’t (and never was) owned by an individual; it is public property. Because Farook, an individual, never had a possessory interest in the property, no “unreasonable seizure” can possibly occur.
Also, within the meaning of the Fourth Amendment, an “unreasonable search” occurs when the government violates an individual’s reasonable expectation of privacy. In this case the iPhone was issued to Farook by his employer. It is well known and understood through legal precedent that employees have no reasonable expectation of privacy when using employer-furnished equipment. For example, employers can and do routinely monitor the contents of the email accounts they establish for their employees.
Point #2: The person who is the subject of the investigation (Syed Farook) is deceased.
According to Paul J. Stablein, a U.S. criminal defense attorney, “Unlike the concept of privilege (like communications between doctor and patient or lawyer and client), the privacy expectations afforded persons under the Fourth Amendment do not extend past the death of the person who possessed the privacy right.”
So, even if the iPhone belonged to Farook, no reasonable expectation of privacy exists today because Farook is no longer alive.
Point #3: An abundance of probable cause exists to issue a warrant.
In addition to protecting people against unreasonable searches and seizures, the Fourth Amendment also states, “… no warrants shall issue, but upon probable cause, supported by oath or affirmation, and particularly describing the place to be searched, and the persons or things to be seized.”
I strongly believe the U.S. National Security Agency’s mass surveillance was unconstitutional and therefore illegal, due to the impossibility of establishing probable cause for indiscriminately searching the records of any U.S. citizen who might have placed or received a telephone call, sent or received an email message or logged on to their Facebook account.
That’s because these acts do not, in and of themselves, provide any reasonable basis for believing that evidence of a crime exists.
I also strongly believe that U.S. citizens have the right to encrypt their communications. No law exists preventing them from doing so for legal purposes. Conducting indiscriminate searches through warrantless “back door” decryption would be just as unconstitutional and illegal as mass surveillance.
In this case, however, multiple witnesses watched Farook and his wife, Tashfeen Malik, open fire on a holiday party, killing 14 people, and then flee after leaving behind three pipe bombs apparently meant to detonate remotely when first responders arrived on the scene.
Additional witnesses include the 23 police offers involved in the shootout where Farook and Malik eventually were killed.
These witnesses have surely given sworn statements attesting to the perpetrators’ crimes.
It is eminently reasonable to believe that evidence of these crimes exists in the iPhone issued to Farook. So, in this case there can be no doubt that all the requirements for issuing a warrant have been met.
For these three reasons, unlike mass surveillance or the possibility of warrantless “back door” decryption, the law of the land sits squarely and undeniably on the FBI’s side.
Apple’s objections.
Apple’s objections, seconded by Edward Snowden, rest on the notion that it’s “too dangerous” to assist the FBI in this case, because the technology Apple would be forced to develop cannot be kept secret.
“Once [this] information is known, or a way to bypass the code is revealed, [iPhone] encryption can be defeated by anyone with that knowledge,” says Tim Cook, Apple’s CEO. Presumably this could include overreaching government agencies, like the National Security Agency, or criminals and repressive foreign regimes.
It is important to note that Apple has not been ordered to invent a “back door” that decrypts the iPhone’s contents. Instead, the FBI wants to unlock the phone quickly by brute force; that is, by automating the entry of different passcode guesses until they discover the passcode that works.
To do this successfully, it’s necessary to bypass two specific iPhone security features. The first renders brute force automation impractical by progressively increasing the minimum time allowed between entries. The second automatically destroys all of the iPhone’s contents after the maximum allowable number of consecutive incorrect guesses is reached.
Because the iPhone’s operating system must be digitally signed by Apple, only Apple can install the modifications needed to defeat these features.
It’s also important to note that Magistrate Judge Sheri Pym’s order says Apple’s modifications for Farook’s iPhone should have a “unique identifier” so the technology can’t be used to unlock other iPhones.
This past week, Apple has filed a motion to overturn Magistrate Judge Pym’s order. In its motion, the company offers a number of interesting arguments, three of which stand out:
Contention #1: The “unreasonable burden” argument.
Apple argues that complying with Magistrate Judge Pym’s order is unreasonably burdensome because the company would have to allocate between six and ten of its employees, nearly full-time over a 2 to 4 week period, together with additional quality assurance, testing and documentation effort. Apple also argues that being forced to comply in this case sets a precedent for similar orders in the future which would become an “enormously intrusive burden.”
Contention #2: Contesting the phone search requirement.
Apple isn’t contesting whether or not the FBI can lawfully seize and search the iPhone. Instead it is contesting Magistrate Judge Pym’s order compelling Apple to assist the FBI in performing the search. As such, Apple is an “innocent third party.” According to Apple, the FBI is relying on a case, United States v. New York Telephone, that went all the way to the Supreme Court in 1977. Ultimately, New York Telephone was ordered to assist the government by installing a “pen register,” which is a simple device for monitoring the phone numbers placed from a specific phone line.
The government argued that it needed the phone company’s assistance to execute a lawful warrant without tipping off the suspects. The Supreme Court found that complying with this order was not overly burdensome because the phone company routinely used pen registers in its own internal operations, and because it is a highly regulated public utility with a duty to serve the public. In essence, Apple is arguing that United States v. New York Telephone does not apply, because (unlike the phone company’s prior use of pen registers) it is being compelled to do something it has never undertaken before, and also because it is not a public utility with a duty to serve.
Contention #3: The requirement to write new software.
Lastly, Apple argues that it will have to write new software in order to comply with Magistrate Judge Pym’s order. However, according to Apple, “Under well-settled law, computer code is treated as speech within the meaning of the First Amendment,” so complying with the order amounts to “compelled speech” that the Constitution prohibits.
What do I think of Apple’s arguments?
Regarding the first of the them, based on its own estimates of the effort involved, I’m guessing that Apple wouldn’t incur more than half a million dollars of direct expense to comply with this order. How burdensome is that to a company that just reported annual revenues of nearly $234 billion, and over $53 billion of profit?
Answer: To Apple, half a million dollars over a four-week period is equivalent to 0.01% of last year’s profitability over an equivalent time span. If the government compensates Apple for its trouble, I don’t see how Apple can win this argument.
Regarding the other two arguments above, as Orin Kerr states in his Washington Post blog, “I don’t know which side would win … the scope of authority under the [All Writs Act] is very unclear as applied to the Apple case. This case is like a crazy-hard law school exam hypothetical in which a professor gives students an unanswerable problem just to see how they do.”
My take: There’s no way a magistrate judge can decide this. If Apple loses, and appeals, this case will eventually end up at the Supreme Court.
What if the back door is forced open?
The concerns of privacy advocates are understandable. Even though I’m convinced the FBI’s legal position is solid, I also believe there is a very real risk that Apple’s modifications, once made, could leak into the wrong hands. But what happens if they do?
First, unlike warrantless “back door” decryption, this technique would work only for iPhones — and it also requires physical possession of a specifically targeted iPhone.
In other words, government agencies and criminals would have to lawfully seize or unlawfully steal an iPhone before they could use such techniques to break in. This is a far cry from past mass surveillance practices conducted in secret.
Moreover, if an iPhone is ever seized or stolen, it is possible to destroy its contents remotely, as soon as its owner realizes it’s gone, before anyone has the time to break in.
Second, Apple might actually find a market for the technology it is being compelled to create. Employers who issue iPhones to their employees certainly have the right to monitor employees’ use of the equipment. Indeed, they might already have a “duty of care” to prevent their employees from using employer-issued iPhones for illegal or unethical purposes, which they cannot fulfill because of the iPhone’s security features.
Failure to exercise a duty of care creates operational as well as reputational risks, which employers could mitigate by issuing a new variety of “enterprise class” iPhones that they can readily unlock using these techniques.
____________________
So that’s one person’s considered opinion … but we’d be foolish to expect universal agreement on the Apple/FBI tussle. If you have particular views pro or con Apple’s position, please join the discussion and share them with other readers here.
It’s only natural for Americans to be somewhat spooked about what’s happening in the financial markets, what with thousand-point drops on the stock exchanges and all.
It’s even more disconcerting to realize that the forces in play are ones that have little to do with the American economy and a lot more to do with Europe and China. (China in particular, where bubbles seem to be bursting all over the place with the fallout being felt everywhere else.)
In times like this, I seek out the thoughts and perspectives of my brother, Nelson Nones, an IT specialist and business owner who has lived and worked outside the United States for nearly 20 years — much of that time spend in the Far East.
To me, Nelson’s thoughts on world economic matters are always worth hearing because he has the benefit of weighing issues from a global perspective instead of simply a more parochial one (like mine).
Nelson Nones
Yesterday, I had the opportunity to ask Nelson a few questions about what’s happening in the Chinese economy, how it is affecting the U.S. economy, and what he sees coming down the road. Here are his perspectives:
PLN: What is your view of the Chinese economy — and what does the future portend?
NMN: I’m a real pessimist when it comes to the current state of the Chinese economy. I also think the Chinese will turn on themselves politically as their economic house of cards is collapsing — so look for a sharp upturn in political and social turmoil as well.
Just as the bubble burst in the U.S. and Europe in 2007-08, it’s bursting now in China — and the rest of East Asia (South Korea, Japan, Thailand and Singapore) are going to get caught in the fallout because of the extent to which their economies are reliant on trade with China.
PLN: What do you look at, specifically, for clues as to future economic movements?
NMN: The barometer to watch is the price of oil. It plummeted in 2007, presaging the “great recession” in the West.
Oil prices began to drop again in 2014. The U.S. oil benchmark fell below $40 per barrel on August 24, 2015, a level not seen since 2009. I believe the underlying root cause is a sharp contraction of East Asian demand due to the economic bubbles bursting over here, coupled with persistently high supply as Middle Eastern oil exporters compete against American producers to protect market share.
PLN: How will these developments affect the U.S. economy?
NMN: The oil bust will continue in the U.S., dragging the economy down. But energy prices will be lower, buoying other parts of the American economy. For instance, the domestic airline sector will benefit and consequential demand for Boeing jets will grow.
U.S. imports — specifically, imports from China and the rest of East Asia — will become cheaper as China and other countries allow their currencies to fall in order to protect their exports.
This is probably a “net-neutral” for the US economy in that American exports will be hurt due to the relatively stronger U.S. Dollar, but American consumers will benefit from lower prices. So, the direct economic impact is likely to be mixed.
PLN: So, why worry?
NMN: The real risk, in my opinion, is a global liquidity crisis. Over the past quarter-century, China and other East Asian countries have accrued enormous wealth. But they didn’t hoard their newfound wealth; they invested it both domestically and overseas.
China has invested ginormous amounts of cash in domestic infrastructure and housing. That money is already spent, and a sizeable part of the investment has already gone to waste in the form of corruption, new housing that nobody wants, underutilized transport infrastructure and non-performing loans made to inefficient state-owned enterprises.
All of this will eventually need to be written off (that’s why their bubble is bursting).
But China has also invested lots of money in overseas financial instruments. Think of the Chinese as the folks who financed the Federal Reserve’s Quantitative Easing program as well as Federal debt in the U.S. But as the Chinese run out of cash at home, they will increasingly need to liquidate their overseas investments just to pay their bills.
This poses a very real threat to the fiscal stability of U.S. and European governments, and to the supply of capital in U.S. and European financial markets.
The Federal Reserve is likely to be caught in a double-bind. On the one hand, if the Fed raises interest rates in response to the reduced supply of capital (as it is widely assumed they will, later this year), they risk choking off the tepid U.S. recovery currently underway.
This would also cause the U.S. Dollar to strengthen further, thereby exacerbating the negative impact of the Chinese bust by making U.S. exports less competitive in global markets.
On the other hand, if the Fed leaves interest rates where they are (basically zero), then they won’t be able to attract enough capital to roll over the public debt that the Chinese are trying to liquidate. In other words, the Fed risks a “run on the bank.”
The Fed can deal with this by printing more money (more or less what the Chinese did in 2007-8), but this would inevitably introduce inflationary pressures in the U.S. It would also lengthen the time it takes for the Chinese to right their ship, because it will put downward pressure on the U.S. Dollar, thereby constraining whatever the East Asians can do to boost exports.
My guess is that the Federal Reserve will “blink” and keep interest rates at zero (and also print more money to pay off the Chinese) in hopes that (somewhat) cheaper imports will offset (some of) the inflationary impact of printing more money.
This is equivalent to kicking the can down the road.
PLN: Do you see any impact on the 2016 Presidential race in the United States?
NMN: As a result of kicking the can down the road, I foresee little impact on the 2016 U.S. Presidential race — but watch out in 2020 when the hangover is well underway.
Alternatively if the Fed raises interest rates, I suspect the Democratic Party candidate will be more vulnerable because the short-term economic pain will be much higher in the U.S. The incumbent party will get most of the blame. Fair or not, that’s just the way bread-and-butter issues play out in American politics.
PLN: What about unrest in China — might that have political repercussions in America?
NMN: The way I see it, political or social turmoil in China will have zero impact on the U.S. Presidential race. Americans of nearly every political stripe or ideology dislike or distrust Chinese governance, yet unlike the “China lobby” of the Cold War era, they have no appetite to intervene in what they rightly perceive to be internal Chinese affairs.
Or they’re clueless about events in East Asia. Or they just don’t care.
So there you have it — a view from the Far East. If you have other perspectives, please share them with our readers here.
______________
Update (8/28/15): A few days after this post was uploaded, I received this follow-up from Nelson:
Just as I had predicted, check out this link. Federal debt is getting more expensive to finance, because the drop in demand for U.S. Treasury bonds (caused by the Chinese liquidation apparently underway) is driving yields up. According to the article, “The liquidation of such a large position, if it continues, could wreak havoc on the Treasuries market.”
Now look here: http://www.bloombergview.com/quicktake/federal-reserve-quantitative-easing-tape. It’s an easily understandable explanation of how the Federal Reserve’s quantitative easing (QE) program worked. Essentially the Fed, like China, stepped in to buy Treasuries also. The Fed also bought mortgage-backed securities.
The Fed’s purchases of Treasuries and mortgage-backed securities now make up ~85% of the Fed’s assets. The Fed hasn’t indicated what it will do when these assets mature, but if it doesn’t roll over this debt (or a portion thereof) then we can expect Treasury yields to rise yet again. Even if the Fed decides to keep interest rates where they are, at near-zero, rising Treasury yields could bring on a liquidity crunch within the private sector as capital is increasingly drawn away from private investments (loans, corporate bonds and equities) to government-issued bonds paying higher yields with little risk.
Facing the Chinese liquidation, this is why I suspect the Fed will opt to roll over its holdings of Treasuries and mortgage-backed securities, and keep interest rates at near-zero, at least through the 2016 Presidential election cycle. The Bloomberg article cited above describes QE as an alternative to printing more money, but in the end it’s really the same thing.

 The blog post I published this past week about reports of recent price hikes and what this might portend for the future has sparked some interesting feedback and comments. Based on that feedback, it appears that feelings are mixed on whether we’re poised to be entering a period of prolonged inflation.