China-bashing is taking its toll.

Over the past year, Americans have been fed a fairly steady stream of news about the People’s Republic of China – and most of it hasn’t been particularly positive.

While Russia may get the more fevered news headlines because of the various political investigations happening in Washington, the current U.S. presidential administration hasn’t shied away from criticizing China on a range woes – trade policy in particular most recently, but also diverse other issues like alleged unfair technology transfer policies, plus the building of man-made islands in the South China Sea thereby bringing Chinese military power closer to other countries in the Pacific Rim.

The drumbeat of criticism could be expected to affect popular opinion about China – and that appears to be the case based on a just-published report from the Pew Research Center.

The Pew report is based on a survey of 1,500 American adults age 18 and over, conducted during the spring of 2018.  It’s a survey that’s been conducted annually since 2012 using the same set of questions (and going back annually to 2005 for a smaller group of the questions).

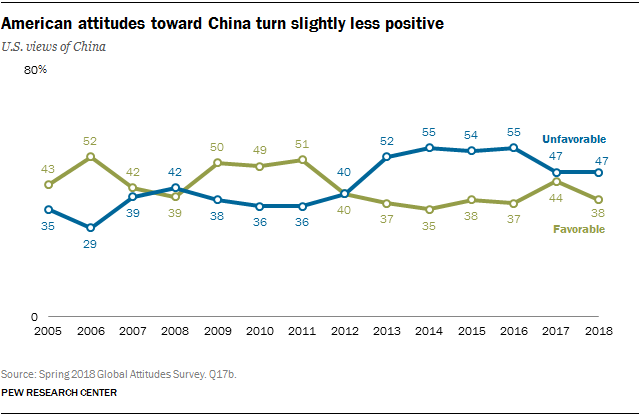
The newest study shows that the opinions Americans have about China have become somewhat less positive over the past year, after having nudged higher in 2017.

The topline finding is this: today, ~38% of Americans have a favorable opinion of China, which is a drop of six percentage points from Pew’s 2017 finding of ~44%.  We are now flirting with the same favorability levels that Pew was finding during the 2013-2016 period [see the chart above].

Drilling down further, the most significant concerns pertain to China’s economic competition, not its military strength. In addition to trade and tariff concerns, another area of growing concern is about the threat of cyber-attacks from China.

There are also the perennial concerns about the amount of U.S. debt held by China, as well as job losses to China; this has been a leading issue in the Pew surveys dating back to 2012. But even though debt levels remain a top concern, its raw score has fallen pretty dramatically over the past six years.

On the other hand, a substantial and growing percentage of Americans expresses worries about the impact of China’s growth on the quality of the global environment.

Interestingly, the proportion of Americans who consider China’s military prowess to be a bigger threat compared to an economic threat has dropped by a statistically significant seven percentage points over the past year – from 36% to 29%. Perhaps unsurprisingly, younger Americans age 18-29 are far less prone to have concerns over China’s purported saber-rattling – differing significantly from how senior-age respondents feel on this topic.

Taken as a group, eight issues presented by Pew Research in its survey revealed the following ranking of factors, based on whether respondents consider them to be “a serious problem for the United States”:

  • Large U.S. debt held by China: ~62% of respondents consider a “serious problem”
  • Cyber-attacks launched from China: ~57%
  • Loss of jobs to China: ~52%
  • China’s impact on the global environment: ~49%
  • Human rights issues:  ~49%
  • The U.S. trade deficit with China: ~46%
  • Chinese territorial disputes with neighboring countries: ~32%
  • Tensions between China and Taiwan: ~21%

Notice that the U.S. trade deficit isn’t near the top of the list … but Pew does find that it is rising as a concern.

If the current trajectory of tit-for-tat tariff impositions continues to occur, I suspect we’ll see the trade issue being viewed by the public as a more significant problem when Pew administers its next annual survey one year from now.

Furthermore, now that the United States has just concluded negotiations with Canada and Mexico on a “new NAFTA” agreement, coupled with recent trade agreements made with South Korea and the EU countries, it makes the administration’s target on China as “the last domino” just that much more significant.

More detailed findings from the Pew Research survey can be viewed here.

The latest newsroom employment stats aren’t pretty — and unfortunately not “fake” either.

For people who might be hoping for a turnaround in the news industry that could take us back to a world more like the one we once knew – you know, with actual journalists writing primary-sourced stories and conducting formal fact-checking – those days seem less likely than ever to return.

In late July, analytics firm MediaRadar reported on the latest stats for print advertising in the United States – and they’re continuing a long slide by falling another 13% between January and April of 2018.

Even worse:  Most of the companies that stopped their print advertising during the period didn’t migrate their ad dollars over to digital. Instead, they stopped advertising altogether.

This by now numbingly-familiar trend in advertising is directly related to the financial well-being of the news media, as advertising has traditionally bankrolled the lion’s share of newsroom activities.

But with revenues dropping relentlessly, it’s having an outsized impact on newsroom employment. The Pew Research Center has just released stats on the number of employees in American newsrooms – and those figures aren’t pretty, either.

According to Pew, in 2008 America’s newsrooms collectively had approximately 114,000 reporters, editors, photographers and camera personnel on staff. As of 2017, the number had plummeted to around 88,000.

That loss of ~27,000 people represents nearly 25% of all the newsroom jobs that were existed in newspaper, radio, TV/cable and other information services in 2008.

Not surprisingly, the biggest decline was experienced in the newspaper segment – down a whopping 45% to ~39,000 jobs. The digital-native sector was something of a bright spot, with job numbers increasing by nearly 80% over the same period to reach a level of ~13,000 jobs in 2017.

But digital news personnel growth hasn’t been nearly enough to make up for the job losses suffered by the other newsrooms.

What’s more, even digital newsroom jobs aren’t particularly secure, with frequent restructurings being the order of the day thanks to the unsettled nature of the industry as it attempts to adjust to ever-evolving news-consumption preferences.

How are news media organizations responding? Give them credit for trying all sorts of gambits – from membership programs to paid newsletters, premium news paywalls and in-house content studios.

But how many of those efforts have proven to be financially robust enough to shoulder the costs of running a “legitimate” newsroom?  Whatever the number, it hasn’t been sufficient, because whether we like it or not, most people have become conditioned to expect their news and information delivered free of charge.  And while many may lip service to favoring traditional journalistic practices, most aren’t willing to put up their own money to pay for it as part of the bargain.

Meanwhile, the hollowing out of traditionally structured newsrooms continues on, with no end in sight.  I wonder if there even are other financial or business models that could stop the hemorrhaging of jobs in newsrooms.

Does anyone have any other suggestions?

America’s “Always On” Dynamics

It’s natural to assume that these days, pretty much all Americans go online regularly. And indeed, that is the case.  According to a survey of ~2,000 Americans age 18 and older conducted recently by the Pew Research Center, more than three in four respondents (~77%) reported that they go online at least once each day.

Compare that to the far smaller cohort of people who don’t use the Internet at all, which is only around 10%.

But even more interesting perhaps is another finding from the Pew survey: More than one in four Americans (~26%) report that they are online “almost constantly”.

That proportion is up from one in five just a couple years ago.

Even for people who go online but don’t use a mobile device, nearly 55% report that they go online at least daily, although just 5% of them report being online continually.

Looking further into the Pew findings, the “always on” population is skewed younger … better educated … ethnically diverse … and with higher incomes:

Gender

  • Men: ~25%
  • Women: ~27%

Age

  • 18-29: ~39%
  • 30-49: ~36%
  • 50-64: ~17%
  • 65 or older: ~8%

Education Level

  • High school degree or less: ~20%
  • Some college: ~28%
  • College degree or more: ~34%

Race

  • Non-white: ~33%
  • White: ~23%

Income Level

  • Less than $30K annual income: ~24%
  • $30-$75K annual income: ~25%
  • $75K or higher annual income: ~35%

Location

  • Living in urban areas: ~32%
  • Living in suburban areas: ~27%
  • Living in rural areas: ~15%

Regarding location, one explanation for the lower “always on” characteristics of rural dwellers may be that interconnectivity isn’t as simple and easy as it is in urban environments.

Or perhaps it’s because rural areas offer more attractive options for people to spend their time doing more fulfilling things than being tethered to the online world 24/7/365 …

Which is it? Your thoughts on this or the other dynamics uncovered by Pew are welcomed.  You can also read more about the survey findings here.

Local TV news viewership continues to decline … even as stations ramp up their news coverage.

How’s this for an ironic twist: The Pew Research Center is reporting that the local TV newscasts if ABC, CBS, FOX and NBC affiliates across the United States are continuing to show viewership declines, even as stations are increasing the amount of the local news content they broadcast.

According to Pew, which analyzed Nielsen results for its report, “late” news (10 or 11 pm) suffered an 11% decline to 20.3 million viewers across the United States during 2016.

Early evening news (5 or 6 pm time slots) lost ~9% in viewership, dropping to 22.8 million viewers.

Morning news? It didn’t fare any better, falling a similar ~9% to just 10.8 million viewers.

But despite these continuing declines, there’s scant evidence that local station executives see local news as a losing proposition.

Instead, they appear to be doubling down on it, figuring that local news is one of the few remaining points of differentiation against online news sites that usually don’t provide very much in the way of in-depth local coverage.

Underscoring this, according to a survey conducted by the Radio-Television-Digital News Association and Hofstra University, local TV stations averaged 5.7 hours of news programming per weekday during 2016, which is up slightly from 5.5 hours in 2015.

Stats aside, one has to wonder how much longer local news can continue to be a differentiating factor for local TV stations? Those very same stations are creating their own competition by operating robust websites of their own.  And of course, many people have become quite adept at punching their own zip codes into weather apps to obtain “micro-local” weather information.

Sports? There are thousands of websites and apps available that provide fingertip results and stats down to the most minute level of detail.

Furthermore, as the older population “ages out,” the notion of sitting down at a prescribed hour every day to watch the news on television is likely to go the way of newspapers.  Which is to say, an inexorable slide into irrelevance.

It just isn’t how the world operates any longer … even if one is 60 or 70 years old.

More statistics from the Pew Research Center report can be accessed here.

Social media: The biggest casualty of the U.S. presidential election?

smrrOnly one presidential candidate was a winner on election night. But there was more than one loser.

Sure, minor-party candidates lost. But I’d posit that social media itself was a loser as well.

It isn’t an exaggeration to contend that the 18-month long presidential campaign has had a corrosive effect on the social media landscape.

You could even say that the social media landscape became downright “anti-social,” thanks to the 2016 campaign.

For those who might have posted politically-oriented social media posts, they’ve risked receiving strident arguments, flamethrower responses and alienated friends.

Along those lines, a recent Pew Research study found that significant percentages of people have blocked individuals or adjusted their privacy settings on social media to minimize their exposure to all the vitriol.

It’s a far cry from social media’s promise in the “good old days” – not so long ago actually — when these platforms enabled people to stay in touch with friends and make acquaintances across the country and the world that they would never have been able to forge in the days before social platforms.

The easy ability to share information and interests only added to the appeal of social media, as people expanded their horizons along with their network of friends.

Companies and brands got in on the action, too. They found social media a welcoming place – particularly in the case of consumer brands where companies could ride the wave of social interaction and promote all sorts of products, services and worthwhile causes.

Advertising and promotion on social media naturally followed, with many companies allocating as much as 20% or more of their annual marketing budgets to those endeavors.

Until quite recently, that happy scenario seemed to be holding, with brands launching interesting, fun, quirky or cause-oriented shareable content in the hopes that they would “go viral” and pay dividends far in excess of the resource outlay.

What a difference 18 months makes. Suddenly, brands are spending only about half as much on social media marketing as they attempt to stay above the fray.  That also means staying far away from venturing into current topical discussions, lest their prickly digital audiences become instantly polarized.

Unfortunately, for brands who wish to avoid controversy arising from even the most seemingly innocuous of postings, social media is no longer a welcoming meadow of lush green grass and bright flowers. It’s closer to a war-torn field peppered with land mines just waiting to explode.  Hence the hasty retreat.

Unfortunately, just like trying to unscramble an egg, it’s very hard to see social media ever going back to what it used to be.

And for that state of affairs, there’s plenty of blame to go around.

Sea change: Today, Americans are receiving their political news in vastly different ways.

pnWhere are Americans getting their political news in this very intensive Presidential election year?

There’s no question that the season is turning out to be a news bonanza, beginning with the string of debates featuring interesting and entertaining candidates and continuing on with near-nonstop political coverage on the cable networks.

And then there’s the endless chatter over on talk radio …

Recently, the Pew Research Center asked Americans where they’re receiving their political news. According to its just-issued report, Pew found that nine in ten American adults age 18+ typically consume some sort of news about the presidential election in any given week’s time.

When asked to cite which sources of information of political news are “most helpful,” here’s how the respondents answered:

  • Cable TV news: ~24% cited as the “most helpful” source of information
  • Local TV news: ~14%
  • Social media: ~14%
  • Website or apps: ~13%
  • Radio: ~11%
  • Network nightly news broadcasts: ~10%
  • Late-night comedy TV: ~3%
  • Local newspapers: ~3%
  • National newspapers: ~2%

Looking at this pecking order, several things stand out:

  • Even a few years ago, I doubt social media would have outstripped network TV or radio as a more helpful source of political news.
  • And look at where cable TV news is positioned — not only at the top of the list, but substantially above any other source of political information.
  • As for newspapers … even accounting for the fact that some websites or apps cited as helpful political news sources may actually be digital outlets for newspapers, newspapers’ position at the bottom of the list underscores their rapid loss of importance (and influence) in the political sphere. Aside from inflating a candidate’s own ego, who really cares about newspaper endorsements anymore?

Not surprisingly, the Pew research finds noticeable differences in the preference of political news sources depending on the age of the respondents. For instance, among respondents age 65+, here are the top four “most helpful” sources:

  • Cable TV news: ~43%
  • Network nightly news broadcasts: ~17%
  • Local TV news: ~10%
  • Local newspapers: ~6%

Contrast this with the very youngest respondents (age 18 to 29), where the two most helpful sources of information are social media (~35%) and websites or apps (~18%).

I’m sure readers have their own personal views as to which of the sources of political news are preferable in terms of their veracity. For some, social media and late-night TV comedy programs illustrate a general decline in the “quality” of the news, whereas others might look at radio programs or cable TV news in precisely the same negative terms.

More details on the Pew Research study can be found here.

“Immigration Nation”: Pew Research Projects U.S. Population Demographics into the Future

immigrantsI’ve blogged before about the immigration issue and its potential impact on the U.S. economy and society.

Now the Pew Research Center has released a report that predicts the U.S. becoming a “no ethnic majority” nation within the next 35 years.

When one considers that the United States population was nearly 85% white Anglo in 1965 … and that percentage has dropped to about 62% now, it isn’t that hard to imagine Pew’s prediction coming true.

Here’s the trajectory Pew predicts over the coming ten-year periods:

  • 2015: ~62% estimated U.S. white Anglo population percentage
  • 2025: ~58% projected white Anglo population percentage
  • 2035: ~56% projected
  • 2045: ~51% projected
  • 2055: ~48% projected
  • 2065: ~46% projected

Perhaps what’s more intriguing is that Pew projects the largest future percentage gains will be among Asian-Americans rather than Latino or Black Americans. The Asian share of the American population is expected to double over the period:

  • 2015: ~6% estimated U.S. Asian population percentage
  • 2025: ~7% projected Asian population percentage
  • 2035: ~9% projected
  • 2045: ~10% projected
  • 2055: ~12% projected
  • 2065: ~14% projected

If these projections turn out to be accurate, the Asian population percentage is on tap to become the nation’s third highest group.

By contrast, the Hispanic population, while continuing to grow, looks as if it will level off at about 22% of the country’s population by 2045. For Black Americans, Pew projects the same dynamics at work, but at the 13% level.

citizenship ceremonyAccording to Pew’s analysis, the biggest driving force for the projected Asian population growth is immigration. By 2055, Pew expects that Asians will supplant Latinos as the largest single source of immigrants — and by 2065 the difference is expected to be substantial (38% Asian vs. 31% Latino immigrants).

Conducted in parallel with Pew’s projection analysis was an online opinion research survey of American adults (18 and over) it conducted in March and April of this year.

Among the attitudinal findings Pew uncovered were these:

  • “Immigrants in the U.S. are making society better”: ~45% of respondents agree … ~37% disagree
  • “I would like to see a reduction in immigration”: ~50% agree
  • “I would like to see the immigration system changed or completely revamped”: ~80% agree

Again, no great surprises in these figures — although if one paid attention only to news accounts in the “popular media,” one might find it surprising to learn that a plurality of Americans actually consider immigration a net positive for American society …

Additional findings from the Pew survey as well as its demographic projections can be found here.

Offline America: Pew’s latest research shows that 15% of American adults don’t use the Internet at all.

Internet usageFor those of us who spend practically every living minute of our day online, it seems almost unbelievable that there are actually some people in the United States who simply never go online.

The Pew Research Center has been researching this question for the past 15 years. And today, the percentage of “offline American adults” (people age 18 or over who don’t use the Internet) remains stuck at around 15% — a figure that has been stubbornly consistent for the past three years or so:

Pew Research Center Americans Not Online 2000-2015 survey results

But up until then, the percentage had been declining, as can be seen in these milestone Pew survey years:

  • 2000: ~48% of American adults not using the Internet
  • 2005: ~32% not using
  • 2010: ~24% not using
  • 2015: ~15% not using

Part of the long-term shift has been new people interfacing with the Internet.  But another factor is simply the “aging out” of older populations as they pass from the scene.

The demographic dynamics Pew finds on Internet usage show relatively little difference in behavior based on ethnicity — except that only about 5% of Asian-Americans never go online.

Rather, it’s differences in age particularly — but also in income levels and education levels — that are more telling.

offline AmericansThe age breakdown is stark, and shows that at some point, we are bound to have near-total adoption of the Internet:

  • Age 18-29: ~3% don’t use the Internet
  • Age 30-49: ~6% don’t use
  • Age 50-64: ~19% don’t use
  • Age 65+: ~39% don’t use

Income levels are also a determining factor when it comes to Internet usage:

  • Less than $30,000 annual household income: ~25% don’t use the Internet
  • 30,000 – 50,000 annual HH income: ~14% don’t use
  • $50,000 – $75,000 annual HH income: ~5% don’t use
  • Over $75,000 annual HH income: ~3% don’t use

And Pew also finds significant differences based on the amount of formal education:

  • Some high-school level education: ~33% don’t use the Internet
  • High school degree: ~23% don’t use
  • Some college: ~9% don’t use
  • College graduate or post-graduate education: ~4% don’t use

Lastly, while no difference in Internet usage has been found between urban and suburban Americans, the adoption rate in rural areas continues to lag behind:

  • Urban dwellers: ~13% don’t use the Internet
  • Suburban residents: ~13% don’t use
  • Rural areas: ~24% don’t use

One reason for the lower adoption rate in rural areas may be limited Internet access or connectivity problems — although these weren’t one of the key reasons cited by respondents as to why they don’t go online. Pew’s research has found these points raised most often:

  • Have no interest in using the Internet / lack of relevance to daily life: ~34%
  • The Internet is too difficult to use: ~32%
  • The expense of Internet service and/or owning a computer: ~19%

The results of Pew’s latest survey, which queried ~5,000 American adults, can be viewed here. Since the research is conducted annually, it will be interesting to see if Internet usage resumes its drive towards full adoption, or if the ~85% adoption rate continues to be a “ceiling” for the foreseeable future.

Americans fall out of love … again.

The thrill has gone, to linger on would spoil it anyhow … for the party’s over now.

— Noël Coward

Presidential Approval

The chart above isn’t the descent of the Matterhorn … it’s the downward trajectory of Barack Obama’s approval ratings in the Gallup Poll since his reelection last year.

Descent of the Matterhorn (Edward Whymper)
No good end: Explorer Edward Whymper’s climbing team shortly after reaching the summit of the Matterhorn (1865).

So it is a descent of sorts.  And it’s beginning to look eerily similar to what befell George W. Bush and his poll numbers at roughly the same period in his presidency, as this comparative graph prepared by the Pew Research Center illustrates:

Presidential poll comparisonsOne can point to specific events during each administration that could be inflection points in the public’s changing perception of presidential performance:  The Iraq War surge … Hurricane Katrina … the Affordable Care Act rollout … the Benghazi Consulate attack … the NSA eavesdropping scandal and so forth.

But I wonder if it’s actually those elements … or is it more that we fickle Americans are prone to tire of our presidents after about the fifth year or so.

Hearing one speech or one press conference too many … or perhaps hearing a statement or two by the administration that doesn’t ring quite true.  It’s not a big step to go from those unpleasant interactions to simply tuning out.

Whatever it is, we’re probably in the midst of witnessing a break between the public and the Obama administration that’s here to stay for the remainder of the President’s term.

Of course, the chart above also reminds us that second term presidential popularity trends looked somewhat different if we dip back in history 15 years or further.

What are your thoughts on today’s developments?  Is this the “new normal” for Americans in our “instant gratification” age?  Or do you see the dynamics differently?  Feel free to share your comments with other readers here.

The Twitter Machine: Keeping Hype Alive

Americans' Twitter usage isn't getting anywhere near Facebook'sI’ve blogged before about Twitter’s seeming inability to break out of its “niche” position in communications. We now have enough time under our belt with Twitter to begin to draw some conclusions rather than simply engage in speculation.

Endlessly hyped (although sometimes correctly labeled as a revolutionary communications tool – see the North African freedom movements) the fact is that Twitter hasn’t been adopted by the masses like we’ve witnessed with Facebook.

The Pew Research Center’s Internet & American Life Project estimates that fewer than 10% of American adults who are online are Twitter users. That equates to about 15 million Americans, which is vastly lower than Twitter’s own claims of ~65 million users.

But whether you choose to believe the 15 million or the 65 million figure, it’s a far cry from the 150+ million Americans who are on Facebook – which represents about half of the entire American population.

You can find a big reason for Pew’s discrepancy by snooping around on Twitter a bit. It won’t take you long to find countless Twitter accounts that are bereft of any tweet activity at all. People may have set their acount up at one time, but long ago lost interest in using the platform – if indeed they ever had any real Twitter zeal beyond “follow-the-leader.” (“Everybody’s going on Twitter … shouldn’t I sign up, too?”)

This is the purest essence of hype: generating a flurry of interest that quickly dissipates as the true value (or lack thereof) is discerned by users.

Of course, Twitter does have its place. Some brands find the platform to be a good venue for announcing new products and sales deals. And it doesn’t take long for the best of those deals promoted on Twitter to leech their way into the rest of the online world.

Other companies – although far fewer – are using Twitter as a kind of customer service discussion board.

And as we all know, celebrities l-o-v-e their Twitter accounts. What a great, easy way to generate an endless stream of sound-bite information about their favorite topic: themselves.

Analyses of active Twitter accounts have shown that a sizable chunk of the activity is made up of media properties and brands tweeting each other … a lot of inside-the-park baseball.

What’s missing from the equation is the level of “real people” engagement one can find on Facebook in abundance … and maybe soon on Google+ as well. That’s real social interaction – in spades.

Actually, you mightn’t be too far off the mark if you deduced that Twitter is the digital equivalent of a bunch of industry insiders at a cocktail party … saying little of real importance while trying to appear “impressive” and “hip” at the same time.

But who’s being fooled by that?