Marketing Technology: Is “Implosion” Where We’re Headed?

A chart of just some of the major marketing technology platforms -- and this is as of 2013!
A chart of just some of the major marketing technology platforms — and this was in 2013!

It seems that with each passing day, one or two new technology products are announced by MediaPost and other publishers in the marketing field.

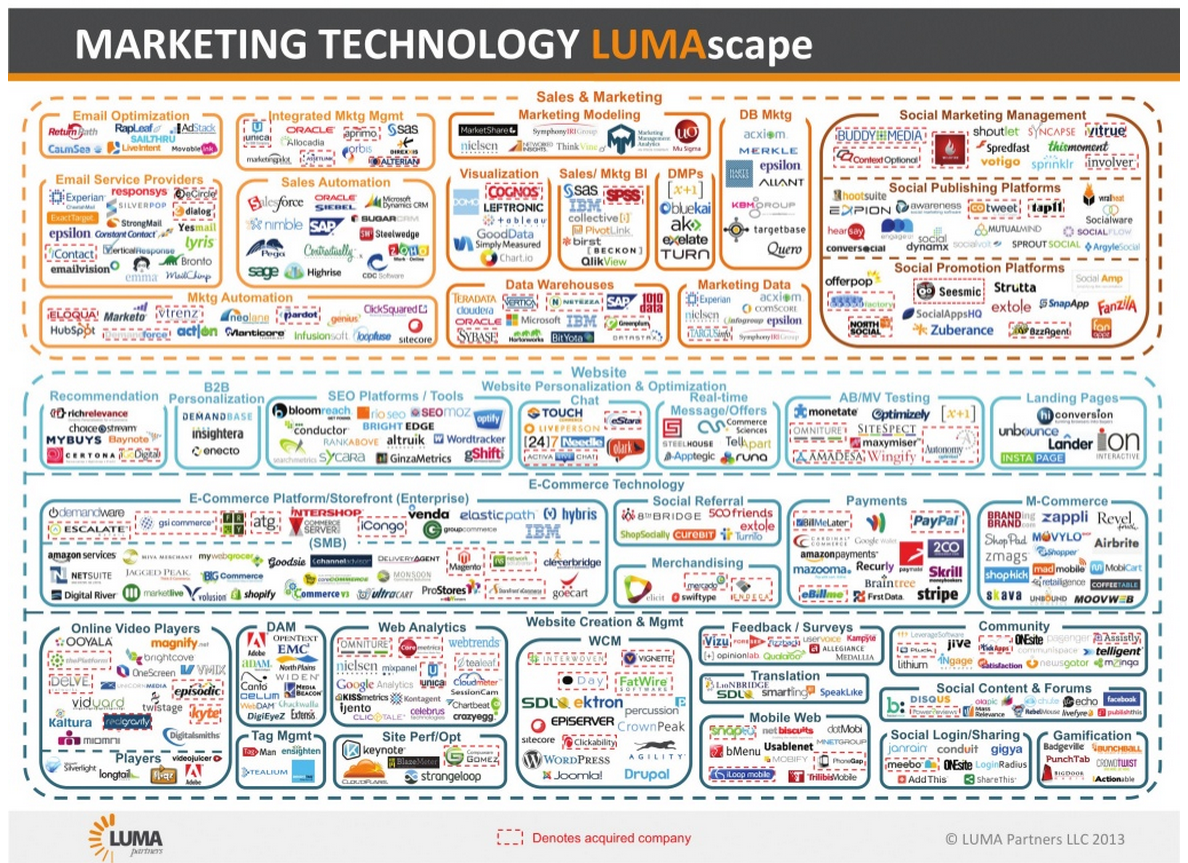
The numbers tell the story. The marketing technology industry website chiefmartec.com lists nearly 1,900 marketing technology vendors in more than 40 categories.

That’s nearly double last year’s tally of around 950 vendors.

Software clearinghouse Capterra lists even more: a whopping 3,000+ marketing technology products across 30 categories.

These firms account for well over $20 billion in financing – the dollars that can be tracked, that is – including around 30 companies that are valued at $1 billion or more each.

That’s a lot of companies and vendors. Of course, there are many customers who are looking for tech-driven marketing solutions as well.  The question is whether things have gotten out of balance.

Business writer and marketing tech specialist Malcom Friedberg thinks so. He’s Chief Marketing Officer at CleverTap, and he also publishes columns on a variety of business topics.

In Friedberg’s view, the sheer number of marketing technology vendors and products means that the segment may now be on the brink of an implosion.

Friedman references a recent CMO Council document that reports that more than 80% of marketers are using as many as ten different marketing-related technologies or cloud solutions.

And as new technologies are added, the problem is finding educated staff – and enough hours in the day – to cover all of these products well. In many instances, users may be just scratching the surface of what these products can provide; the “multiple hat” dynamics of many marketing departments mean that very few people qualify as being “advanced” users.

The problems boil down to this: Even if a department has two or three marketing people devoted exclusively to tech-related responsibilities (at tall order in most companies) – this assumes that those people can work equally well on multiple different platforms.

The reality is quite different. It’s more like a big jumble – with consultants brought in to sort things out.  It may get the job done, but it isn’t pretty – and it’s hardly a recipe for “the best of best practices.”

Survey work by the CMO Council supports this hypothesis. The Council has found that fewer than on in ten of the marketers it surveyed reported that they possess a highly evolved digital marketing model that has a proven, clear path of evolution.

Malcolm Friedberg
Malcolm Friedberg

Friedman thinks he knows where things are heading. Not to more choices, but rather to less:

“In my opinion, we’ll start to see massive consolidation and uber-marketing systems. Think super-integrated marketing and advertising clouds … the preoccupation with ‘best-of-breed’ in every category will be replaced by a ‘tree-and-branch’ model, with one core technology and a few ‘good enough’ complementary ones.”

Friedman calls it “an expensive French meal” instead of “a Vegas buffet.” While there will always be new products promising incremental improvements, he predicts that by 2020, the common business model will be super-integrated marketing and advertising clouds as we see already with the likes of Marketo and Hubspot.

What do you think? Is Friedman onto something … or is the orgy of new marketing technology products going to continue unabated?  Please share your thoughts with other viewers here.

Surprising statistic? One-third of American adults still aren’t on social media.

social mediaFor the many people who use social media on a daily basis, it may seem inconceivable that there are a substantial number of other Americans who aren’t on social media at all.

But that’s the case. The Pew Research Center has been tracking social media usage on an annual basis over the past decade or so, and it finds that about one-third of Americans still aren’t using any social networking sites.

To be sure, today’s ~65% participation rate is about ten times higher than the paltry ~7% participation rate Pew found the first time it surveyed Americans about their social media usage back in 2005.

According to Pew’s field research findings, here’s how the percentage of social media involvement has risen in selected years in the decade since. (The figures measure the percentage of Americans age 18 or over who use at least one social networking site.)

  • 2006: ~11% using at least one social networking site
  • 2008: ~25%
  • 2010: ~46%
  • 2012: ~55%
  • 2015: ~65%

In more recent years, the highest growth in social media participation rates has been among older Americans (over the age of 65), ~35% of whom are using social media today compared to just 11% five years ago.

That still pales in comparison to younger Americans (age 18-29), ~90% of whom use social media platforms.

While it’s a common perception that women are more avid users of social media than men, Pew’s research shows that the participation rate is actually not that far apart. Statistically it isn’t significant, in fact: a ~68% social media participation rate for women versus ~62% for men.

pew-research-centerSimilarly, there are more similarities than differences among the various racial and ethnic groups that Pew surveys — and the same dynamics are at work when it comes to differing education levels, too.

Regional differences in social media practice continue to persist, however, with rural residents less likely to use social media than suburban residents by a ten-point margin (58% versus 68%). City dwellers fall in between.

More details on Pew’s most recent field research on the topic of social media participation can be accessed here. See if you notice any surprising findings among them.

The lifetime value of a blog post: It’s more than you probably think.

bgHere’s an interesting factoid: In 2014, more than 550 million blog posts were uploaded on WordPress alone.

Add in Tumblr, and there are another 250 million blogs.

Considering the sheer volume of blogging activity, it’s surprising how little intelligence on the “value” of a blog post has been available. But now a study has been published that sheds light on the question.

The evaluation, which was commissioned by branding agency IZEA and conducted by research firm The Halverson Group, has determined that the lifespan of a blog post is far greater than the accepted measurement of 30 days.

The lifespan is more than 20 times longer, it turns out.

Let’s break down the research findings a bit more. The IZEA/Halverson study determined that by Day 700 (about two years), the typical blog post will have received ~99% of its impressions.

That’s a pretty long annuity, and it provides strong ammo for marketers who advocate for blog posts as an important way to maximize the return on their marketing spend.

According to the study, the typical blog post goes through three distinct phases in its useful life:

  • Shout: The initial spike in impressions that happens within the first 7 to 10 days, typically resulting in half of the total impressions the post will ever receive.
  • Echo: The period ending at 30 days, by which time the typical blog post will have racked up ~70% of its total impressions.
  • Reverb: The third phase that stretches from approximately Day 30 all the way to Day 700. This long-tail phase will typically generate the final ~30% of impressions.

Of course, the performance of individual blog posts will depend on the subject matter, the timeliness of the information, and other factors. But as a general rule of thumb, the Halverson findings show the potential value of a blog post as far greater than many marketers may have surmised up until now.

The Halverson study also provides a good rule of thumb for the lifetime impression value of a blog post. It can be calculated by multiplying a blog post’s 30-day monthly pageview total by a factor of 1.4.

In other words, by Day 30, marketers can know with a good deal of confidence how the blog post will perform overall.

Using this formula, marketers will be able to demonstrate the “evergreen” effect of blogging as a marketing tactic.

Certainly, the residual benefits of a blog post look very strong — particularly in contrast to volume-based media such as display or search advertising, which stop performing the instant the campaign investment ends.

The bottom line: Companies should continue to blog away … and if they haven’t started or if they’ve allowed their blogging program to flag, it’s time to get things back in gear!

Social media data mining: Garbage-in, garbage-out?

gigoIt’s human nature for people to strive for the most flattering public persona … while confining the “true reality” only to those who have the opportunity (or misfortune) to see them in their most private moments.

It goes far beyond just the closed doors of a family’s household. I know a recording producer who speaks about having to “wipe the bottoms” of music stars — an unpleasant thought if ever there was one.

In today’s world of interactivity and social platforms, things are amplified even more — and it’s a lot more public.

Accordingly, there are more granular data than ever about people, their interests and their proclivities.

The opportunities for marketers seem almost endless. At last we’re able to go beyond basic demographics and other conventional classifications, to now pinpoint and target marketing messages based on psychographics.

And to do so using the very terms and phrases people are using in their own social interactions.

The problem is … a good deal of social media is one giant head-fake.

Don’t just take my word for it. Consider remarks made recently by Rudi Anggono, one of Google’s senior creative staff leaders. He refers to data collected in the social media space as “a two-faced, insincere, duplicitous, lying sack of sh*t.”

Anggono is talking about information he dubs “declared data.” It isn’t information that’s factual and vetted, but rather data that’s influenced by people’s moods, insecurities, social agenda … and any other set of factors that shape someone’s carefully crafted public image.

In other words, it’s information that’s made up of half-truths.

This is nothing new, actually. It’s been going on forever.  Cultural anthropologist Genevieve Bell put her finger on it years ago when she observed that people lie because they want to tell better stories and to project better versions of themselves.

What’s changed in the past decade is social media, of course.  What better way to “tell better stories and project better versions of ourselves” than through social media platforms?

Instead of the once-a-year Holiday Letter of yore, any of us can now provide an endless parade of breathless superlatives about our great, wonderful lives and the equally fabulous experiences of our families, children, parents, A-list friends, and whoever else we wish to associate with our excellent selves.

Between Facebook, Instagram, Pinterest and even LinkedIn, reams of granular data are being collected on individuals — data which these platforms then seek to monetize by selling access to advertisers.

In theory, it’s a whole lot better-targeted than the frumpy, old fashioned demographic selects like location, age, income level and ethnicity.

But in reality, the information extracted from social is suspect data.

This has set up a big debate between Google — which promotes its search engine marketing and advertising programs based on the “intent” of people searching for information online — and Facebook and others who are promoting their robust repositories of psychographic and attitudinal data.

There are clear signs that some of the social platforms recognize the drawbacks of the ad programs they’re promoting — to the extent that they’re now trying to convince advertisers that they deserve consideration for search advertising dollars, not just social.

In an article published this week in The Wall Street Journal’s CMO Today blog, Tim Kendall, Pinterest’s head of monetization, contends that far from being merely a place where people connect with friends and family, Pinterest is more like a “catalogue of ideas,” where people “go through the catalogue and do searches.”

Pinterest has every monetary reason to present itself in this manner, of course.  According to eMarketer, in 2014 search advertising accounted for more than 45% of all digital ad spending — far more than ad spending on social media.

This year, the projections are for more than $26 billion to be spent on U.S. search ads, compared to only about $10 billion in the social sphere.

The sweet spot, of course, is being able to use declared data in concert with intent and behavior. And that’s why there’s so much effort and energy going into developing improved algorithms for generating data-driven predictive information than can accomplish those twin goals.

Rudi Anggono
Rudi Anggono

In the meantime, Anggono’s admonition about data mined from social media is worth repeating:

“You have to prod, extrapolate, look for the intent, play good-cop/bad-cop, get the full story, get the context, get the real insights. Use all the available analytical tools at your disposal. Or if not, get access to those tools. Only then can you trust this data.”

What are your thoughts? Do you agree with Anggono’s position? Please share your perspectives with other readers here.

Who Are the “Mobile Addicts” in This World?

phones on paradeMost of us know at least some people who seem to be on their mobile devices constantly. And now their total numbers have been quantified.

Bank of America has teamed up with Yahoo! research firm Flurry Analytics to publish a Consumer Mobility Report. The one published last month is the second such yearly report.

The BofA/Flurry analysis breaks down three categories of mobile device users: those who it characterizes as “regular users” … “super users” … and “mobile addicts.”

The classifications are defined as follows:

  • Regular Users: People who launch mobile applications 1 to 16 times per day
  • Super Users: Those who launch apps 16 to 60 times per day
  • Mobile Addicts: Those who launch apps more than 60 times per day

According to the study, using these criteria there are ~280 million people around the world who qualify as Mobile Addicts — and that figure is up sharply since 2014 (by nearly 60%).

By comparison, Super Users represent slightly under 600 million people, while Regular Users are still the lion’s share at ~985 million.

So, while a distinct minority, the number of Mobile Addicts is actually quite high — and it’s growing much faster than the other two segments.

It certainly helps us understand why we’re seeing mobile addiction-like behavior seemingly everywhere we look.

The BofA/Flurry study also delved into the major categories of apps that Mobile Addicts are using, and found that their usage levels are higher across all of these categories.

The five most popular categories for Mobile Addicts are topped by messaging and social platforms, which represent the biggest usage compared to other mobile phone consumers:

  • Messaging and social index: 556 (used 5.56 times more than the average mobile device consumer)
  • Utilities and productivity index: 427
  • Gaming index: 202
  • Finance index: 155
  • News and magazines index: 102

Study details are available here.

Do any of these statistics come as a particular surprise to you? Let other readers know your thoughts.

Offline America: Pew’s latest research shows that 15% of American adults don’t use the Internet at all.

Internet usageFor those of us who spend practically every living minute of our day online, it seems almost unbelievable that there are actually some people in the United States who simply never go online.

The Pew Research Center has been researching this question for the past 15 years. And today, the percentage of “offline American adults” (people age 18 or over who don’t use the Internet) remains stuck at around 15% — a figure that has been stubbornly consistent for the past three years or so:

Pew Research Center Americans Not Online 2000-2015 survey results

But up until then, the percentage had been declining, as can be seen in these milestone Pew survey years:

  • 2000: ~48% of American adults not using the Internet
  • 2005: ~32% not using
  • 2010: ~24% not using
  • 2015: ~15% not using

Part of the long-term shift has been new people interfacing with the Internet.  But another factor is simply the “aging out” of older populations as they pass from the scene.

The demographic dynamics Pew finds on Internet usage show relatively little difference in behavior based on ethnicity — except that only about 5% of Asian-Americans never go online.

Rather, it’s differences in age particularly — but also in income levels and education levels — that are more telling.

offline AmericansThe age breakdown is stark, and shows that at some point, we are bound to have near-total adoption of the Internet:

  • Age 18-29: ~3% don’t use the Internet
  • Age 30-49: ~6% don’t use
  • Age 50-64: ~19% don’t use
  • Age 65+: ~39% don’t use

Income levels are also a determining factor when it comes to Internet usage:

  • Less than $30,000 annual household income: ~25% don’t use the Internet
  • 30,000 – 50,000 annual HH income: ~14% don’t use
  • $50,000 – $75,000 annual HH income: ~5% don’t use
  • Over $75,000 annual HH income: ~3% don’t use

And Pew also finds significant differences based on the amount of formal education:

  • Some high-school level education: ~33% don’t use the Internet
  • High school degree: ~23% don’t use
  • Some college: ~9% don’t use
  • College graduate or post-graduate education: ~4% don’t use

Lastly, while no difference in Internet usage has been found between urban and suburban Americans, the adoption rate in rural areas continues to lag behind:

  • Urban dwellers: ~13% don’t use the Internet
  • Suburban residents: ~13% don’t use
  • Rural areas: ~24% don’t use

One reason for the lower adoption rate in rural areas may be limited Internet access or connectivity problems — although these weren’t one of the key reasons cited by respondents as to why they don’t go online. Pew’s research has found these points raised most often:

  • Have no interest in using the Internet / lack of relevance to daily life: ~34%
  • The Internet is too difficult to use: ~32%
  • The expense of Internet service and/or owning a computer: ~19%

The results of Pew’s latest survey, which queried ~5,000 American adults, can be viewed here. Since the research is conducted annually, it will be interesting to see if Internet usage resumes its drive towards full adoption, or if the ~85% adoption rate continues to be a “ceiling” for the foreseeable future.

This email signature block says it all …

signature areaOver the years, I’ve noticed how signature blocks at the bottom of business e-mails have been getting longer and more elaborate.

Remember the days of simply showing an office address, phone, FAX and e-mail? That disappeared a long time ago.

Why it’s happened is all a function of the many ways people can and do choose to communicate today.

For folks in the marketing and sales field, sometimes the contact options go overboard. Not long ago, I received an e-mail pertaining to a business service pitch. Here’s what the sender had included in the signature area at the bottom of his e-mail message:

  • If you’re a phone person, here’s my mobile number:
  • If you’re a text person, send a message to my cell:
  • If you’re an email person, here’s my address:
  • If you’re an instant message person, here’s my Google ID:
  • If you’re a Skype person, here’s my handle:
  • If you’re a Twitter person, here’s my username:
  • If you’re a Facebook person, here’s my page:
  • If you’re a face-to-face person, here’s my office location:

The only thing missing was Pinterest, and a FAX number …

Seeing this signature block was a stark reminder of the myriad ways people are connecting with their business and personal contacts.

Nothing new in that, of course — but seeing it presented in one big bundle really drove the point home.

Scott Ginsberg
Scott Ginsberg

Later, I discovered that this litany of contact options was first popularized four or five years ago by the business author and blogger Scott Ginsberg. Evidently, others have now picked up and run with the same concept.

Taken together, it’s no wonder people feel busier today than ever before, despite all of the ways in which digital technology purports to simplify communication and make it more efficient.

I wouldn’t want to go back to the old days … but at times, there’s a certain attraction to the idea of not having to be “always on” in “so many places,” no?

Have we become too complacent about cyber-security threats?

cyber warfareThe scandal involving the security risk to U.S. State Department e-mails is just the latest in a long list of news items that are bringing the potential dangers of cyber-hacking into focus.

But of course, we’ve seen it before — and it involves far more than just “potential” risk.  From Target, Best Buy and other retailers to Ashley Madison customer profiles, IRS taxpayer information and the U.S. government’s personnel records, the drumbeat of cyber-security threats that’s turned out to be all-too-real is persistent and ongoing.

In the realm of marketing and public relations, recent breaches of PR Newswire and Business Wire data gave hackers access to pre-release earnings and financial reports that have been used to enrich nefarious insider traders around the world to the tune of $100 million or more in ill-gotten gains.

These and other events are occurring so regularly, it seems that people have become numb to them.  Every time one of these news items breaks, Instead of sparking outrage, it’s a yawner.

But Jane LeClair, COO of the National Cybersecurity Institute at Excelsior College, is pleading for an organized effort to thwart the continuing efforts — one of which could end up being the dreaded “Cyber Pearl Harbor” that she and other experts have warned us about for years.

“We certainly can’t go on this way — waiting for the next biggest shoe to drop when hundreds of millions — perhaps billions — will be looted from institutions … It’s time we stopped making individual efforts to build cyber defenses and started making a collective effort to defeat … the bad actors that have kept us at their mercy,” LeClair contends.

I think that’s easier said than done.

Just considering what happened with the newswire services is enough to raise a whole bevy of questions:

  • Financial reports awaiting public release were stored on the newswires’ servers … but what precautions were taken to protect the data?
  • How well was the data encrypted?
  • What was the firewall protection? Software protection?
  • What sort of intruder detection software was installed?
  • Who at the newswire services had access to the data?
  • Were the principles of “least privilege access” utilized?
  • How robust were the password provisions?

In the case of the newswire services, the bottom-line explanation appears to be that human error caused the breaches to happen.  The attackers used social engineering techniques to “bluff” their way into the systems.

Mining innocuous data from social media sites enabled the attackers to leverage their way into the system … and then use brute force software to figure out passwords.

Once armed with the passwords, it was then easy to navigate the servers, investigating e-mails and collecting the relevant data. The resulting insider trading transactions, made before the financial news hit the streets, vacuumed up millions of dollars for the perpetrators.

Now the newswire services are stuck with the unenviable task of attempting to “reverse engineer” what was done — to figure out exactly how the systems were infiltrated, what data was taken, and whether malicious computer code was embedded to facilitate future breaches.

Of course, those actions seem a bit like closing the barn door after the cows have left.

I, for one, don’t have solutions to the hacking problem. We can only have faith in the experts inside and outside the government for determining those answers and acting on them.

But considering what’s transpired in the past few months and years, that isn’t a particularly reassuring thought.

Would anyone else care to weigh in on this topic and on effective approaches to face it head-on?

In case you’re wondering … consumers don’t really care about brands all that much.

branding“I don’t want a ‘relationship’ with my brands.  I want the best products at the best price.” — Jane Q. Public

In the era of interactive marketing and social media, there’s often a good deal of talk about how certain brands are successfully engaging their customers and creating an environment of “brand love” — or at least “brand stickiness.”

It’s not only consumer brands like Chipotle and Under Armour, but also B-to-B and hybrid brands like Intel, Apple and Uber.

As a person who’s been involved in marketing and advertising for well over a quarter-century, I tend to treat these pronouncements with a little less open-mouthed awe than others.

I get how when a brand is particularly admired, it becomes the “go-to” one when people are in the market for those particular products and services.

But the idea that there’s real “brand love” going on — in a sense similar to people forging close relationships with the people in their lives — to me that’s more far-fetched.

The marketing research I’ve encountered appears to refute the notion as well.

Case in point: In an annual index of “meaningful brands” published by the Havas MarComm agency, the research finds that very few consumers cite brands they “can’t live without.”

The 2015 edition of the Havas Meaningful Brands Index has now been released … and the results are true to form. Among U.S. consumers, only about 5% of the 1,000 brands evaluated by Havas across a dozen industries would be truly missed if they were no longer available.

It’s a big survey, too:  Havas queried ~300,000 people across 34 countries in order to build the 2015 index. Broadly speaking, the strength of brands is higher in countries outside the United States, reflecting the fact that trust levels for leading brands in general are higher elsewhere — very likely because lesser known brands or “generics” have a greater tendency to be subpar in their performance.

But even considering the brand scores globally, three out of four consumers wouldn’t miss any brands if they suddenly disappeared from the market.

What are the exceptions? Looking at the brands that scored highest gives us clues as to what it takes to be a brand that people truly care about in their lives.

Samsung is ranked the #1 brand globally. To me, it makes perfect sense that the manufacturer of the most widely sold mobile device on the planet would generate a strong semblance of “brand love.”

Even in the remotest corners of the world, Samsung has made the lives of countless people easier and better by placing a powerful computer in their pocket. It’s only logical that Samsung is a brand many people would sorely miss if it disappeared tomorrow.

The second strongest brand in the Havis index is Google. No surprise there as well, because Google enables people to research and find answers on pretty much anything that ever crosses their minds. Again, it’s a brand that most people wouldn’t want to do without.

But beyond these, it’s plain to see that nearly all brands just aren’t that consequential to people’s lives.

With this in mind, are companies and brands spending too much energy and resources attempting to get customers to “care” about them more than simply to have a buying preference when the time comes to purchase products and services?

Brand-LoyaltyRelated to that, is adding more “meaning” to a brand the answer to getting more people to express brand love? Or does it have far more to do with having products that meet a need … work better than competitors’ offerings … and are priced within the means of more people to purchase?

Havas — and common sense — suggests it’s the latter.

Do that stuff right, and a company will earn brand loyalty.

All the rest is just froth on the beer … icing on the cake … good for the psychological bennies.