The States Where Your Dollar Goes a Good Deal Further

bills
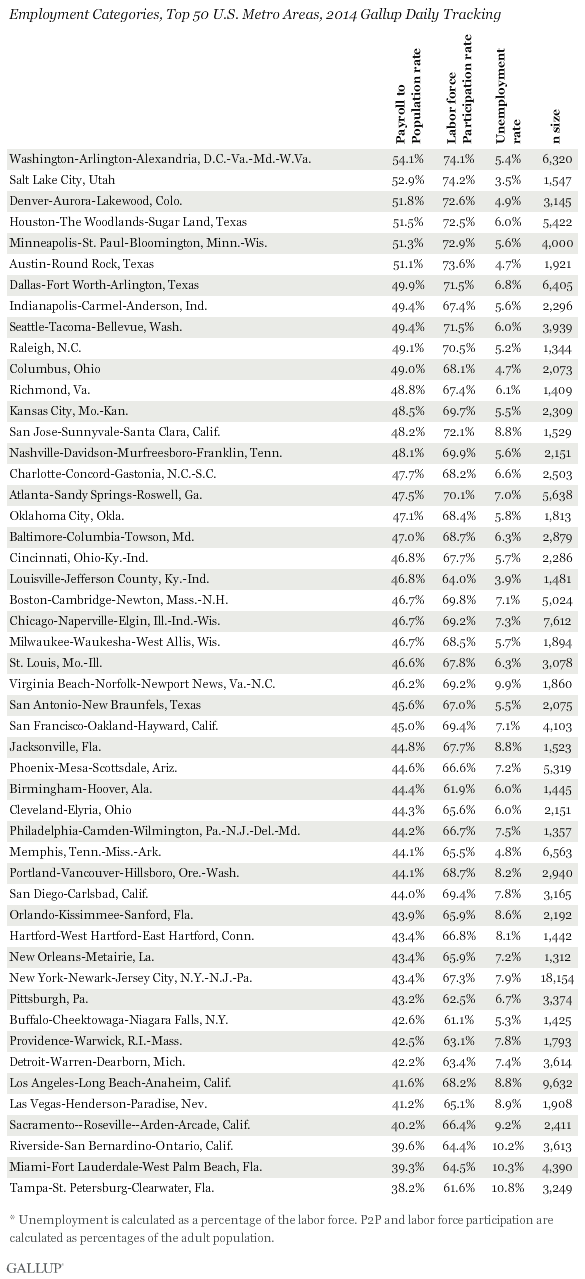
People have long suspected that many of America’s “richest” areas, based on salaries and other income, also happen to be where the cost of living is significantly higher.

Silicon Valley plus the New York City, Boston and the DC metro areas are some of the obvious regions, notorious for their out-of-sight housing and real estate prices.

But there are other factors at work as well in these high-cost areas, such as the cost of delivering goods to certain areas well-removed from the nation’s major trunk transportation arteries (think Alaska, Hawaii, Washington State and Minnesota).

And then there are state and local taxes. There appears to be a direct relationship between higher costs of living and higher taxation, too.

It’s one thing to go on hunches. But helpfully, all of these perceptions have been confirmed by the Bureau of Economic Analysis, using Personal Consumption Expenditure and American Community Survey data to do so.  Rolling the data up, the BEA has published comparative figures for all 50 states plus DC pertaining to the relative cost of living.

The approach was simple: consolidate the data to come up with a dollar figure in each state that represents how much $100 can purchase locally compared to the national average.  To get there, average price levels in each state have been calculated for household consumption, including rental housing costs.

Based on 2014 data, the figures have been mapped and are shown below:

100

So, just how far does $100 go?

The answer to that question is this: quite a bit further if you live in the mid-Continent region of the country compared to the Pacific Coast or the Northeast U.S.

In fact, $100 will get you upwards of 15% more goods and services in quite a few states. Here are the Top 10 states how much $100 will actually buy there:

  • Mississippi: $115.74 worth of goods and services
  • Arkansas: $114.16
  • Alabama: $113.51
  • Missouri: $113.51
  • South Dakota: $113.38
  • West Virginia: $112.87
  • Ohio: $112.11
  • Iowa: $111.73
  • Kansas: $111.23
  • Oklahoma: $111.23

At the other end of the scale, $100 is only going to buy about 20% to 30% fewer goods and services in the “Bottom 10” states compared to the “Top 10.” Here’s how it looks state-by-state:

  • DC: $84.60
  • Hawaii: $85.32
  • New York: $86.66
  • New Jersey: $87.64
  • California: $88.57
  • Maryland: $89.85
  • Connecticut: $91.41
  • Massachusetts: $93.28
  • Alaska: $93.37
  • New Hampshire: $94.16

Which states are closest to the $100 reference figure? Those would be Illinois at $99.40, and Oregon at $101.21.

I must say that those last two figures surprised me a bit … as I would have expected $100 to go less far in Illinois and Oregon.

Which of the state results surprise you? If any of them do, please share your observations with other readers.

The Sanders/Trump phenomenon: A view from outside the United States.

photo1This past Tuesday evening as I watched Bernie Sanders and Donald Trump vanquish their rivals handily in the New Hampshire presidential primary election, I received an e-mail from my brother, Nelson Nones, with his observations on “what it all means.”

As someone who has lived and worked outside the United States for years, Nelson’s views are often quite perceptive — perhaps because he is able to look at things from afar and can see the “landscape” better than those of us who are much closer to the action.

Call it a “forest versus trees” perspective.

And when it comes to the 2016 presidential election, it is Nelson’s view that the Sanders/Trump phenomenon is absolutely real and not something based on personality or celebrity — for good or for ill.

Shown below is what Nelson wrote to me.

… On the Underlying Dynamics

For context into what’s happening in the United States, the Pew Research Center’s recent report on the wealth gap in the United States is instructive.

In a nutshell, over the past 30 years Pew’s data points reveal: 

  • Upper-income families currently represent ~20% of the total, and their wealth (measured by median net worth) has doubled. 
  • Middle-income families represent 46% of the total. Their wealth barely changed (up 2%). 
  • Lower-income families therefore represent ~34% of the total, but their wealth fell 18%.

Now, after the end of the Cold War in 1992 until the onset of the Great Recession in 2007, the wealth of all three groups did rise, albeit by varying degrees: 

  • Upper-income by 112%
  • Middle-income by 68%
  • Lower-income by 30%

Here’s how they fared during the Great Recession (2007-10): 

  • Upper-income wealth declined by 17%
  • Middle-income wealth fell by 39%
  • Lower-income wealth fell by 42%

And after the Great Recession:

  • Upper-income families recovered 36% of their wealth lost during the Great Recession
  • Middle-income families recovered none
  • Lower-income families lost an additional 7% relative to their wealth in 2007

So, if we assume wealth to be a proxy for the feeling of well-being, then one could surmise that ~80% of American families feel like victims today — of which nearly half feel they are still being victimized.  

… On “Anger”

Are people feeling angry about this? You bet.   

Who are they going to blame? The other ~20% and foreigners, of course. 

Never mind the exculpatory hard data proffered by defenders of the nation’s elites revealing that big banks paid back all the bailout money they received during the Great Recession, or that bankers cannot be jailed for their alleged misdeeds unless and until proven guilty by jurors in courts of law (like anyone else), or that pharmaceutical companies’ margins on $45 billion of profit, at 12%, aren’t “quite” as obscene as they appear at first glance.   

None of those facts can ever restore wealth that’s been lost and never recovered, or is still falling. When you feel like a victim, such hard data are utterly and completely irrelevant.  

Both Bernie Sanders and Donald Trump are tapping into this anger with great success. As I watched both Sanders’s and Trump’s victory speeches, to vastly oversimplify, here is what I heard.  Sanders essentially said:

“It’s not fair that most Americans can’t get ahead or are falling behind. I’ll expropriate money from the rich by taxing Wall Street bankers and give it to you in the form of free tuition, student debt restructuring, lower healthcare costs and single-payer healthcare!” 

Trump essentially said:

“Political hacks are negotiating bad deals, letting China, Japan and Mexico take our money away from us every day. As the world’s greatest businessman, I’ll negotiate great deals fast to give you universal healthcare, and beat these countries so you get your money back – without having to share it with all those illegal immigrants!”

Photo2In my view, what both Sanders and Trump recognize is that ~80% of American families may have lost 40% of their wealth since 2007 with little or no hope of recovering it … but they haven’t lost any of their voting power.  

It makes no difference that the prescriptions offered by Sanders and Trump – squeezing money from Wall Street, China, Japan and Mexico, for example – are nonsense. As a lawyer I once knew always said, “Winning isn’t everything; it’s the only thing.”  To have any chance of accomplishing something useful (or not) as President, you have to win first.   

… On Populism being the Winning Ticket

In this election, under present circumstances, populism is a sure winner. 

The wealthiest ~20% of families (Democrats as well as Republicans) who represent the “establishment” in the eyes of the angry Sanders and Trump crowds, don’t quite smell the coffee yet.  

The angry crowds are out for money this election cycle, and I believe they hold enough votes to elect one of the two populist candidates (Sanders or Trump) who is promising “money.”   

… Not “experience,” “pragmatism,” “conservativism,” “liberalism,” “socialism,” “limited government,” “feminism,” “pro-life,” “pro-choice,” “pro-LGBT,” “hope,” “change,” or whatever.  But money.

To protect as much of their wealth and status as they can, the elites have little choice but to scuttle their aspirational platitudes and learn to deal with it.

So there you have it — a view of the presidential election from the outside looking in. I think there’s food for thought here — and very possibly a look at where we’ll be in another nine months.

What do other readers think? Agree or disagree?  Please share your observations here.

The disappearing American middle class? The Pew Research Center weighs in.

mcIn this political season in the United States — when is it ever not, one wonders? — we hear many of the presidential candidates refer to the so-called “crisis” of the middle class.

It matters not the political party nor ideological stripe of the candidate, we hear copious references to “the disappearing middle class” … the “middle class squeeze” … and that the middle class is “just getting by.”

Considering that the middle class income group represent the single largest block of voters in the country, it isn’t at all surprising that the presidential contenders would talk about middle class issues — and to middle class voters — so frequently.

The question is … is the hand-wringing warranted?

PewWell, if one believes a new Pew Research study on the subject, it may well be the case.

Based on its most recent analysis of government data going back nearly 50 years, Pew reports that there are now fewer Americans in the “middle” of the economic spectrum than at the lower and upper ends.

This is a major development, and it is new.

Pew defines a middle class household as one with annual income ranging from ~$42,000 to ~$126,000 during 2014. Using that definition, Pew calculates that there are now 120.8 million adults living in middle class households, but 121.3 million who are living in either upper- or lower-income households.

Pew characterizes this new set of figures as a kind of tipping point. And it helps to underscore the narrative wherein certain presidential candidates — you-all know which ones — are tapping into a collective “angst” about the decline in middle-income families, and the notion that they are falling behind compared to upper-income adults while unable to access many of the support services available to lower-income households.

Looking at things in a bit more depth, however, one can find explanations — as well as other data points that go against the “narrative” to some degree. Consider the following:

  • Senior citizens have done quite well shifting into the upper category since the 1970s — their share increasing by well over 25% in the upper-income bracket.
  • African-Americans have experienced the largest increase in income status over the same period, meaning that their lower-income category share is lower today.
  • The rapid rise in the number of immigrants in the late 20th century has pushed down median incomes because those new arrivals, on average, make less in income.

I suspect the Pew study findings will be fodder for more discussion — and perhaps some additional sloganeering — in the upcoming weeks and months. But you can judge for yourself whether that’s warranted by reviewing more findings from Pew’s report here.

If you have your own perspectives about what’s happening with (or to) the middle class, I’m sure other readers would be quite interested in hearing them.  Please share your comments here.

“Immigration Nation”: Pew Research Projects U.S. Population Demographics into the Future

immigrantsI’ve blogged before about the immigration issue and its potential impact on the U.S. economy and society.

Now the Pew Research Center has released a report that predicts the U.S. becoming a “no ethnic majority” nation within the next 35 years.

When one considers that the United States population was nearly 85% white Anglo in 1965 … and that percentage has dropped to about 62% now, it isn’t that hard to imagine Pew’s prediction coming true.

Here’s the trajectory Pew predicts over the coming ten-year periods:

  • 2015: ~62% estimated U.S. white Anglo population percentage
  • 2025: ~58% projected white Anglo population percentage
  • 2035: ~56% projected
  • 2045: ~51% projected
  • 2055: ~48% projected
  • 2065: ~46% projected

Perhaps what’s more intriguing is that Pew projects the largest future percentage gains will be among Asian-Americans rather than Latino or Black Americans. The Asian share of the American population is expected to double over the period:

  • 2015: ~6% estimated U.S. Asian population percentage
  • 2025: ~7% projected Asian population percentage
  • 2035: ~9% projected
  • 2045: ~10% projected
  • 2055: ~12% projected
  • 2065: ~14% projected

If these projections turn out to be accurate, the Asian population percentage is on tap to become the nation’s third highest group.

By contrast, the Hispanic population, while continuing to grow, looks as if it will level off at about 22% of the country’s population by 2045. For Black Americans, Pew projects the same dynamics at work, but at the 13% level.

citizenship ceremonyAccording to Pew’s analysis, the biggest driving force for the projected Asian population growth is immigration. By 2055, Pew expects that Asians will supplant Latinos as the largest single source of immigrants — and by 2065 the difference is expected to be substantial (38% Asian vs. 31% Latino immigrants).

Conducted in parallel with Pew’s projection analysis was an online opinion research survey of American adults (18 and over) it conducted in March and April of this year.

Among the attitudinal findings Pew uncovered were these:

  • “Immigrants in the U.S. are making society better”: ~45% of respondents agree … ~37% disagree
  • “I would like to see a reduction in immigration”: ~50% agree
  • “I would like to see the immigration system changed or completely revamped”: ~80% agree

Again, no great surprises in these figures — although if one paid attention only to news accounts in the “popular media,” one might find it surprising to learn that a plurality of Americans actually consider immigration a net positive for American society …

Additional findings from the Pew survey as well as its demographic projections can be found here.

Social media data mining: Garbage-in, garbage-out?

gigoIt’s human nature for people to strive for the most flattering public persona … while confining the “true reality” only to those who have the opportunity (or misfortune) to see them in their most private moments.

It goes far beyond just the closed doors of a family’s household. I know a recording producer who speaks about having to “wipe the bottoms” of music stars — an unpleasant thought if ever there was one.

In today’s world of interactivity and social platforms, things are amplified even more — and it’s a lot more public.

Accordingly, there are more granular data than ever about people, their interests and their proclivities.

The opportunities for marketers seem almost endless. At last we’re able to go beyond basic demographics and other conventional classifications, to now pinpoint and target marketing messages based on psychographics.

And to do so using the very terms and phrases people are using in their own social interactions.

The problem is … a good deal of social media is one giant head-fake.

Don’t just take my word for it. Consider remarks made recently by Rudi Anggono, one of Google’s senior creative staff leaders. He refers to data collected in the social media space as “a two-faced, insincere, duplicitous, lying sack of sh*t.”

Anggono is talking about information he dubs “declared data.” It isn’t information that’s factual and vetted, but rather data that’s influenced by people’s moods, insecurities, social agenda … and any other set of factors that shape someone’s carefully crafted public image.

In other words, it’s information that’s made up of half-truths.

This is nothing new, actually. It’s been going on forever.  Cultural anthropologist Genevieve Bell put her finger on it years ago when she observed that people lie because they want to tell better stories and to project better versions of themselves.

What’s changed in the past decade is social media, of course.  What better way to “tell better stories and project better versions of ourselves” than through social media platforms?

Instead of the once-a-year Holiday Letter of yore, any of us can now provide an endless parade of breathless superlatives about our great, wonderful lives and the equally fabulous experiences of our families, children, parents, A-list friends, and whoever else we wish to associate with our excellent selves.

Between Facebook, Instagram, Pinterest and even LinkedIn, reams of granular data are being collected on individuals — data which these platforms then seek to monetize by selling access to advertisers.

In theory, it’s a whole lot better-targeted than the frumpy, old fashioned demographic selects like location, age, income level and ethnicity.

But in reality, the information extracted from social is suspect data.

This has set up a big debate between Google — which promotes its search engine marketing and advertising programs based on the “intent” of people searching for information online — and Facebook and others who are promoting their robust repositories of psychographic and attitudinal data.

There are clear signs that some of the social platforms recognize the drawbacks of the ad programs they’re promoting — to the extent that they’re now trying to convince advertisers that they deserve consideration for search advertising dollars, not just social.

In an article published this week in The Wall Street Journal’s CMO Today blog, Tim Kendall, Pinterest’s head of monetization, contends that far from being merely a place where people connect with friends and family, Pinterest is more like a “catalogue of ideas,” where people “go through the catalogue and do searches.”

Pinterest has every monetary reason to present itself in this manner, of course.  According to eMarketer, in 2014 search advertising accounted for more than 45% of all digital ad spending — far more than ad spending on social media.

This year, the projections are for more than $26 billion to be spent on U.S. search ads, compared to only about $10 billion in the social sphere.

The sweet spot, of course, is being able to use declared data in concert with intent and behavior. And that’s why there’s so much effort and energy going into developing improved algorithms for generating data-driven predictive information than can accomplish those twin goals.

Rudi Anggono
Rudi Anggono

In the meantime, Anggono’s admonition about data mined from social media is worth repeating:

“You have to prod, extrapolate, look for the intent, play good-cop/bad-cop, get the full story, get the context, get the real insights. Use all the available analytical tools at your disposal. Or if not, get access to those tools. Only then can you trust this data.”

What are your thoughts? Do you agree with Anggono’s position? Please share your perspectives with other readers here.

TV’s Disappearing Act

Television viewing among 18- to 24-year-olds reaches its lowest level yet. 

TV watchingThe latest figures from Nielsen are quite telling:  The decline in TV watching by younger viewers is continuing – and it’s doing so at an accelerating pace.

Looking at year-over-year numbers and taking an average of the four quarters in each year since 2011, we see that the average number of hours younger viewers (age 18-24) spend watching television has been slipping quite dramatically:

  • 2011: ~24.8 hours spent watching TV weekly
  • 2012: ~22.9 hours
  • 2013: ~22.0 hours
  • 2014: ~19.0 hours

It’s nearly a 25% decline over just four years.  More significantly, the most recent yearly decline has been at a much faster clip than Nielsen has recorded before:

  • 2011-12 change: -7.7%
  • 2012-13 change: -3.9%
  • 2013-14 change: -13.6% 

So far this year, the trend doesn’t appear to be changing.  1st quarter figures from Nielsen peg weekly TV viewing by younger viewers at approximately 18 hours.  If this level of decline continues for the balance of the year, watching TV among younger viewers will be off by an even bigger margin than last year.

There’s no question that the “great disappearing television audience” is due mainly because of the younger generation of viewers.  By contrast, people over the age of 50 surveyed by Nielsen watch an average of 47.2 hours of television per week — nearly three times higher.

picLest you think that the time saved by younger viewers is going into outdoor activities or other recreational pursuits and interests, that’s certainly not the case.  They’re spending as much time using digital devices (smartphones, tablets and/or PCs) as they are watching TV.

So, it’s a classic case of shifting within the category (media consumption), rather than moving out of it.

I don’t think very many people are surprised.

Gallup’s Payroll-to-Population Rates Pinpoint the Go-Go Metro Areas

Commuters in New York City.

The Gallup polling organization’s P2P measurements (payroll-to-population employment rates) are an interesting metric and add an extra dimension of understanding as to what’s happening with employment across the United States.

Gallup’s evaluation is limited to the top 50 most populous SMSAs (metropolitan statistical areas).  But because of the large number of phone interviews conducted within each metro area (ranging from ~1,300 to 18000+ depending on the population), the findings are statistically significant whether looking nationally or within a particular urban area.

The latest surveys, conducted by Gallup in 2014 among nearly 355,000 households, find that two metro areas with the highest P2P measures are Washington, DC and Salt Lake City, UT — urban centers that couldn’t be more dissimilar in other ways.

For DC, the P2P rate is 54.1.  The calculation is derived from the percentage of the adult population (age 18+) who are employed full-time for an employer for at least 30 hours per week.

For Salt Lake City, the P2P rate is just slightly lower, at 52.9.

Other top scoring metro areas include three markets in Texas (Austin, Dallas-Ft. Worth and Houston).

What about metro areas at the other end of the scale?  Those would be Miami (38.2 score) and Tampa (39.3).

Three other low-scoring MSAs are located in California:  Los Angeles, Riverside and Sacramento.

What do these stats mean in a broader sense?

For one thing, there’s a direct relationship between employment stats and P2P performance:  Metro areas with the highest unemployment rates correlate to those with low P2P scores.

For instance, Miami’s unemployment rate in 2014 was 10.3%.  It was 10.2% in Riverside, CA.

That’s a big contrast with Salt Lake City, which had an unemployment rate of just 3.5%.

I find one interesting deviation from the norm:  Buffalo, NY.  There, while the unemployment rate is one of the ten lowest in the country, its labor force participation rate is also very low — bottoms among all 50 metro areas, in fact.

Shown below are the figures for all of the 50 largest U.S. metro areas based on the interviews conducted by Gallup in 2014:

Gallup full results

More details on the research findings are available here.

Gallup Confirms It: Kids are Costly

childAnyone who has children – present company included – knows intuitively that raising them isn’t an inexpensive proposition.

The education expenses alone are enough to make some people blanch white at the prospects of child-rearing.

And now we have even more proof of the high cost of having kids. The Gallup organization has just completed a telephone survey of a large sample of American adults age 18 and over – more than 172,000 of them, in fact.

When Gallup asked these respondents how much they spent on purchases “yesterday” (excluding normal household bills and major purchases), it discovered that those without kids under age 18 reported average daily spending of ~$80.

For those with children under the age of 18? They spent ~$110 on average.

So it’s a pretty significant difference of 35%+ more.

Gallup found similar dynamics at work even when comparing adults within the same income groups.

In every income segment, average daily spending levels were lower for adults with no children … spiked for those with kids under 18 … and then dropped back again when children are over the age of 18.

The reasons for the added spending aren’t difficult to figure out, of course. In addition to basic necessities like food and clothing, there are entire categories of spending that come into play for families raising children: extracurricular activities, athletics and sports, entertainment, toys and so forth.

Gallup also discovered similar “bell curve dynamics“ at work when comparing adults within the same age groups. Whether you’re younger or older, your daily spending rises when you have kids under age 18, then drops back down again.

The bottom line: Having kids is costly.  But they sure do make life interesting, don’t they?

For more Gallup survey results, click here.

To understand changes in U.S. demographics … check right at home first.

American HouseholdsJust because the housing bubble of the mid-2000s resulted in foreclosures, a down economy, and more young people moving back in with Mom and Dad … don’t believe that more fundamental demographic changes aren’t continuing to have a long-term effect as well.

This is underscored by newly published data on American households issued by the U.S. Bureau of Census, which breaks down statistics on the more than 121 million households in the United States.

As of 2012, the average size of the U.S. household stood at 2.55 people.  That’s a decline of about one person per household since 1950.

What’s contributed the most to the decline of this average has been the increase in single-person households.  According to the Census Bureau, those households now account for more than a quarter of all households in the country:

  • One-person households:  ~27% of total U.S. households
  • Two-person HHs:  ~34%
  • Three-person HHs:  ~16%
  • Four-person HHs:  ~13%
  • Five-person HHs:  ~6%
  • Six-person HHs:  ~2%
  • Seven or more persons per household:  ~1%

In fact, the number of single-person households has gone up five-fold since 1960.  A major part of the reason is the large percentage of older Americans (age 75+) who live alone – more than half.

That compares to only a quarter of households headed by people under the age of 30.

Other interesting factoids from the Census Bureau stats reflect some of the changing social mores in American society:

  • There are nearly 8 million unmarried couples living together – more than double the figure less than a decade ago.  (It was ~2.9 million in 1996).
  • Married households now make up fewer than half of all households.  (In 1970, that percentage was over 70%.)

But one demographic statistic does seem to reflect the consequences of the recent economic recession and the contraction in the American labor force:  As of 2012, only ~52% of married couples have both spouses in the labor force, which is down from ~56% reported in 2000.

United States Bureau of CensusThese new stats come from the U.S. Census Bureau’s latest Annual Social & Economic Supplement to the Current Population Survey, the data for which was collected  in March and April 2012 from a nationwide sample of approximately 100,000 addresses.

You can view additional findings here.

Experian Takes the Pulse of Hispanics in the United States

Hispanic Market Report from ExperianIt’s no secret that the share of the American population identifying itself as Hispanic or Latino is growing.

The latest evidence of this is a report just released by Experian Marketing Services. It shows that ~16% of Americans age 6 and older fall into this category.

That’s an increase of two percentage points in just six years.

But here’s an even more eyebrow-raising statistic: Among Americans aged 6 to 34, nearly one in four are Hispanic or Latino.

What this means is that the geographic zones of the country usually associated with Hispanic population – California and the Southwest, Central and South Florida, Chicagoland, and New York City/Northern New Jersey – will surely expand to encompass other geographic clusters as well.

Experian’s research also shows that Hispanic households account for approximately 10% of all discretionary spending in the U.S.

But in select metropolitan areas, the share of spending by Hispanic households is greater — sometimes substantially so:

  • San Antonio Metro Area: ~60% Hispanic share of all HH discretionary spending
  • Miami: ~37%
  • Los Angeles: ~33%
  • Houston: ~17%
  • San Francisco: ~14%
  • Chicago: ~12%
  • New York: ~12%
  • Dallas: ~11%

While the country now has many second- and third-generation Hispanic individuals and families, the Experian research finds that even with these consumers, emotional ties to the Spanish language carry over to companies that advertise their brands in Spanish.

Not surprisingly, more than half of Spanish-dominant Hispanics agreed that when they hear a company advertise in Spanish, “it makes me feel like they respect my heritage and want my business.”

But among English-dominant Hispanics, ~30% feel the same way as well. And similar percentages feel a much greater sense of loyalty to such companies.

There’s another interesting takeaway from the Experian research, too. Hispanic consumers tend to be more optimistic about their personal financial situation – and that of America as a whole – than their non-Hispanic counterparts.

This sense of greater optimism has been a common thread among all Experian surveys of this type, where the research has shown a persistent positive margin with Hispanics of about five index points over the rest of the survey sample.

That level of optimism is refreshing to see!