

The Gallup polling organization’s P2P measurements (payroll-to-population employment rates) are an interesting metric and add an extra dimension of understanding as to what’s happening with employment across the United States.
Gallup’s evaluation is limited to the top 50 most populous SMSAs (metropolitan statistical areas). But because of the large number of phone interviews conducted within each metro area (ranging from ~1,300 to 18000+ depending on the population), the findings are statistically significant whether looking nationally or within a particular urban area.
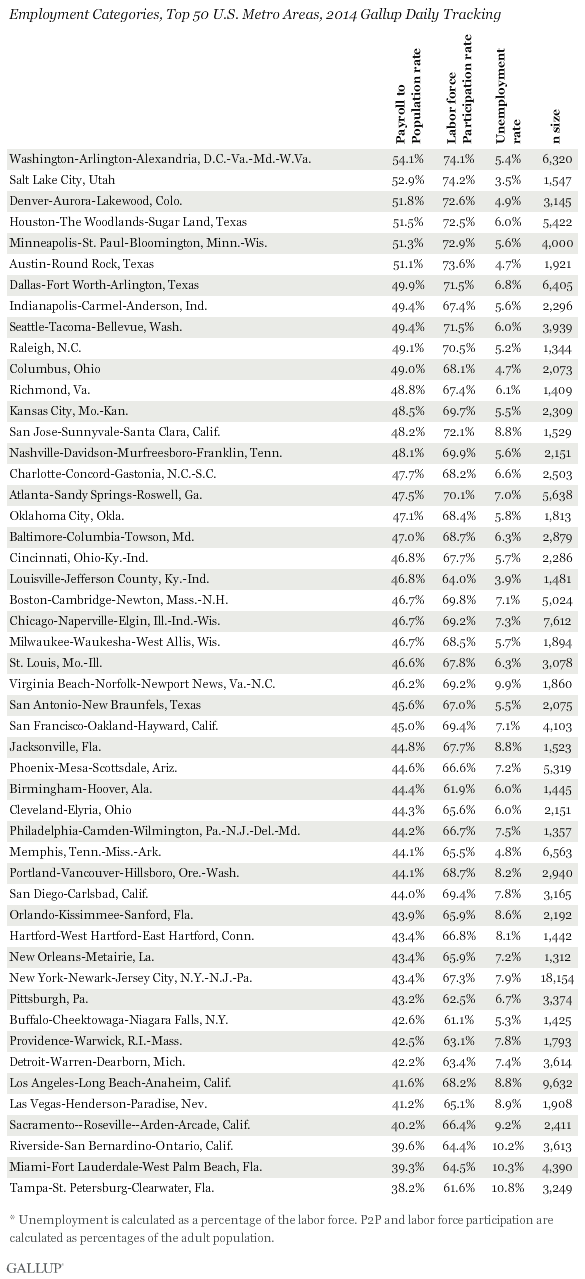
The latest surveys, conducted by Gallup in 2014 among nearly 355,000 households, find that two metro areas with the highest P2P measures are Washington, DC and Salt Lake City, UT — urban centers that couldn’t be more dissimilar in other ways.
For DC, the P2P rate is 54.1. The calculation is derived from the percentage of the adult population (age 18+) who are employed full-time for an employer for at least 30 hours per week.
For Salt Lake City, the P2P rate is just slightly lower, at 52.9.
Other top scoring metro areas include three markets in Texas (Austin, Dallas-Ft. Worth and Houston).
What about metro areas at the other end of the scale? Those would be Miami (38.2 score) and Tampa (39.3).
Three other low-scoring MSAs are located in California: Los Angeles, Riverside and Sacramento.
What do these stats mean in a broader sense?
For one thing, there’s a direct relationship between employment stats and P2P performance: Metro areas with the highest unemployment rates correlate to those with low P2P scores.
For instance, Miami’s unemployment rate in 2014 was 10.3%. It was 10.2% in Riverside, CA.
That’s a big contrast with Salt Lake City, which had an unemployment rate of just 3.5%.
I find one interesting deviation from the norm: Buffalo, NY. There, while the unemployment rate is one of the ten lowest in the country, its labor force participation rate is also very low — bottoms among all 50 metro areas, in fact.
Shown below are the figures for all of the 50 largest U.S. metro areas based on the interviews conducted by Gallup in 2014:
More details on the research findings are available here.
