Suddenly, the conflict between Google and the European Union countries regarding the censoring of search results has taken on even wider worldwide proportions.
This past week, the courts have upheld the French government’s data protection office (CNIL) order for Google to broaden the “right to be forgotten” by censoring search results worldwide — not just in Europe.
Google had appealed the initial CNIL ruling.
The CNIL rejected Google’s argument that a worldwide implementation of the European standard of censoring search results would mean that the Internet would be only as free as the “least free place.” (Think Belarus or Syria.) But in its ruling, the CNIL noted that a country-by-country implementation of the “right to be forgotten” would mean that the right could be circumvented too easily.
While it’s true that more than 95% of Google searches in Europe are performed via European versions of the company’s search engine tool, such as google.fr and google.co.uk, identical searches can be performed easily using google.com, meaning that anyone trying to find “forgotten” information on an individual can do so easily, irrespective of the European standard.
As I blogged back in May, The European Court of Justice’s 2014 ruling meant that Google is required to allow residents of EU countries to delete links to certain harmful or embarrassing information that may appear about themselves in Google search results.
The directive has turned into a real thicket of challenges for Google.
What the definition of “harmed and embarrassing” is is somewhat amorphous, as the court’s ruling encompassed links to information ranging from excessive and harmful on one end of the scale all the way down to links that are merely outdated, inadequate or irrelevant.
Since the ruling went into effect, Google has had to field requests to remove more than one million links from European search results.
Link removal isn’t accomplished via some sort of “bot” procedure. Instead, each request is considered on a case-by-case basis by a panel of arbiters made up of attorneys, paralegals and search engineers.
Approximately one-third of the links in question have been removed following panel review, while about half have remained in search results.
The rest – the real toughies – are still under review, and their status as yet unresolved.
Obviously, for this activity to spread from covering just European search engines to include potentially the entire world isn’t what Google has in mind at all. (If Google could have its way, doubtless the whole notion of “the right to be forgotten” would be off the table.)
But the situation is getting pretty hot now. French authorities imposed a 15-day compliance deadline, after which Google could be fined nearly US$350,000.
Of course, the amount of that penalty pales in comparison to the cost Google would incur to comply with the directive.
But that fine is just the opening salvo; there’s no telling what the full degree of financial penalties might turn out to be for continued non-compliance.
I wrote before that it’s difficult to know where the world will eventually end up on the issue of censoring search engine results. Today, I don’t think we’re anywhere closer to knowing.
Most of us know at least some people who seem to be on their mobile devices constantly. And now their total numbers have been quantified.
Bank of America has teamed up with Yahoo! research firm Flurry Analytics to publish a Consumer Mobility Report. The one published last month is the second such yearly report.
The BofA/Flurry analysis breaks down three categories of mobile device users: those who it characterizes as “regular users” … “super users” … and “mobile addicts.”
The classifications are defined as follows:
Regular Users: People who launch mobile applications 1 to 16 times per day
Super Users: Those who launch apps 16 to 60 times per day
Mobile Addicts: Those who launch apps more than 60 times per day
According to the study, using these criteria there are ~280 million people around the world who qualify as Mobile Addicts — and that figure is up sharply since 2014 (by nearly 60%).
By comparison, Super Users represent slightly under 600 million people, while Regular Users are still the lion’s share at ~985 million.
So, while a distinct minority, the number of Mobile Addicts is actually quite high — and it’s growing much faster than the other two segments.
It certainly helps us understand why we’re seeing mobile addiction-like behavior seemingly everywhere we look.
The BofA/Flurry study also delved into the major categories of apps that Mobile Addicts are using, and found that their usage levels are higher across all of these categories.
The five most popular categories for Mobile Addicts are topped by messaging and social platforms, which represent the biggest usage compared to other mobile phone consumers:
Messaging and social index: 556 (used 5.56 times more than the average mobile device consumer)
For those of us who spend practically every living minute of our day online, it seems almost unbelievable that there are actually some people in the United States who simply never go online.
The Pew Research Center has been researching this question for the past 15 years. And today, the percentage of “offline American adults” (people age 18 or over who don’t use the Internet) remains stuck at around 15% — a figure that has been stubbornly consistent for the past three years or so:
But up until then, the percentage had been declining, as can be seen in these milestone Pew survey years:
2000: ~48% of American adults not using the Internet
2005: ~32% not using
2010: ~24% not using
2015: ~15% not using
Part of the long-term shift has been new people interfacing with the Internet. But another factor is simply the “aging out” of older populations as they pass from the scene.
The demographic dynamics Pew finds on Internet usage show relatively little difference in behavior based on ethnicity — except that only about 5% of Asian-Americans never go online.
Rather, it’s differences in age particularly — but also in income levels and education levels — that are more telling.
The age breakdown is stark, and shows that at some point, we are bound to have near-total adoption of the Internet:
Age 18-29: ~3% don’t use the Internet
Age 30-49: ~6% don’t use
Age 50-64: ~19% don’t use
Age 65+: ~39% don’t use
Income levels are also a determining factor when it comes to Internet usage:
Less than $30,000 annual household income: ~25% don’t use the Internet
30,000 – 50,000 annual HH income: ~14% don’t use
$50,000 – $75,000 annual HH income: ~5% don’t use
Over $75,000 annual HH income: ~3% don’t use
And Pew also finds significant differences based on the amount of formal education:
Some high-school level education: ~33% don’t use the Internet
High school degree: ~23% don’t use
Some college: ~9% don’t use
College graduate or post-graduate education: ~4% don’t use
Lastly, while no difference in Internet usage has been found between urban and suburban Americans, the adoption rate in rural areas continues to lag behind:
Urban dwellers: ~13% don’t use the Internet
Suburban residents: ~13% don’t use
Rural areas: ~24% don’t use
One reason for the lower adoption rate in rural areas may be limited Internet access or connectivity problems — although these weren’t one of the key reasons cited by respondents as to why they don’t go online. Pew’s research has found these points raised most often:
Have no interest in using the Internet / lack of relevance to daily life: ~34%
The Internet is too difficult to use: ~32%
The expense of Internet service and/or owning a computer: ~19%
The results of Pew’s latest survey, which queried ~5,000 American adults, can be viewed here. Since the research is conducted annually, it will be interesting to see if Internet usage resumes its drive towards full adoption, or if the ~85% adoption rate continues to be a “ceiling” for the foreseeable future.
According to poll of consumers conducted for Google, more people are concerned about their identity being stolen or their accounts being hacked than someone breaking into their home.
Clearly, people are highly sensitized to the issue of identity theft and various forms of online mischief. The question is, how good are we in protecting ourselves against these threats?
Further Google analysis has determined that the biggest threats come from so-called “manual hijacking,” in which nefarious attackers spend significant time exploiting a single victim, with the near-inevitable result of financial losses.
The incidence of manual hijacking is rare — about nine incidences per million users per day. But the damage can be severe.
The most common way attackers gain illicit access to online accounts is through phishing — sending deceptive e-messages designed to trick recipients into divulging their user names, passwords, and related personal information.
Unfortunately, phishing attacks are working more effectively than people would care to admit.
The most effective attacks — the ones that “look and feel” legitimate — are successful in getting people to act about 45% of the time — typically going to a fake but all-too-genuine-looking web page impersonating a “real” vendor, where the unsuspecting “phishee” is asked to provide personal information.
Incredibly, Google finds that nearly 15% of the people who go to those sites actually end up divulging their personal information.
Then it’s off to the races for the bad guys. Google’s findings show that approximately 20% of the compromised accounts are accessed within 30 minutes of the login information being nabbed.
And the breach isn’t for a just a few seconds, as some people erroneously believe. In actuality, the average amount of time spent trolling around inside an unsuspecting owner’s account is more than 20 minutes. You can bet that those 20 minutes aren’t being spent wandering around “just looking”!
The kinds of things happening inside of those 20 minutes include changing passwords to lock true owners out of the site, searching for pertinent information such as credit card data, SSNs, bank relationships data including account numbers and balances — and even social media account data.
Not only is this information used to fleece the target individual in question, but also to launch new attacks against other people who are discovered within the compromised individual’s own sphere of contacts.
These subsequent phishing attacks are often successful because they appear to be completely legitimate — communications coming from friends or relatives.
Not just successful, but really successful: Google estimates that people targeted from the contact lists of hijacked accounts are more than three times more likely to be successfully hacked themselves.
Keeping a healthy vigilance is what’s required to stymie these “manual hijacking” efforts. My own approach is to delete anything that comes from a purported “known” source if I’m not expecting the e-mail beforehand, without opening it. I figure if it’s important enough, the sender will get in touch with me a second time or in some other fashion.
If I’m particularly suspicious, I might also visit the sender’s website directly (through the web address I already have on file) to see if there’s any corroborating evidence that there is a legitimate attempt to get in touch with me.
The way I figure it, the minor inconvenience and/or delay in conducting business in this fashion is far less problematic than the potentially disastrous consequences associated with identity theft or account hijacking.
Unfortunately, there’s no indication at all that these kinds of “manual hijacking” activities will start declining anytime soon. It’s a very lucrative business for the perpetrators, because even a very small percentage of accounts compromised in this manner represents significant dollars when you consider how many millions of phishing messages are being sent out by these hijackers on the front end.
What are your strategies for counteracting phishing attempts? Please share your thoughts with other readers.
Over the years, I’ve noticed how signature blocks at the bottom of business e-mails have been getting longer and more elaborate.
Remember the days of simply showing an office address, phone, FAX and e-mail? That disappeared a long time ago.
Why it’s happened is all a function of the many ways people can and do choose to communicate today.
For folks in the marketing and sales field, sometimes the contact options go overboard. Not long ago, I received an e-mail pertaining to a business service pitch. Here’s what the sender had included in the signature area at the bottom of his e-mail message:
If you’re a phone person, here’s my mobile number:
If you’re a text person, send a message to my cell:
If you’re an email person, here’s my address:
If you’re an instant message person, here’s my Google ID:
If you’re a Skype person, here’s my handle:
If you’re a Twitter person, here’s my username:
If you’re a Facebook person, here’s my page:
If you’re a face-to-face person, here’s my office location:
The only thing missing was Pinterest, and a FAX number …
Seeing this signature block was a stark reminder of the myriad ways people are connecting with their business and personal contacts.
Nothing new in that, of course — but seeing it presented in one big bundle really drove the point home.
Scott Ginsberg
Later, I discovered that this litany of contact options was first popularized four or five years ago by the business author and blogger Scott Ginsberg. Evidently, others have now picked up and run with the same concept.
Taken together, it’s no wonder people feel busier today than ever before, despite all of the ways in which digital technology purports to simplify communication and make it more efficient.
I wouldn’t want to go back to the old days … but at times, there’s a certain attraction to the idea of not having to be “always on” in “so many places,” no?
It’s only natural for Americans to be somewhat spooked about what’s happening in the financial markets, what with thousand-point drops on the stock exchanges and all.
It’s even more disconcerting to realize that the forces in play are ones that have little to do with the American economy and a lot more to do with Europe and China. (China in particular, where bubbles seem to be bursting all over the place with the fallout being felt everywhere else.)
In times like this, I seek out the thoughts and perspectives of my brother, Nelson Nones, an IT specialist and business owner who has lived and worked outside the United States for nearly 20 years — much of that time spend in the Far East.
To me, Nelson’s thoughts on world economic matters are always worth hearing because he has the benefit of weighing issues from a global perspective instead of simply a more parochial one (like mine).
Nelson Nones
Yesterday, I had the opportunity to ask Nelson a few questions about what’s happening in the Chinese economy, how it is affecting the U.S. economy, and what he sees coming down the road. Here are his perspectives:
PLN: What is your view of the Chinese economy — and what does the future portend?
NMN: I’m a real pessimist when it comes to the current state of the Chinese economy. I also think the Chinese will turn on themselves politically as their economic house of cards is collapsing — so look for a sharp upturn in political and social turmoil as well.
Just as the bubble burst in the U.S. and Europe in 2007-08, it’s bursting now in China — and the rest of East Asia (South Korea, Japan, Thailand and Singapore) are going to get caught in the fallout because of the extent to which their economies are reliant on trade with China.
PLN: What do you look at, specifically, for clues as to future economic movements?
NMN: The barometer to watch is the price of oil. It plummeted in 2007, presaging the “great recession” in the West.
Oil prices began to drop again in 2014. The U.S. oil benchmark fell below $40 per barrel on August 24, 2015, a level not seen since 2009. I believe the underlying root cause is a sharp contraction of East Asian demand due to the economic bubbles bursting over here, coupled with persistently high supply as Middle Eastern oil exporters compete against American producers to protect market share.
PLN: How will these developments affect the U.S. economy?
NMN: The oil bust will continue in the U.S., dragging the economy down. But energy prices will be lower, buoying other parts of the American economy. For instance, the domestic airline sector will benefit and consequential demand for Boeing jets will grow.
U.S. imports — specifically, imports from China and the rest of East Asia — will become cheaper as China and other countries allow their currencies to fall in order to protect their exports.
This is probably a “net-neutral” for the US economy in that American exports will be hurt due to the relatively stronger U.S. Dollar, but American consumers will benefit from lower prices. So, the direct economic impact is likely to be mixed.
PLN: So, why worry?
NMN: The real risk, in my opinion, is a global liquidity crisis. Over the past quarter-century, China and other East Asian countries have accrued enormous wealth. But they didn’t hoard their newfound wealth; they invested it both domestically and overseas.
China has invested ginormous amounts of cash in domestic infrastructure and housing. That money is already spent, and a sizeable part of the investment has already gone to waste in the form of corruption, new housing that nobody wants, underutilized transport infrastructure and non-performing loans made to inefficient state-owned enterprises.
All of this will eventually need to be written off (that’s why their bubble is bursting).
But China has also invested lots of money in overseas financial instruments. Think of the Chinese as the folks who financed the Federal Reserve’s Quantitative Easing program as well as Federal debt in the U.S. But as the Chinese run out of cash at home, they will increasingly need to liquidate their overseas investments just to pay their bills.
This poses a very real threat to the fiscal stability of U.S. and European governments, and to the supply of capital in U.S. and European financial markets.
The Federal Reserve is likely to be caught in a double-bind. On the one hand, if the Fed raises interest rates in response to the reduced supply of capital (as it is widely assumed they will, later this year), they risk choking off the tepid U.S. recovery currently underway.
This would also cause the U.S. Dollar to strengthen further, thereby exacerbating the negative impact of the Chinese bust by making U.S. exports less competitive in global markets.
On the other hand, if the Fed leaves interest rates where they are (basically zero), then they won’t be able to attract enough capital to roll over the public debt that the Chinese are trying to liquidate. In other words, the Fed risks a “run on the bank.”
The Fed can deal with this by printing more money (more or less what the Chinese did in 2007-8), but this would inevitably introduce inflationary pressures in the U.S. It would also lengthen the time it takes for the Chinese to right their ship, because it will put downward pressure on the U.S. Dollar, thereby constraining whatever the East Asians can do to boost exports.
My guess is that the Federal Reserve will “blink” and keep interest rates at zero (and also print more money to pay off the Chinese) in hopes that (somewhat) cheaper imports will offset (some of) the inflationary impact of printing more money.
This is equivalent to kicking the can down the road.
PLN: Do you see any impact on the 2016 Presidential race in the United States?
NMN: As a result of kicking the can down the road, I foresee little impact on the 2016 U.S. Presidential race — but watch out in 2020 when the hangover is well underway.
Alternatively if the Fed raises interest rates, I suspect the Democratic Party candidate will be more vulnerable because the short-term economic pain will be much higher in the U.S. The incumbent party will get most of the blame. Fair or not, that’s just the way bread-and-butter issues play out in American politics.
PLN: What about unrest in China — might that have political repercussions in America?
NMN: The way I see it, political or social turmoil in China will have zero impact on the U.S. Presidential race. Americans of nearly every political stripe or ideology dislike or distrust Chinese governance, yet unlike the “China lobby” of the Cold War era, they have no appetite to intervene in what they rightly perceive to be internal Chinese affairs.
Or they’re clueless about events in East Asia. Or they just don’t care.
So there you have it — a view from the Far East. If you have other perspectives, please share them with our readers here.
______________
Update (8/28/15): A few days after this post was uploaded, I received this follow-up from Nelson:
Just as I had predicted, check out this link. Federal debt is getting more expensive to finance, because the drop in demand for U.S. Treasury bonds (caused by the Chinese liquidation apparently underway) is driving yields up. According to the article, “The liquidation of such a large position, if it continues, could wreak havoc on the Treasuries market.”
Now look here: http://www.bloombergview.com/quicktake/federal-reserve-quantitative-easing-tape. It’s an easily understandable explanation of how the Federal Reserve’s quantitative easing (QE) program worked. Essentially the Fed, like China, stepped in to buy Treasuries also. The Fed also bought mortgage-backed securities.
The Fed’s purchases of Treasuries and mortgage-backed securities now make up ~85% of the Fed’s assets. The Fed hasn’t indicated what it will do when these assets mature, but if it doesn’t roll over this debt (or a portion thereof) then we can expect Treasury yields to rise yet again. Even if the Fed decides to keep interest rates where they are, at near-zero, rising Treasury yields could bring on a liquidity crunch within the private sector as capital is increasingly drawn away from private investments (loans, corporate bonds and equities) to government-issued bonds paying higher yields with little risk.
Facing the Chinese liquidation, this is why I suspect the Fed will opt to roll over its holdings of Treasuries and mortgage-backed securities, and keep interest rates at near-zero, at least through the 2016 Presidential election cycle. The Bloomberg article cited above describes QE as an alternative to printing more money, but in the end it’s really the same thing.
The scandal involving the security risk to U.S. State Department e-mails is just the latest in a long list of news items that are bringing the potential dangers of cyber-hacking into focus.
In the realm of marketing and public relations, recent breaches of PR Newswire and Business Wire data gave hackers access to pre-release earnings and financial reports that have been used to enrich nefarious insider traders around the world to the tune of $100 million or more in ill-gotten gains.
These and other events are occurring so regularly, it seems that people have become numb to them. Every time one of these news items breaks, Instead of sparking outrage, it’s a yawner.
But Jane LeClair, COO of the National Cybersecurity Institute at Excelsior College, is pleading for an organized effort to thwart the continuing efforts — one of which could end up being the dreaded “Cyber Pearl Harbor” that she and other experts have warned us about for years.
“We certainly can’t go on this way — waiting for the next biggest shoe to drop when hundreds of millions — perhaps billions — will be looted from institutions … It’s time we stopped making individual efforts to build cyber defenses and started making a collective effort to defeat … the bad actors that have kept us at their mercy,” LeClair contends.
I think that’s easier said than done.
Just considering what happened with the newswire services is enough to raise a whole bevy of questions:
Financial reports awaiting public release were stored on the newswires’ servers … but what precautions were taken to protect the data?
How well was the data encrypted?
What was the firewall protection? Software protection?
What sort of intruder detection software was installed?
Who at the newswire services had access to the data?
Were the principles of “least privilege access” utilized?
How robust were the password provisions?
In the case of the newswire services, the bottom-line explanation appears to be that human error caused the breaches to happen. The attackers used social engineering techniques to “bluff” their way into the systems.
Mining innocuous data from social media sites enabled the attackers to leverage their way into the system … and then use brute force software to figure out passwords.
Once armed with the passwords, it was then easy to navigate the servers, investigating e-mails and collecting the relevant data. The resulting insider trading transactions, made before the financial news hit the streets, vacuumed up millions of dollars for the perpetrators.
Now the newswire services are stuck with the unenviable task of attempting to “reverse engineer” what was done — to figure out exactly how the systems were infiltrated, what data was taken, and whether malicious computer code was embedded to facilitate future breaches.
Of course, those actions seem a bit like closing the barn door after the cows have left.
I, for one, don’t have solutions to the hacking problem. We can only have faith in the experts inside and outside the government for determining those answers and acting on them.
But considering what’s transpired in the past few months and years, that isn’t a particularly reassuring thought.
Would anyone else care to weigh in on this topic and on effective approaches to face it head-on?
Public colleges and universities (out-of-state residents): ~$23,000
Public colleges and universities (in-state residents): ~$9,100
Community colleges: ~$3,300
In fact, the difference between the highest and lowest cost averages comes out to a factor of ten.
Averages are more difficult to calculate for online college institutions, where the annual cost ranges widely from as low as $5,000 all the way up to $25,000 or so, according to The Guide to Online Schools.
With such a disparity in college education costs, one might think that public perceptions of the value of the degrees granted by them would likewise show differences based on the type of institution.
But a recently completed national opinion study tells us otherwise. A telephone research survey conducted in June 2015 by the Gallup organization queried ~1,500 Americans age 18 or over about their attitudes toward college education.
Among the most interesting findings is the perception of community colleges: Two-thirds of the respondents rate the quality of education that community colleges offer as “excellent” or “good.”
For four-year colleges, the percentage figure for excellent/good quality was only slightly higher: ~70%.
Considering the vast difference in the financial outlay required to attend a four-year school, community college education is looking mighty attractive, indeed.
Tempering this finding are the Gallup survey’s respondents who possessed advanced degrees themselves. They’re more likely to rate four-year institutions higher than community colleges on quality (a nine percentage point difference).
And of course, community colleges do face challenges such as their track record on lower graduation rates, plus the sometimes challenging process and procedures in successfully transitioning students from two-year to four-year schools.
Still, the perception of near-parity in education quality is striking — and it’s not very different from the findings Gallup has observed since beginning to survey the American public on this topic two years ago.
I don’t doubt that some families will be sharpening their pencils and doing new cost/benefit calculations based on the results of this Gallup survey.
But where a perceived difference in quality continues to persist is in online education. Survey respondents were about half as likely to rate the quality of Internet-based college programs as “excellent” or “good.”
While respondents don’t fault online programs for lacking a broad curriculum, or even for the value provided for the cost of enrolling, online education is seen as lacking strength in three key areas:
Reliable testing and grading
The quality of instruction
The value of the degree to prospective employers
But there’s another way to look at it. Internet-based higher education is slipping through the door and becoming “mainstream” not just because of the online programs such as those offered by Capella University and the University of Phoenix, but because of the burgeoning online coursework being offered by traditionally brick-and-mortar institutions.
With that growing practice, I predict it’s only a matter of time before the perception of online higher learning will match the higher ratings that are already being given to community colleges, public and private institutions.
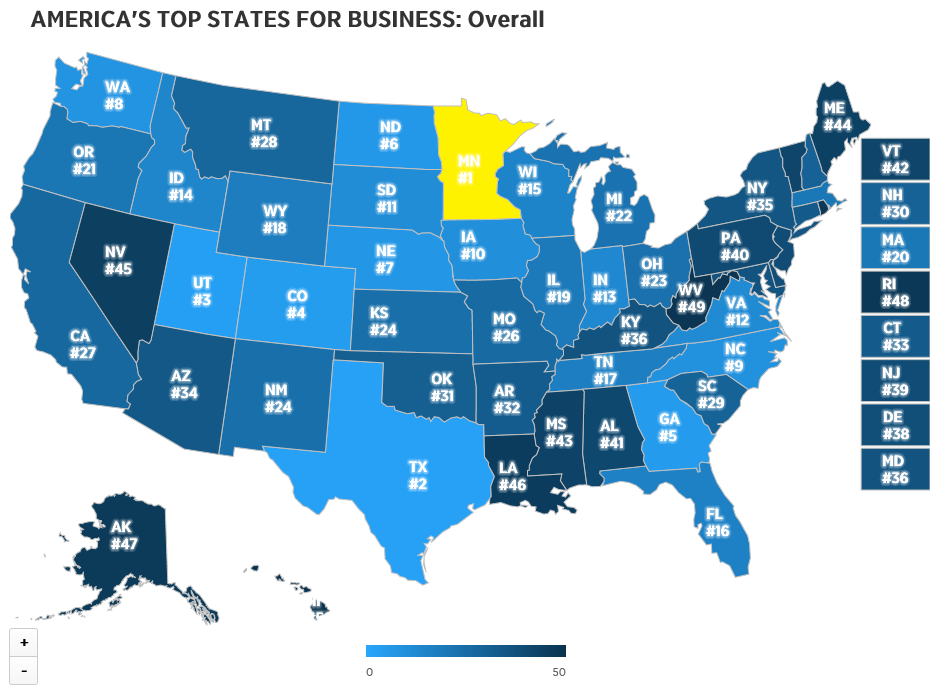
In CNBC’s recently published scorecard, don’t look to the Northeast or California to find the states that are best ones for business.
L’Etoile du nord: Just as in its state motto “Star of the North,” Minnesota is the stellar performer in CNBC’s 2015 state ranking of business competitiveness. (Click on the map for a larger view.)
State and city rankings are a source of fascination for many people. Of course, there are many ways to fashion them to place nearly any state or city you like at the top of the heap. Some of the lists use criteria that are so convoluted, it stretches credulity.
Since when is Baltimore the best city in America for single men? Since it was ranked #1 in this evaluation, evidently. Many of us who know the city’s innards really well would disagree heartily, of course.
But I think the CNBC 2015 scorecard on state business climates, published earlier this month, is based on a more solid set of criteria.
CNBC then grouped these measures into ten broader categories, weighting the results based on how often each is used as “selling point” in state economic development marketing and promotional efforts. This was done in order to rank the states based on the criteria they themselves use to showcase their attractiveness to businesses considering expansion or relocation.
Here are the ten broad categories in the CNBC evaluation, and which states ranked first and last within them:
Access to capital: #1 North Carolina … #50 Wyoming
Business friendliness: #1 North Dakota … #50 California
Cost of doing business: #1 Indiana … #50 Hawaii
Cost of living: #1 Mississippi … #50 Hawaii
Economy: #1 Utah … #50 Mississippi
Education: #1 Massachusetts … #50 Nevada
Infrastructure: #1 Texas … #50 Rhode Island
Quality of life: #1 Hawaii … #50 Tennessee
Technology/innovation: #1 Washington … #50 West Virginia
Workforce: #1 North Dakota … #50 Maine
Do we see any surprises here? To my mind, the high and low rankings look pretty well-aligned with the anecdotal information we hear all the time.
Perhaps we might consider several other states besides Nevada to be “bottoms” in education. And personally, I am pretty shocked to see Tennessee ranked last in quality of life. Having lived there during my college years at Vanderbilt University, I never considered the state to be substandard when it came to that attribute.
But It’s when CNBC amalgamates all of the rankings to come up with its overall state ranking that a few surprises emerge.
Such as … Minnesota notches first place overall. I’m sure some people are genuinely surprised to see that.
For the record, here is CNBC’s list of the Top 10 states for business in 2015:
#1 – Minnesota
#2 – Texas
#3 – Utah
#4 – Colorado
#5 – Georgia
#6 – North Dakota
#7 – Nebraska
#8 – Washington
#9 – North Carolina
#10 – Iowa
We see that four of the ten top states are in the Midwest … three are in the South … three are in the West … but none are in the Northeast.
The center holds: According to CNBC, most of the most competitive states for business are in the Mid-Continent region.
By contrast, for the most part the Bottom 10 states are clustered in other areas of the country … including four Northeastern states plus Alaska and Hawaii, two states that clearly have unique locational circumstances:
Not so sunny: Hawaii’s bad business climate.
#40 – Pennsylvania
#41 – Alabama
#42 – Vermont
#43 – Mississippi
#44 – Maine
#45 – Nevada
#46 – Louisiana
#47 – Alaska
#48 – Rhode Island
#49 – West Virginia
#50 – Hawaii
CNBC has issued a raft of charts and maps providing details behind how their ratings were formulated, and the results for each of the major categories. You can view the data here.
Speaking for yourselves, in what ways would you challenge the rankings? What strikes you here as different from your own personal experience in doing business in various states? Please share your perspectives with other readers.
When is the last time you heard about a product introduction where initial sales were off by 90% barely three months after coming on the market?
If you’re thinking the Blackberry 10 … you’re wrong.
It’s the Apple Watch. Its introduction in April was made with a big amount of fanfare, promoted before and after the launch by PR, TV and online advertising, and even outdoor billboards.
But the hard truth is that aside from the tech community, few people are buying the Apple Watch.
According to Slide Intelligence, weekly Apple Watch sales have plummeted from around 200,000 per day at launch to fewer than 20,000 per day now. Moreover, most sales have been of the least expensive Sport model ($349).
It may be too soon to write off the Apple Watch introduction as an abject failure. But I know one thing: The market’s (lack of) receptivity so far can’t be what Apple execs were hoping for.
It must be quite a comedown for a company that experienced the dizzying popularity of the iPod, iPhone and iPad right out of the box — and where those product sales continued to climb at an increasing rate for months or years after their debut.
Some people are comparing the Apple Watch introduction to what happened to Google Glass – likewise the victim of tepid sales to the point where Google quietly removed the product from the market after making a go of it for about two years.
Actually, I’m not quite sure the comparison is completely apt.
For starters, Google Glass didn’t come on the market backed by a ginormous PR and advertising campaign. In fact, it wasn’t really presented as a full-blown product – but more like a project with a beta test component.
Also, it was never made available in wide release; some people I know who wanted to “kick the tires” with Google Glass had difficulty finding out how they could do so.
But besides the very different rollout strategies, another factor might explain a more fundamental difference – and which has hugely negative potential impact on the Apple Watch.
Whereas Google Glass offered its wearers some truly new functionality, what does the Apple Watch deliver besides being merely a miniature version of an iPhone?
When something is less user-friendly (too miniature for many) … doesn’t offer any new functionality over alternative products … and is pretty expensive to boot, is it any wonder that the Apple Watch’s debut has had all the pizzazz of a cold mashed potato sandwich?
Speaking personally, I don’t consider a multipurpose device about an inch square in size as a “must-have” gadget, and I’m pretty sure others would agree with me.
Technology writer and CRM specialist Gene Marks cautions that the Apple Watch’s future isn’t likely to be much brighter than its less-than-impressive performance to date because of this fundamental liability: “The Apple Watch is not making people or companies quicker, better or wiser,” he contends.
In the world of technology and gadgets, that’s not recipe for success. Just ask Blackberry.
Now … let’s hear from Apple Watch users. What’s your take?

 Suddenly, the conflict between Google and the European Union countries regarding the censoring of search results has taken on even wider worldwide proportions.
 As I blogged back in May, The European Court of Justice’s 2014 ruling meant that Google is required to allow residents of EU countries to delete links to certain harmful or embarrassing information that may appear about themselves in Google search results.