Cutting Some Slack: The “College Bubble” Explained

huThere are several “inconvenient truths” contained among the details of a recently released synopsis of college education and work trends, courtesy of the Heritage Foundation. Let’s check them off one-by-one.

The Cost of College

This truth is likely known to nearly everyone  who has children: education at four-year educational institutions isn’t cheap.  Here are the average annual prices for higher education in the United States for the current school year (includes tuition, fees, housing and meals):

  • 4-year public universities (in-state students): ~$19,550
  • 4-year public universities (out-of-state students): ~$34,000
  • 4-year private colleges and universities: ~$43,900

These costs have been rising fairly steadily for years now, seemingly without regard to the overall economic climate. But the negative impact on students has been muted somewhat by the copious availability of student loans — at least in the short term until the schedule kicks in.

The other important mitigating factor is the increased availability of community college education covering the first two years of higher education at a fraction of the cost of four-year institutions.  Less attractive are “for-profit” institutions, some of which have come under intense scrutiny and negative publicity concerning the effectiveness of their programs and how well students do with the degrees they earn from them.

Time Devoted to Education Activities

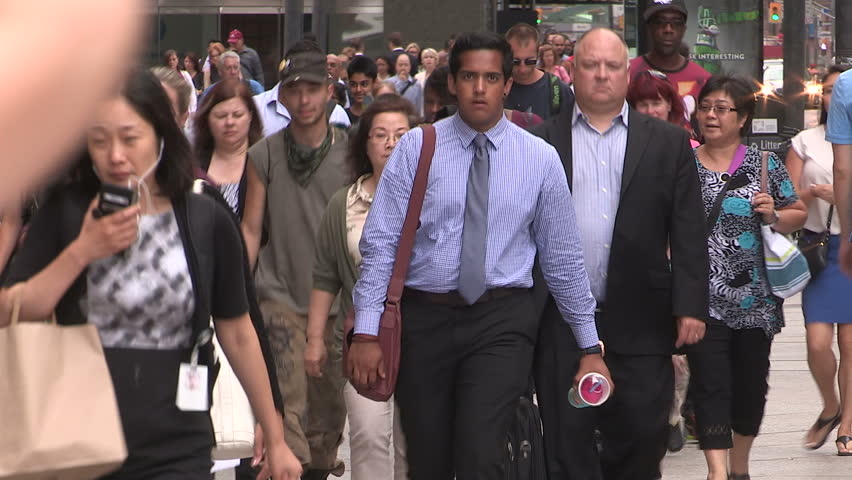
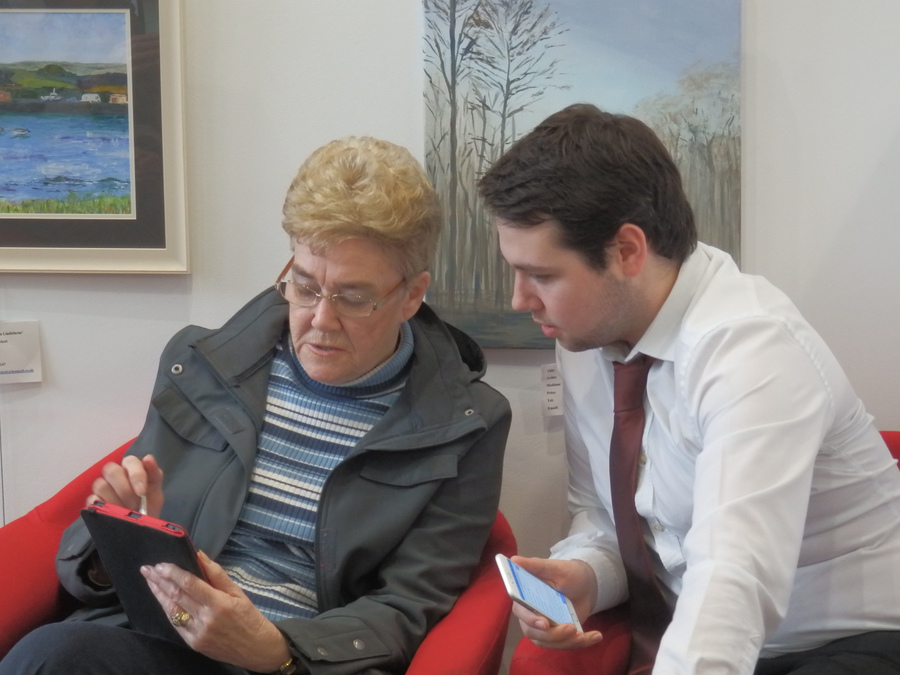
What may be less understood is the degree to which “full-time college” is actually a part-time endeavor for many students.

According to data compiled by the Bureau of Labor Statistics over the past decade, the average full-time college student spends fewer than three hours per day on all education-related activities (just over one hour in class and a little over 1.5 hours devoted to homework and research).

It adds up to around 19 hours per week in total.

In essence, full-time college students are devoting 10 fewer hours per week on educational-related activities compared to what full-time high school students are doing.

Lest this discrepancy seem too shocking, this is this mitigating aspect:  When comparing high-schoolers and full-time college students, the difference between educationally oriented time spent is counterbalanced by the time spent working.

More to the point, for full-time college students, employment takes up ~16 hours per week whereas with full-time high school students, the average time working is only about 4 hours.

Full-Time Students vs. Full-Time Workers

Here’s where things get quite interesting and where the whole idea of the “college bubble” comes into broad relief. It turns out that full-time college students spend far less combined time on education and work compared to their counterparts who are full-time workers.

Here are the BLS stats:  Full-time employees work an average of 42 hours per week, whereas for full-time college students, the combined time spent on education and working adds up to fewer than 35 hours per week.

This graph from the Heritage Foundation report illustrates what’s happening:

CT

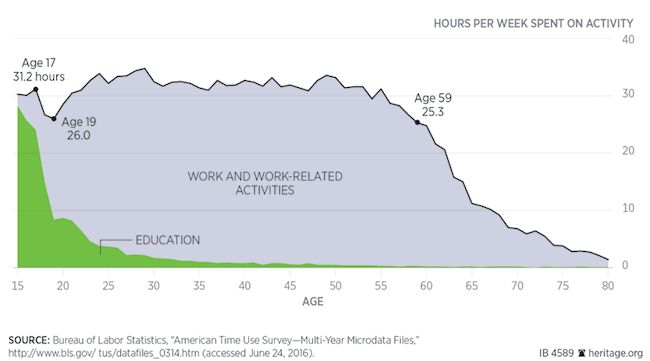
Interestingly, the graph insinuates that full-time college students have it easier than many others in society:

  • On average, 19-year-olds are spending significantly fewer hours in the week on education and work compared to 17-year-olds.
  • It isn’t until age 59+ that people are spending less time on education and work than the typical 19-year-old.

No doubt, some social scientists will take these data as the jumping off spot for a debate about whether a generation of “softies” is being created – people who will struggle in the rigors of the real world once they’re out of the college bubble.

Exacerbating the problem in the eyes of some, student loan default rates aren’t exactly low, and talk by some politicians about forgiving student loan debt is a bit of a lightning rod as well.  The Heritage Foundation goes so far as to claim that loan forgiveness programs are leaving taxpayers on the hook for “generous leisure hours,” since ~93% of all student loans are originated and managed by the federal government.

What do you think? The BLS stats don’t lie … but are the Heritage Foundation’s conclusions off-target?  Please share your thoughts with other readers here.

Trends in Economic Well-Being in the Era of Globalization

Some findings are surprising …

egThe political environment in the United States and Europe has been an endless source of fascination this year — and of course it’s been influenced by a myriad of factors.

To try to make sense of it all, how much of what is happening is due to new challenges to the social order … and how much is due to changes in economic well-being in an era of globalization?

My brother, Nelson Nones, has lived and worked outside the United States for the past two decades. His business is based in East Asia, and much of his work is done in Europe as well as in Asia and North America.  I find his perspectives quite interesting and often different from the “conventional wisdom” heard here at home, because Nelson’s is truly a worldview borne of first-hand experience and observations across many regions.

I asked Nelson to share his thoughts on how globalization has affected the average person — hopefully looking beyond “perceptions” and other qualitative factors and instead focusing on hard metrics.  Nelson’s analysis is insightful — and surprising in some respects. Here is what he reported:

The “Era of Globalization” covers the last quarter-century, beginning with the fall of Communism and continuing to the present day. It began with the opening of national economies which were previously barred from global trade and migration – the former Soviet Union, Mainland China, India, Brazil and others.

Major economic blocs also emerged to liberalize free trade and migration, most notably the Euro Area but also NAFTA in North America, and ASEAN in Southeast Asia.  

In five of the world’s eight major regions, economic well-being has trended quite consistently during this time.

In North America (the United States, Mexico and Canada) and the Euro Area, economic well-being initially grew but peaked between 1999 (North America) and 2001 (Euro Area), and has declined ever since.  North America’s well-being has fallen 22% since its peak; the Euro Area’s has fallen 20%.

By contrast, economic well-being in the East Asia and Pacific as well as South Asia regions has grown steadily.  It has risen by 74% over the past quarter century in the East Asia and Pacific region, and by 68% in the South Asia region.

Economic well-being in Central Europe and the Baltics has also risen steadily after 1992, up 45% within the past 23 years.

In the remaining three regions, trends in economic well-being have been less consistent. The Middle East and North Africa declined steadily after its 2009 peak; down 7% during the last six years, and down 10% over the entire 25-year period.

The Latin America and Caribbean region peaked in 1994, and is down 15% over the past 21 years.

Bringing up the rear is the Sub-Saharan Africa region, which is down 20% over 25 years, although economic well-being grew marginally during nine of those 25 years.

Interestingly, the trend in economic well-being has been least consistent in the Russian Federation.  It fell 49% between 1990 and 1998, rose 118% between 1999 and 2008, and then fell 5% during the last seven years.  Overall, economic well-being in the Russian Federation rose 7% over the last 25 years.

Here’s a graphical representation of the trends noted above:

Chart Nelson Nones

In very broad terms, what do these trends tell me? 

The hands-down winners during the Era of Globalization have been the East Asia and Pacific (including China, Japan, Korea, Southeast Asia, Australia and New Zealand), Central Europe and the Baltics, and South Asia (primarily India) regions.

Not surprisingly, these regions (despite a few exceptions, like Pakistan) are generally peaceful and orderly today, abetted by the rule of authoritarian governments in many countries.

Although they profited during the first decade or so, the biggest losers during the Era of Globalization have been the North America and Euro Area regions.  

One could reasonably argue that the UK’s recent Brexit vote, rising far-right sentiments in Western Europe and the popularity of Donald Trump and Bernie Sanders in the current U.S. Presidential election cycle are all recent symptoms of this underlying trend.

One could just as reasonably argue that the oil curse, authoritarianism, widespread unemployment (or underemployment), the rise of radical Islam, war and terrorism are symptoms of the persistent declines in economic well-being throughout the Middle East and North Africa during the Era of Globalization.

Nevertheless, the Sub-Saharan Africa as well as Latin America and Caribbean regions have underperformed even the Middle East and North Africa region during the Era of Globalization. Might these regions become hotbeds of significant unrest in the not-too-distant future?

Looking at things from this perspective, it becomes easier to understand the “pressure points” we’re witnessing in the political environment in the United States and Europe.  I didn’t realize the degree to which North America and the Euro Area were “the biggest losers” over the past quarter century.  Seeing it spelled out like this, perhaps we can have a little more empathy for the people who feel dissatisfied and who are looking for change.

How easily that change can occur — and whether it will turn out to be a net benefit — well, those are entirely different questions!

__________________

In brief, the methodology behind the analysis is as follows:

1.       Data source is the World Bank World Development Indicators database, last updated 19th July 2016.

2.       Raw data is gross domestic product (GDP) per capita per year, in constant International Dollars, adjusted for purchase price parity (PPP). Use of constant International Dollars strips out the effects of inflation or deflation. The PPP adjustment accounts for differences in the cost of living within each region; GDP is adjusted down for regions having higher-than-average living costs, while GDP is adjusted up for regions having lower-than-average living costs.  

3.       The index for each region and year is calculated as the regional GDP at PPP, divided by worldwide GDP at PPP.

4.       The graph pictured above depicts the natural logarithms of the calculated indexes for each region and year. Hence worldwide GDP at PPP is zero (0); GDP at PPP values lower than the worldwide average are negative, while GDP at PPP values higher than worldwide average are positive.  


Are U.S. warehouse jobs destined to go the way of manufacturing employment?

Even as manufacturing jobs have plateaued or fallen in certain communities, one of the employment bright spots has been the rise of distribution centers and super warehouses constructed by Amazon and other mega retailers to accommodate the steady rise of online shopping.

In my own region, the opening of Amazon distribution centers in Maryland and Delaware were met with accolades by local business development officials, who figured that new employment opportunities for entry level workers would soon follow.

And they have … to a degree. But what many people might not have expected was the rapid rise of robotics usage in warehouse operations.

In just the past few years, Amazon has quietly gone about purchasing and introducing more than 30,000 Kiva robots for many of its warehouses, where the equipment has reduced operating expenses by approximately 20%, according to Dave Clark, Amazon’s senior vice president of worldwide operations and customer service.

An analysis by Deutsche Bank estimates that adding robots to a new Amazon warehouse saves approximately $22 million in fulfillment expenses, which is why Amazon is moving ahead with plans to introduce robots in the remaining 100 or so of its distribution centers that are still without them.

Once in place, it’s estimated that Amazon will save an additional $2.5 billion in operating expenses at these 100 facilities.

Of course, robots aren’t exactly inexpensive pieces of equipment. But with the operational savings involved, it’s clear that adding this kind of automation to warehousing is kind of a slam-dunk decision.

Which helps explain another move that Amazon made in 2012. It decided to purchase the company that makes Kiva robots — for a cool $775 million.  And then it did something else equally noteworthy:  it ceased the sale of Kiva robots to anyone outside the Amazon family.

Because Kiva was pretty much the only game in town when it came to robotics designed for warehouse pick-and-ship functions, Amazon’s move put all other warehouse operations at a serious disadvantage.

That in turn created a stampede to develop alternative sources of supply for robots. It’s taken about four years, but today there are credible alternatives to Kiva brand robots now entering the market.  Amazon’s uneven playing field is getting ready to become a lot more level now.

But the other result of this “robotics arms race” is the sudden plenteous availability of new robot equipment, which companies like Macy’s, Target and Wal-Mart are set to exploit.

The people who are slated to be the odd people out are … warehouse workers.

The impact could well be dramatic. According to the Bureau of Labor Statistics, there are nearly 860,000 warehouse workers in the United States today, and they earn an average wage of approximately $12 per hour.

Not only is the rise of robot usage threatening these jobs, thanks to the sharp increase of minimum wage rates in areas near to some major urban centers is putting the squeeze on hiring from a wholly different direction. It’s a perfect storm the seems destined to blow a hole in warehouse employment levels in the coming years.

Thinking back to what happened to manufacturing jobs in this country, it’s seems we’ve seen this movie before …

Journalism’s Slow Fade

jjLate last month, the 2016 Lecture Series at the Panetta Institute for Public Policy in Carmel, CA hosted a panel discussion focusing on the topic “Changing Society, Technology and Media.”

The panelists included Ted Koppel, former anchor of ABC News’ Nightline, Howard Kurtz, host of FAX News’ Media Buzz, and Judy Woodruff, co-anchor and managing editor of the PBS NewsHour show.

During the discussion, Ted Koppel expressed his dismay over the decline of journalism as a professional discipline, noting that the rise of social media and blogging have created an environment where news and information are no longer “vetted” by professional news-gatherers.

One can agree or disagree with Koppel about whether the “democratization” of media represents regression rather than progress, but one thing that cannot be denied is that the rise of “mobile media” has sparked a decline in the overall number of professional media jobs.

Data from the Bureau of Labor Statistics can quantify the trend pretty convincingly. As summarized in a report published in the American Consumers Newsletter, until the introduction of smartphones in 2007, the effect of the Internet on jobs in traditional media, newspapers, magazines and book had been, on balance, rather slight.

To wit, between 1993 and 2007, U.S. employment changes in the following segments looked like this:

  • Book Industry: Net increase of ~700 jobs
  • Magazines: Net decline of ~300 jobs
  • Newspapers: Net decline of ~79,000 jobs

True, the newspaper industry had been hard hit, but other segments not nearly so much, and indeed there had been net increases charted also in radio, film and TV.

But with the advent of the smartphone, Internet and media access underwent a transformation into something personal and portable. Look how that has impacted on jobs in the same media categories when comparing 2007 to 2016 employment:

  • Book Industry: Net loss of ~20,700 jobs
  • Magazines: Net loss of ~48,400 jobs
  • Newspapers: Net loss of ~168,200 jobs

Of course, new types of media jobs have sprung up during this period, particularly in Internet publishing and broadcasting. But those haven’t begun to make up for the losses noted in the segments above.

According to BLS statistics, Internet media employment grew by ~125,300 between 2007 and 2016 — but that’s less than half the losses charted elsewhere.

All told, factoring in the impact of TV, radio and film, there has been a net loss of nearly 160,000 U.S. media jobs since 2007.

employment-trends-in-newspaper-publishing-and-other-media-1990-2016

You’d be hard-pressed to find any other industry in the United States that has sustained such steep net losses over the past decade or so.

Much to the chagrin of old-school journalists, newspaper readership has plummeted in recent years — and with it newspaper advertising revenues (both classified and display).

The change in behavior is across the board, but it’s particularly age-based. These usage figures tell it all:

  • In 2007, ~33% of Americans age 18 to 34 read a daily newspaper … today it’s just 16%.
  • Even among Americans age 45 to 64, more than 50% read a daily newspaper in 2007 … today’s it’s around one third.
  • And among seniors age 65 and up, whereas two-thirds read a daily paper in 2007, today it’s just 50%.

With trends like that, the bigger question is how traditional media have been able to hang in there as long as they have. Because if it were simply dollars and cents being considered, the job losses would have been even steeper.

Perhaps we should take people like Jeff Bezos — who purchased the Washington Post newspaper not so long ago — at their word:  Maybe they do wish to see traditional journalism maintain its relevance even as the world around it is changing rapidly.

Is there an emerging crisis in caregiving?

ecIt surprised me to learn recently that nearly 45 million American adults are providing unpaid care to family members. And in nearly 80% of the cases, the persons being cared for are over the age of 50.

As it turns out, there are tens of millions of parents and spouses who require daily care.  And for many of folks who take on the role of unpaid caregivers, these tasks are like a second job for them.

Typically, they require a minimum of 20 hours per week (and often far more than that).

Juggling work and life under such circumstances is more than merely an inconvenience. It can also put caregivers’ own health and emotional well-being at risk – not to mention the added financial burdens where all the little extra expenses can add up to be quite a lot.

AARP is asking the question: Is there a coming crisis in senior care?  Looking at this chart, there very may well be one looming on the horizon:

tc


What this chart tells us is that in 2010, the ratio of caregivers to care recipients was about 7:1.  In just 20 years, that ratio will be down to 4:1.  And it’s going to get even worse after that.

It comes down to simple math. The population of Americans over the age of 80 is expected to grow by nearly 45% between 2030 and 2040, whereas the number of available caregivers won’t even begin to keep up (rising by just 10%).

And then there’s looking at the role of caregiving from the other side. As it turns out, there are nearly 8 million children who live in families where a grandparent is the head of household.

The reasons for “grand-families” are varied: military deployment of parents, incarceration, substance abuse or mental illness.  And where these families are found crosses all societal lines.

When you look at it from all the angles, caregiving is a big challenge with no easy answers.  But considering its ubiquity, it’s an issue that doesn’t get the kind of attention it probably should.

If you have personal observations to share based on your own family’s caregiving experiences, I’m sure other readers will find them worth hearing — so jot them down in the comment section below.

Online Shopping Trends: Going from “Go-Go” to “No-No”?

The easy growth for online shopping appears to be over, according to new research findings published by Boston Consulting Group.

bcgBCG just completed surveying ~3,300 Americans aged 15 to 85 about their online shopping habits across 41 merchandise categories. In every category, a clear majority of respondents report that they don’t plan to increase their online spending in the next three years.

Depending on the category, the percentage of people who do not plan to increase their online spending ranges from 78% to 92%.

And in some disparate categories ranging from food and beverages to packaged goods, fine jewelry, news media and automobiles, more than a quarter of the people already shopping online said that they actually plan to decrease their online spend over the upcoming three years.

opsoPerhaps even more surprising, the BCG survey results show similar findings regardless of generational groups — Baby Boomers, Gen-Xers and Millennials alike.

BCG has conducted other studies on this topic in the past, but reportedly this is the first time such low “future intention” figures have been collected, and it suggests that future e-commerce growth will be a good deal more challenging for many companies who offer their products and services for online purchase.

Here’s a quote from Michael Silverstein, a BCG senior partner and specialist in consumer shopping behaviors, speaking about the new research findings:

“Consumers are notoriously unable to predict their spending patterns. However, the findings from this research certainly pour cold water on everyone’s expectations for a continuously rising e-commerce world.  E-commerce winners will have to earn new dollars and new spending by providing new value.  That means me-too players will suffer — and leaders will need to provide more user-friendly websites, lower prices, and offers tailored to individual customers.”

There remain a few categories where people are planning to spend more online in the coming years.  However, they don’t represent physical products. Instead, those categories are airline tickets, hotel reservations, and entertainment ticket reservations.

Still, it’s interesting to see online commerce now entering its “mature” phase.  Those rapid, double-digit growth rates couldn’t go on forever — and indeed, they now look to be a thing of the past.

The Gawker saga: Are there any good guys in this drama?

gmSome people I’ve spoken to about blog collective Gawker Media’s recent legal and corporate tribulations have expressed concerns about the chilling effect well-funded lawsuits may be having on a free and unfettered press.  But it’s hard to find any angels in the ongoing saga of Gawker Media and its many detractors.

The latest news is that Gawker is filing for Chapter 11 bankruptcy protection even as it entertains an acquisition bid from publishing firm Ziff Davis.

Reportedly, Ziff Davis is offering $90 million to purchase Gawker Media.  This compares to the $140 million judgment against Gawker handed down by the courts in March in the Hulk Hogan defamation lawsuit.

hhLooking at the sordid details, it’s hard to find sympathy for any of the major players.  In the choice words of journalist and writer Bob Garfield:

“[Gawker Media is a] snide, predatory gossip site that built a reputation cutting hypocritical big shots down to size, but soon ran out of big shots and turned its sneering animus on any anonymous medium-shot unfortunate enough to fall into its sights … Gawker.com is in the schadenfreude business.”

Professional wrestler and television personality Hulk Hogan (aka Terry Gene Bollea) isn’t a paradigm of virtue, either – what with his history of obnoxious statements and what we’ll call euphemistically “other activities” that fall pretty low on the class-meter.

ptTech industry billionaire Peter Thiel, who provided the financial backing for Hulk Hogan’s successful lawsuit, was once a victim of Gawker himself – being “outed” as gay by the media site.  But Thiel’s über-libertarian pronouncements appear churlish on the one hand, while his legal takedown of Gawker seems to be at cross-purposes with the “anything goes” free speech premises of libertarianism.

Nick Denton, Gawker founder and CEO, has remained defiant even in the wake of the latest turn of events:  “Even with his billions, Thiel will not silence our writers.  Our sites will thrive – under new ownership,” Denton has been quoted, adding that court appeals will continue.

Clearly, this drama isn’t ending anytime soon. But with no sympathetic characters in this drama — and that’s about the most positive thing one can say about it — who’s ready to take a shower right about now?

Are France’s New “Right to Disconnect” Regulations Based on a Big “Disconnect” as well?

mcThe country of France has just enacted labor reform legislation that prohibits the use of work e-mails after-hours.

That is correct: For companies with 50+ employees operating in France, the entities must now define a set of hours when employees are not allowed to send any e-mails.

The legislation, which is part of an omnibus law titled “The Adaptation of Work Rights to the Digital Era,” also stipulates that employees are barred from interacting with work e-mail communications on holidays and on weekends.

To me, this seems like an issue worthy of consideration that’s been taken to an extreme – using a heavy-handed blunt force object when perhaps a scalpel is what’s really required.

Let’s first acknowledge that the French legislation is borne out of real concerns. Few in the business world would argue that the pervasiveness of work-related e-mails has a big downside as it’s crept steadily into every aspect of life.

Stress, fatigue, burnout.  Call it what you will — there’s little doubt that for many people, life in the 24/7 business lane has become distinctly unappealing.

The American Psychological Association cites a litany of problems that go beyond just stress and fatigue, too. It counts high blood pressure, depression, and even elevated cholesterol levels as among the collateral damage of the “always on” business culture.

People’s online behaviors aren’t helping matters, either. Consumer research routinely shows that ~80% of smartphone users check their devices within 15 minutes of waking up.  A similar percentage keep their devices with them at least 22 hours a day or longer.

Clearly, we’re doing it to ourselves as much as any dictates coming from “The Man.”

But like so much else in the realm of social engineering, these new French regulations seem set to result in all sort of unintended consequences.

What about global companies that engage with personnel across a myriad of time zones?  Are those organizations supposed to shut down mission-critical functions when France is “off limits” – jeopardizing the timely transaction of their business activities?

More likely, it will be their French business operations that shut down, rather than the rest of the world sucking it up and catering to the French regulations.

As one MediaPost reader commented after reading about the new law:

“Maybe the Dumbest. Law. Ever. Yet.

If you’re in France working, but your customer is in the U.S., how in the world are you supposed to communicate?  Stay up late and have a phone call with them instead?  Talk about turning people into criminals for no reason.”

Which bring up another point. From Prohibition then to zoning provisions today, “dumb” laws just encourage people to break them.

I can’t see this legislation being a long-term success – but you might disagree. Please share your perspectives with other readers here.

Brands and “cause marketing”: How much is too much?

cmWhen brands conduct attitudinal studies of their customer base, the research often finds that people respond favorably to so-called “positive” or “progressive” causes.

The ALS “Ice-Bucket Challenge” is probably Exhibit A for the potency of such an initiative — including its fantastically successful viral component.

So it’s only natural that brand managers would think in terms of tying their brands to high-profile events such as Earth Day or popular health causes such as efforts to cure cancer or heart disease.

Perhaps the activity is doing a highly publicized community initiative … hosting a well-publicized 5K run or similar event … or donating funds for the cause in a new and attention-grabbing way.

But here’s the rub: With so many national brands doing precisely these sorts of things, it’s become something of an echo chamber.  What once was fresh and novel now seems decidedly ho-hum.

Besides, with so much breathless “cause activity” happening, it’s little wonder that many consumers are seeing through all the hype and attaching near-zero attribution to the brands involved.

The situation is even more problematic when there’s little or no connection between the brand’s products or services and the cause being supported.  The problem is, when brands start vying for attention — especially allying with causes that have nothing at all to do with their core business — “authenticity” goes out the window.

In the process, the brands may telegraph something even worse than irrelevancy; they look desperate for attention.

Of course, all of this evidence doesn’t mean that major brands aren’t continuing to try to attach themselves to the positive vibes of social action. Some recent examples are these:

More problematic than these campaigns was the Starbucks initiative last year in which its baristas were encouraged to start conversations about race relations, interacting with customers waiting in line for their espressos and muffins.

Let’s just say that the idea looked better on paper compared to how it panned out in real life — with more than a few Starbucks customers finding the initiative awkward, intrusive and off-putting (and taking to Twitter to vent their feelings).

Thinking about the good and the not-so-good of “cause marketing,” it appears that the more successful of these initiatives are ones which hew more closely to a brand’s own essence.

Patagonia is a good example of this. Its mission has always been to design and manufacture quality products in an environmentally responsible way, and it promotes proper stewardship of the land and of material possessions through many initiatives that just “feel right” for this particular brand.

And in the realm of apparel and cosmetics, a whole bevy of brands have jumped into conversations about “positive self-image.” While to some people it may seem self-serving for brands like Dove® soap, American Eagle lingerie and Lane Bryant plus-size apparel to become active in such causes, one can also see the logical connection between the products these brands sell and the themes they are spotlighting in these campaigns.

Authenticity and genuineness: Not only are they the hallmark of successful brands, they’re the acid test for successfully grabbing a share of the “social good” pie.  Who’s doing it right … and who’s missing the mark?  Let us know your nominations.

State migration trends: A familiar pattern reasserts itself?

During the “great recession” that began in 2008, the United States saw an interruption in a decades-long pattern of more Americans moving away from states in the Midwest and Northeast than moving in, while more moved to states in the South and West.

The break in this pattern was good news for those who had bemoaned the loss of political clout based on the relative changes in state population.

To wit:  In the four census periods between the 1960s and the 2000s, the 11 Northeast states plus DC saw their Electoral College percentage plummet by 15 percentage points, so that today they represent barely 20% of the electoral votes required to elect the U.S. president, with s similar lack of clout in the House of Representatives.

For the 12 Midwestern states, the trends haven’t been much better.

But for a few years at least, states in the Midwest and Northeast stopped shedding quite so many of their residents to the Southern and Western regions of the country.

The question was, would it last?  Now we know the answer:  Nope.

Instead, new census data is showing a return to familiar patterns.  In the past few years, the states with the largest net in-migration of people are these predictable ones in the Sunbelt region:

  • Florida: +200,000 net new migrants
  • Texas: +170,000
  • Colorado: +54,000
  • Arizona: +48,000
  • South Carolina: +46,000

By comparison, woebegone Illinois, beset by state fiscal crises, a mountain of over-bloated state pension obligations and a crumbling infrastructure that causes some people major-league heartburn on a daily basis, experienced a net loss of more than 100,000 people.

New York, Pennsylvania, Michigan, New Jersey and other “rust belt” states aren’t far behind.

This map, courtesy of The Washington Post, pretty much says it all:


untitled


There is one glaring difference today compared to previous decades. Back then, California was always at or near the top in terms of positive net in-migration from other states.  That’s all different now – as California is a state with one of the largest net losses.

What’s particularly telling is that California, which used to share many of the characteristics of other Sunbelt and Western states, now seems much more in line with the Northeast and Industrial Midwest when it comes to fundamental factors like state personal and corporate tax rates, real estate prices, environmental regulations, employment dynamics, unionization rates, and the size of public payrolls as a share of the total labor force.

Based on the entrenched and intractable socio-political dynamics at work, don’t look for the migration patterns to change anytime soon.

What are your own personal perspectives, based on where you live?