Where Robots Are Getting Ready to Run the Show

The Brookings Institution has just published a fascinating map that tells us a good deal about what is happening with American manufacturing today.

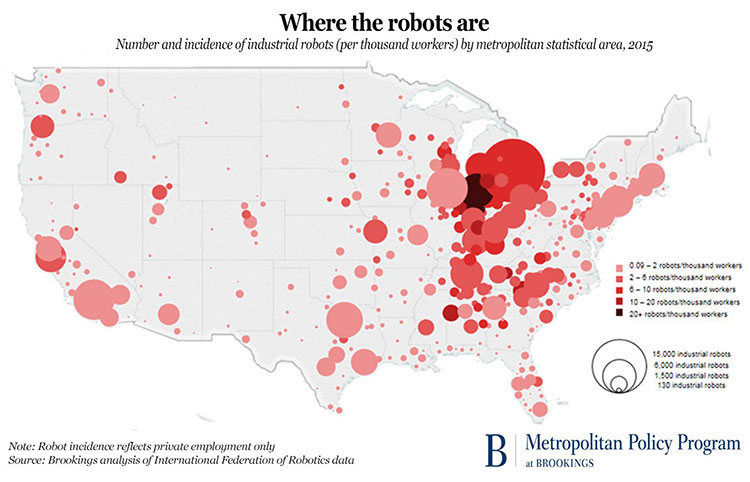
Headlined “Where the Robots Are,” the map graphically illustrates that as of 2015, nearly one-third of America’s 233,000+ industrial robots are being put to use in just three states:

  • Michigan: ~12% of all industrial robots working in the United States
  • Ohio: ~9%
  • Indiana: ~8%

It isn’t surprising that these three states correlate with the historic heart of the automotive industry in America.

Not coincidentally, those same states also registered a massive lurch towards the political part of the candidate in the 2016 U.S. presidential election who spoke most vociferously about the loss of American manufacturing jobs.

The Brookings map, which plots industrial robot density per 1,000 workers, shows that robots are being used throughout the country, but that the Great Lakes Region is home to the highest density of them.

Toledo, OH has the honor of being the “Top 100” metro area with the highest distribution of industrial robots: nine per 1,000 workers.  To make it to the top of the list, Toledo’s robot volume jumped from around 700 units in 2010 to nearly 2,400 in 2015, representing an average increase of nearly 30% each year.

For the record, here are the Top 10 metropolitan markets among the 100 largest, ranked in terms of their industrial robot exposure.  They’re mid-continent markets all:

  • Toledo, OH: 9.0 industrial robots per 1,000 workers
  • Detroit, MI: 8.5
  • Grand Rapids, MI: 6.3
  • Louisville, KY: 5.1
  • Nashville, TN: 4.8
  • Youngstown-Warren, OH: 4.5
  • Jackson, MS: 4.3
  • Greenville, SC: 4.2
  • Ogden, UT: 4.2
  • Knoxville, TN: 3.7

In terms of where industrial robots are very low to practically non-existent within the largest American metropolitan markets, look to the coasts:

  • Ft. Myers, FL: 0.2 industrial robots per 1,000 workers
  • Honolulu, HI: 0.2
  • Las Vegas, NV: 0.2
  • Washington, DC: 0.3
  • Jacksonville, FL: 0.4
  • Miami, FL: 0.4
  • Richmond, VA: 0.4
  • New Orleans, LA: 0.5
  • New York, NY: 0.5
  • Orlando, FL: 0.5

When one consider that the automotive industry is the biggest user of industrial robots – the International Federation of Robotics estimates that the industry accounts for nearly 40% of all industrial robots in use worldwide – it’s obvious how the Midwest region could end up being the epicenter of robotic manufacturing activity in the United States.

It should come as no surprise, either, that investments in robots are continuing to grow. The Boston Consulting Group has concluded that a robot typically costs only about one-third as much to “employ” as a human worker who is doing the same job tasks.

In another decade or so, the cost disparity will likely be much greater.

On the other hand, two MIT economists maintain that the impact of industrial robots on the volume of available jobs isn’t nearly as dire as many people might think. According to Daron Acemoglu and Pascual Restrepo:

“Indicators of automation (non-robot IT investment) are positively correlated or neutral with regard to employment. So even if robots displace some jobs in a given commuting zone, other automation (which presumably dwarfs robot automation in the scale of investment) creates many more jobs.”

What do you think? Are Messrs. Acemoglu and Restrepo on point here – or are they off by miles?  Please share your thoughts with other readers.

“I’m just so busy!” becomes the new social status signal.

In an era of almost constant “disruption” both socially and politically, it’s always interesting to hear the perspectives of people who devote their energies to thinking about the “larger implications.”

Author and MarComm über-thought leader Gord Hotchkiss is one of those individuals whose writings about the intersection of technology and human behavior are invariably interesting and thought-provoking.

His latest theory is no exception.

In a recent column published in MediaPost, Hotchkiss posits that the social status hierarchy of people may be moving away from “conspicuous consumption” and more towards the notion of “time” as the status symbol.

Hotchkiss writes:

“‘More stuff’ has been how we’ve determined social status for hundreds of years. In sociology, it’s called conspicuous consumption — a term coined by sociologist Thorstein Veblen.  It’s a signaling strategy that evolved in humans over our recorded history. 

 The more stuff we had — and the less we had to do to get that stuff — the more status we had. Just over 100 years ago, Veblen called those who significantly fulfilled these criteria the Leisure Class.”

Gord Hotchkiss

Looking at how social dynamics and social status are playing out today — at least in North America — Hotchkiss paints picture that is quite different from before:

“A recent study seems to indicate that we now associate ‘busy-ness’ with status. Here, it’s time, not stuff, that is the scarce commodity.  Social status signaling is more apt to involve complaining about how we never go on a vacation than about our ‘summer on the continent.'”

Interestingly, the very same research methodology that uncovered this set of attitudes in the United States was conducted in Italy as well. And there, the findings were exactly the opposite.

Perhaps it shouldn’t surprise us that in Italy, every employee is entitled to at least 32 days of PTO per year, whereas in the United States the minimum number of legally required paid holidays is … zero.

Looked at from another perspective, perhaps today’s social status indicators in North America are merely the Protestant Work Ethic in action, but updated to the 21st century.

Either way, the residents of Italy probably see it as a heck of a way to live …

What’s up with personal assistant apps?

Apple Siri loses a chunk of users, but it still possesses the biggest share of the AI-powered personal assistant apps market.

With the entry of new personal assistant apps, it’s only logical that there would be a shift in market share between the established players and the upstarts.

That trend is underscored in statistics recently published by Verto Analytics which are based on behavioral data gleaned from ~20,000 U.S. consumers via passive metering of their digital devices.

According to Verto, the current share of usage among the seven top personal assistant apps breaks down as follows:

  • Apple Siri: 41MM monthly U.S. users (~44%)
  • Samsung S Voice: 23MM (~25%)
  • Google Text-To-Search: 20MM (~21%)
  • Google Home: 5MM (~5%)
  • Amazon Alexa: 3MM (~3%)
  • Google Allo: 1MM (~1%)
  • Microsoft Cortana: 1MM (~1%)

These stats show the degree to which the top three apps continue to dominate the U.S. market. However, they don’t tell the entire story.  A more interesting trend is what’s happening with the number of monthly users by app. In the case of Siri, its monthly user figure has dropped a full 15% in the past year – or about 7 million monthly users lower than in 2016.

Samsung, #2 on the list, also experienced a decline in monthly users – in its case a drop of 8%, or about 2 million fewer users compared to 2016.

Google Home also experienced a slide in subscribers, although #3 ranged Google Text-To-Search did grow.

The biggest growth trends in personal assistant apps were experienced by Alexa (up ~325%) and Cortana (up ~350%). Both apps were starting from a very low baseline, however, and today they still number only around 3 million and 1 million monthly users respectively.

Another interesting dynamic is the level of engagement each of these personal assistant apps generates. As it turns out, there is a direct correlation between overall user growth and levels of engagement, so it’s pretty clear where most of the “go-go” action is at the moment:  Alexa and Cortana.

Perhaps most significantly, the Verto report suggests that personal assistant apps are of more utility to users than search apps such as Google or Yelp. Approximately 45% of smartphones owned by U.S. adults contained a personal assistant app that was used at least once during the month of May 2017.  Compare that to the percent of smartphones that had a search app installed over the same period:  just 34%.

It goes to show that among personal assistant apps broadly, the market is quite robust even if it’s fragmenting rather than consolidating.

The great, disappearing retail store act.

What’s in store for retail? Maybe not much at all …

There have been quite a few news reports about store closings since the beginning of this year — many of them focused on big brands like Kmart, JCPenney and Abercrombie & Fitch.

But what about the retail industry as a whole?

Recently, GetApp conducted research among a more general group of U.S. retailers that run online retail operations as well as a physical stores.

Among this group of respondents, two out of three believe that they could be closing their physical stores within the coming decade and operating their business solely online:

  • Extremely likely to be running my business solely online by 2027: ~23%
  • Likely: ~43%
  • Not sure: ~17%
  • Unlikely: ~12%
  • Extremely unlikely: ~4%

If these figures turn out to be even somewhat accurate, the “retail apocalypse” some news organizations are talking about will have become even more of a reality than even the most hyperventilating journalists are predicting.

It certainly lends additional credibility to current narrative about the downward slide of shopping malls across the United States …

The U.S. Postal Services unveils its Informed Delivery notification service – about two decades too late.

Earlier this year, the U.S. Postal Service decided to get into the business of e-mail. But the effort is seemingly a day late and a dollar short.

Here’s how the scheme works: Via sending an e-mail with scanned images, the USPS will notify a customer of the postal mail that will be delivered that day.

It’s called Informed Delivery, and it’s being offered as a free service.

Exactly what is this intended to accomplish?

It isn’t as if receiving an e-mail notification of postal mail that’s going to be delivered within hours is particularly valuable.  If the information were that time-sensitive, why not receive the actual original item via e-mail to begin with?  That would have saved the sender 49 cents on the front end as well.

So the notion that this service would somehow stem the tide of mass migration to e-mail communications seems pretty far-fetched.

And here’s another thing: The USPS is offering the service free of charge – so it isn’t even going to reap any monetary income to recoup the cost of running the program.

That doesn’t seem to make very good business sense for an organization that’s already flooded with red ink.

Actually, I can think of one constituency that might benefit from Informed Delivery – rural residents who aren’t on regular delivery routes and who must travel a distance to pick up their mail at a post office. For those customers, I can see how they might choose to forgo a trip to town if the day’s mail isn’t anything to write home about — if you’ll pardon the expression.

But what portion of the population is made up of people like that? I’m not sure, but it’s likely far fewer than 5%.

And because the USPS is a quasi-governmental entity, it’s compelled to offer the same services to everyone.  So even the notion of offering Informed Delivery as “niche product” to just certain people isn’t relevant.

I guess the USPS deserves fair dues just for trying to come up with new ways to be relevant in the changing communications world. But it’s very difficult to come up with anything worthwhile when the entire foundation of the USPS’s mission has so been eroded over the past generation.

Suddenly, smartphones are looking like a mature market.

The smartphone diffusion curve. (Source: Business Insider)

In the consumer technology world, the pace of product innovation and maturation seems to be getting shorter and shorter.

When the television was introduced, it took decades for it to penetrate more than 90% of U.S. households. Later, when color TVs came on the market, it was years before the majority of households made the switch from black-and-white to color screens.

The dynamics of the mobile phone market illustrate how much the pace of adoption has changed.

Only a few years ago, well-fewer than half of all mobile phones in the market were smartphones. But smartphones rapidly eclipsed those older “feature phones” – so that now only a very small percentage of cellphones in use today are of the feature phone variety.

Now, in just as little time we’re seeing smartphones go from boom to … well, not quite bust.  In fewer than four years, the growth in smartphone sales has slowed from ~30% per year (in 2014) to just 4%.

That’s the definition of a “mature” market.  But it also demonstrates just how successful the smartphone has been in penetrating all corners of the market.

Consider this:  Market forecasting firm Ovum figures that by 2021, the smartphone will have claimed its position as the most popular consumer device of all time, when more than 5 billion of them are expected to be in use.

It’s part of a larger picture of connected smart devices in general, for which the total number in use is expected to double between now and 2021 – from an estimated 8 billion devices in 2016 to around 15 billion by then.

According to an evaluation conducted by research firm GfK, today only around 10% of consumers own either an Amazon Echo or Google Home device, but digital voice assistants are on the rise big-time. These interactive audio speakers offer a more “natural” way than smartphones or tablets to control smart home devices, with thousands of “skills” already perfected that allow them to interact with a large variety of apps.

There’s no question that home devices are the “next big thing,” but with their ubiquity, smartphones will continue to be the hub of the smart home for the foreseeable future.  Let’s check back in another three or four years and see how the dynamics look then.

Are boomerang kids the “new normal” now?

I’ve blogged before about how the Great Recession and resulting high unemployment rates drove a significant number of young adults back into their childhood homes — or relying on Mom and Dad for financial support at least. It affected millions of young adults.

The economy and job prospects have been steadily improving since those dark days – even if the improvement hasn’t been as rapid as people would like to see …

But here’s an interesting finding: Those new jobs and the improving economy haven’t resulted in the kids moving back out of the house.

In fact, two studies conducted by the Pew Research Center in 2016 have determined that “living with parents” is now the single most common living arrangement for America’s 18-34 year olds.

That is correct: Instead of living with a spouse, a partner, a roommate or on his or her own, the largest single segment of millennials lives full-time with parents.  The phenomenon is most prevalent in Connecticut, New Jersey and New York, where it’s no coincidence that the cost of living is much higher than the national average.

For marketers, this means that the once-coveted 18-34 year-old cohort is today made up of many people who are consuming other people’s resources (e.g., the resources of their parents) rather than making all of their own purchase decisions and spending their own money.

Furthermore, Pew Research has determined that living with parents isn’t merely about employment (or the lack thereof). Over the past eight years, adults age 18-34 have continued to move back home in greater numbers — even as more of them have been able to find jobs.

The Pew findings suggest yet another surprising trend that appears to be in the making – that this is the first American generation where a large portion of the people won’t ever purchase a home.

It’s easy to figure that trends of this kind are transitory. But Pew cautions that the trends may well be more fundamental than the implications of an economic recession.  Instead, there are broader cultural dynamics at play – as well as the long-term challenges of economic independence for this generation of people.

The implications for marketers are intriguing, too.  For some, it will mean placing more emphasis on marketing initiatives aimed at parents, who are the now ones making purchase decisions within a larger multi-generational household — often one that stretches over three generations rather than just two.

And consider these dynamics as well: How do young adults and their parents work through multi-generational purchase decisions?  What are the most effective ways to target and reach multiple generations living under one roof who are making coordinated purchase decisions?  Maybe the old ideas of targeting each audience separately no longer make as much sense as before.

One thing’s for sure – it’s risky for marketers to wait for a return to normal … because that “normal” likely isn’t coming back.  Better to come up with new tactics and new messaging to reach and influence buyers in the new multi-generational environment.

Limp Fries: Restaurants Join Brick-and-Mortar Retailing in Facing Economic Challenges

Press reports about the state of the retail industry have focused quite naturally on the travails of the retail segment, chronicling high-profile bankruptcies (most recently hhgregg) along with store closings by such big names as Macy’s, Sears, and even Target.

Less covered, but just as challenging, is the restaurant environment, where a number of high-profile chains have suffered over the past year, along with a general malaise experienced by the industry across-the-board.

This has now been quantified in a benchmarking report issued last month by accounting and business consulting firm BDO USA covering the operating results of publicly traded restaurants in 2016.

The BDO report found that same-store sales were flat overall, with many restaurants facing lower traffic counts.

The “fast casual” segment, which had experienced robust growth in 2015, experienced the largest loss of any restaurant segment in same-store sales in 2016 (nearly 1.5%), along with the highest cost of sales (nearly 31%).

Chipotle’s poor showing, thanks to persistent food contamination problems, didn’t help the category at all, but those results were counterbalanced by several other establishments which beat the category averages significantly (Shake Shack, Wingstop and Panera Bread).

The “casual dining” segment didn’t perform much better, with same-store sales declining nearly 1% over the year. By contrast, “upscale casual” restaurants reported an ever-so-slight same-store sales gain of 0.2%.

Better sales increases were charted at quick serve (fast food) restaurants, with same-store increases of nearly 1%. Even better results were experienced at pizza restaurants, where same-store sales were up nearly 5%.  This category was led by Domino’s with over 10% same-store sales growth, thanks in part to its Tweet-To-Order rollout and other digital innovations.  Well more than half of the Domino’s orders now come through digital channels.

What are some of the broader currents contributing to the mediocre performance of restaurant chains? Unlike retailing, where it’s easy to see how purchasing practices are migrating online from physical stores, people can hardly eat digitally.  And with “time” at an all-time premium in an economy that’s no longer in recession, it would seem that preparing meals at home hasn’t suddenly becoming easier.

The BDO analysis contends that the convenience economy and the continued attractive savings offered by dining at home combine to slow restaurant foot traffic: “To remain afloat, restaurants will need to drive sales by leveraging the very trends that are shaping this evolving consumer behaviors.”

Tactics cited by BDO as lucrative steps for restaurants include expanding delivery options, and embracing digital channels in a major way.  BDO reports that in 2016, digital food ordering accounted for nearly 2 billion restaurant transactions, and this figure is expected to continue to rise significantly.

Speaking personally, I think there is a glut of dining options presented to consumers across the various segments of the restaurant trade. One local example:  In one stretch of highway on the outskirts of a county seat just 20 miles from where I live (population ~20,000), no fewer than six national chain restaurant locations have opened up in the past 24 months strung out along the main highway, joining several others in a string of options like exhibit booths at a trade show

There’s no way that market demand can satisfy the new restaurant capacity in that town.  Something’s gotta give.

What are your thoughts about which chains are doing things right in the highly competitive restaurant environment today – and which ones are stumbling?

Downtown turnaround? In these places, yes.

Downtown Minneapolis (Photo: Dan Anderson)

For decades, “going downtown” meant something special – probably from its very first use as a term to describe the lower tip of Manhattan, which was then New York City’s heart of business, commercial and residential life.

Downtown was literally “where it was at” – jobs, shopping, cultural attractions and all.

But then, beginning in post-World War II America, many downtowns lost their luster, as people were drawn to the suburbs thanks to cheap land and easy means to traveling to and fro.

In some places, downtowns and the areas immediately adjoining them became places of high crime, industrial decay, shopworn appearances and various socio-economic pathologies.

Things hit rock bottom in the late 1970s, as personified by the Times Square area of New York City. But since then, many downtowns have slowly come back from those near-death experiences, spurred by new types of residents with new and different priorities.

Dan Cort, author of the book Downtown Turnaround, describes it this way:  “People – young ones especially – love historical buildings that reintroduce them to the past.  They want to live where they can walk out of the house, work out, go to a café, and still walk to work.”

There are a number of cities where the downtown areas have come back in the big way over the past several decades. Everyone knows which ones they are:  New York, Seattle, San Francisco, Minneapolis …

But what about the latest success stories? Which downtowns are those?

Recently, Realtor.com analyzed the 200 largest cities in the United States to determine which ones have the made the biggest turnaround since 2012. To determine the biggest successes, it studied the following factors:

  • Downtown residential population growth
  • Growth in the number of restaurants, bars, grocery stores and food trucks per capita
  • Growth in the number of independent realtors per capita
  • Growth in the number of jobs per capita
  • Home price appreciation since 2012 (limited to cities where the 2012 median home price was $400,000 or lower)
  • Price premium of purchasing a home in the downtown district compared with the median home price of the whole city
  • Residential and commercial vacancy rates

Based on these criteria, Realtor.com’s list of the Top 10 cities where downtown is making a comeback are these:

  • #1 Pittsburgh, PA
  • #2 Indianapolis, IN
  • #3 Oakland, CA
  • #4 Detroit, MI
  • #5 Columbus, OH
  • #6 Austin, TX
  • #7 Los Angeles, CA
  • #8 Dallas, TX
  • #9 Chicago, IL
  • #10 Providence, RI

Some of these may surprise you. But it’s interesting to see some of the stats that are behind the rankings.  For instance, look at what’s happened to median home prices in some of these downtown districts since 2012:

  • Detroit: +150%
  • Oakland: +111%
  • Los Angeles: +63%
  • Pittsburgh: +31%

And residential population growth has been particularly strong here:

  • Pittsburgh: +32%
  • Austin: +25%
  • Dallas: +25%
  • Chicago: +21%

In the coming years, it will be interesting to see if the downtown revitalization trend continues – and spreads to more large cities.

And what about America’s medium-sized cities, where downtown zones continue to struggle. If you’ve been to Midwestern cities like Kokomo, IN, Flint, MI or Lima, OH, those downtowns look particularly bleak.  Can the sort of revitalization we see in the major urban centers be replicated there?

I have my doubts … but what is your opinion? Feel free to share your thoughts below.

Where’s the Best Place to Live without a Car?

For Americans who live in the suburbs, exurbs or rural areas, being able to live without a car seems like a pipedream. But elsewhere, there are situations where it may actually make some sense.

They may be vastly different in nearly every other way, but small towns and large cities share one trait – being the places where it’s more possible to live without a car.

Of course, within the larger group of small towns and larger cities there can be big differences in relative car-free attractiveness depending on differing factors.

For instance, the small county seat where I live can be walked from one side of town to the other in under 15 minutes. This means that, even if there are places where a sidewalk would be nice to have, it’s theoretically possible to take care of grocery shopping and trips to the pharmacy or the cleaners or the hardware store on foot.

Visiting restaurants, schools, the post office and other government offices is also quite easy as well.

But even slightly bigger towns pose challenges because of distances that are much greater – and there’s usually little in the way of public transport to serve inhabitants who don’t possess cars.

At the other end of the scale, large cities are typically places where it’s possible to move around without the benefit of a car – but some urban areas are more “hospitable” than others based on factors ranging from the strength of the public transit system and neighborhood safety to the climate.

Recently, real estate brokerage firm Redfin took a look at large U.S. cities (those with over 300,000 population) to come up with its listing of the 10 cities it judged the most amenable for living without a car. Redfin compiled rankings to determine which cities have the better composite “walk scores,” “transit scores” and “bike scores.”

Here’s how the Redfin Top 10 list shakes out. Topping the list is San Francisco:

  • #1: San Francisco
  • #2: New York
  • #3: Boston
  • #4: Washington, DC
  • #5: Philadelphia
  • #6: Chicago
  • #7: Minneapolis
  • #8: Miami
  • #9: Seattle
  • #10: Oakland, CA

Even within the Top 10 there are differences, of course. This chart shows how these cities do relatively better (or worse) in the three categories scored:

Redfin has also analyzed trends in residential construction in urban areas, finding that including parking spaces within residential properties is something that’s beginning to diminish – thereby making the choice of opting out of automobile ownership a more important consideration than in the past.

What about your own experience? Do you know of a particular city or town that’s particularly good in accommodating residents who don’t own cars?  Or just the opposite?  Please share your observations with other readers.