Working hard … yet hardly getting ahead.

Many full-time workers in the 25-35 age group with college training don’t need reminding that they’re struggling to balance paying for student loans while at the same time attempting to have decent housing and handling their day-to-day expenses.

I’m not in that age group, but our two children are – and I can see from their friends and work colleagues just how much of a challenge it is for many of them to balance these competing necessities.

One way to deal with the challenge is to settle for the sardine-like living arrangements one encounters in quite a few urban areas, with anywhere from three to six people residing in the same (medium-sized) apartment or (small) house.

Somehow, things just didn’t see so difficult for me “back in the day.” Of course, the entirety of my student loans following college amounted to a monthly payment of $31.28, with seven years to pay it off.

First apartment — a $185 per month rental.

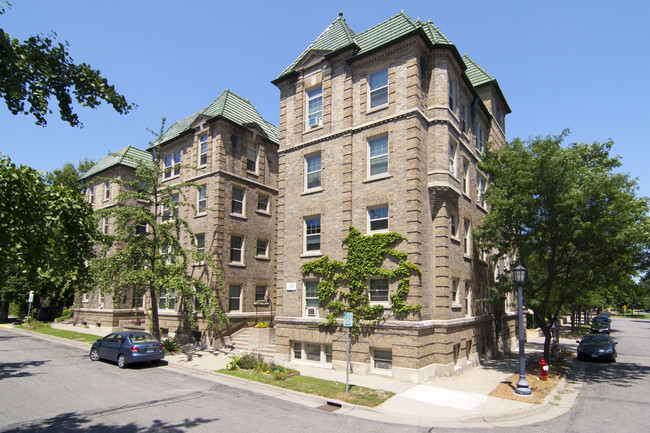
And my first apartment – a one-bedroom flat in an elegant 1920’s building, complete with a beautiful lobby and old-fashioned glam elevator, cost me a mere $185 per month.

Not only that, it was only a five-minute bus ride to my downtown banking job.

Now, a newly released analysis published by the American Consumer’s Newsletter helps quantify the different reality for today’s younger workers.

What the data show is that a college degree does continue to provide higher earnings for younger workers compared to those without one.

But … it also reveals that adjusted for inflation, their earnings are lower than their college-educated counterparts in the past.

According to a National Center for Education Statistics analysis as published by the AC Newsletter, here’s a summary of the median earnings differences for male full-time workers in the 25-34 age cohort, comparing 2016 to the year 2000 in inflation-adjusted dollars:

  • Master’s or higher degree: $71,640 … down 6.4% from 2000
  • Bachelor’s degree: $56,960 … down 8.8%
  • Associate’s degree: $43,000 … down 11.8%
  • Some college, but no degree: $37,980 … down 14.3%
  • High school degree: $34,750 … down 13.6%
  • High school dropout: $28,560 … up 2.8%

Thus, among full-time male workers across all education levels, only high school dropouts have experienced a real increase in earnings between 2000 and 2016.

Among female workers, the trends are a little better, but still hardly impressive – and they also start from lower 2000 income levels to begin with:

  • Master’s or higher degree: $57,690 … down 0.5% from 2000
  • Bachelor’s degree: $44,990 … down 7.5%
  • Associate’s degree: $31,870 … down 12.0%
  • Some college, but no degree: $29,980 … down 13.8%
  • High school degree: $28,000 … down 7.2%
  • High school dropout: $21,900 … up 5.0%

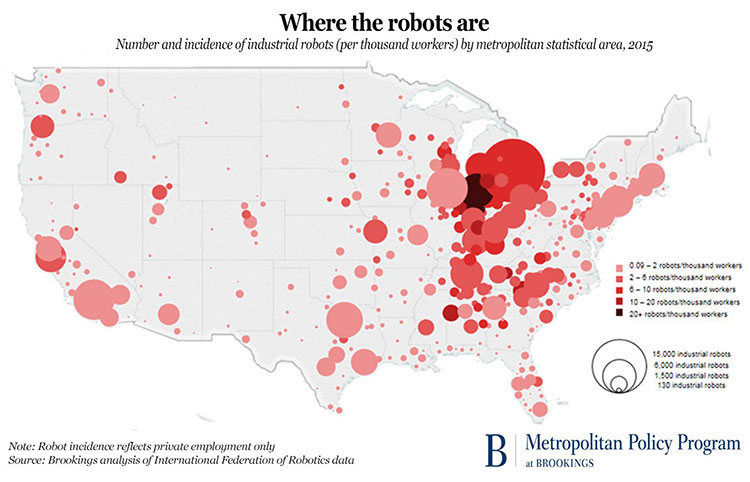
What’s even more challenging for workers carrying student loan debt is that those debt levels are higher than ever – often substantially so.

According to a Brookings Institution comparative study, fewer than 5% of students leaving school in 2000 carried more than $50,000 in student loan debt. In inflation-adjusted terms, by 2014, that percentage had risen to ~17%.

Looked at another way, ~40% of borrowers are carrying student loan debt balances exceeding $25,000. It doesn’t take a finance whiz to figure out how big of a hit that is out of a worker’s paycheck.

It makes the some of today’s realities: people living at home longer following college; having frat- or sorority-like living arrangements; putting off plans to purchase a home, or even putting off marriage plans – all the more understandable.

And I’m not exactly sure what the remedy is, either. When it comes to overburdened education debt, it isn’t as if people can go back and rewrite the script very easily.

Where Robots Are Getting Ready to Run the Show

The Brookings Institution has just published a fascinating map that tells us a good deal about what is happening with American manufacturing today.

Headlined “Where the Robots Are,” the map graphically illustrates that as of 2015, nearly one-third of America’s 233,000+ industrial robots are being put to use in just three states:

  • Michigan: ~12% of all industrial robots working in the United States
  • Ohio: ~9%
  • Indiana: ~8%

It isn’t surprising that these three states correlate with the historic heart of the automotive industry in America.

Not coincidentally, those same states also registered a massive lurch towards the political part of the candidate in the 2016 U.S. presidential election who spoke most vociferously about the loss of American manufacturing jobs.

The Brookings map, which plots industrial robot density per 1,000 workers, shows that robots are being used throughout the country, but that the Great Lakes Region is home to the highest density of them.

Toledo, OH has the honor of being the “Top 100” metro area with the highest distribution of industrial robots: nine per 1,000 workers.  To make it to the top of the list, Toledo’s robot volume jumped from around 700 units in 2010 to nearly 2,400 in 2015, representing an average increase of nearly 30% each year.

For the record, here are the Top 10 metropolitan markets among the 100 largest, ranked in terms of their industrial robot exposure.  They’re mid-continent markets all:

  • Toledo, OH: 9.0 industrial robots per 1,000 workers
  • Detroit, MI: 8.5
  • Grand Rapids, MI: 6.3
  • Louisville, KY: 5.1
  • Nashville, TN: 4.8
  • Youngstown-Warren, OH: 4.5
  • Jackson, MS: 4.3
  • Greenville, SC: 4.2
  • Ogden, UT: 4.2
  • Knoxville, TN: 3.7

In terms of where industrial robots are very low to practically non-existent within the largest American metropolitan markets, look to the coasts:

  • Ft. Myers, FL: 0.2 industrial robots per 1,000 workers
  • Honolulu, HI: 0.2
  • Las Vegas, NV: 0.2
  • Washington, DC: 0.3
  • Jacksonville, FL: 0.4
  • Miami, FL: 0.4
  • Richmond, VA: 0.4
  • New Orleans, LA: 0.5
  • New York, NY: 0.5
  • Orlando, FL: 0.5

When one consider that the automotive industry is the biggest user of industrial robots – the International Federation of Robotics estimates that the industry accounts for nearly 40% of all industrial robots in use worldwide – it’s obvious how the Midwest region could end up being the epicenter of robotic manufacturing activity in the United States.

It should come as no surprise, either, that investments in robots are continuing to grow. The Boston Consulting Group has concluded that a robot typically costs only about one-third as much to “employ” as a human worker who is doing the same job tasks.

In another decade or so, the cost disparity will likely be much greater.

On the other hand, two MIT economists maintain that the impact of industrial robots on the volume of available jobs isn’t nearly as dire as many people might think. According to Daron Acemoglu and Pascual Restrepo:

“Indicators of automation (non-robot IT investment) are positively correlated or neutral with regard to employment. So even if robots displace some jobs in a given commuting zone, other automation (which presumably dwarfs robot automation in the scale of investment) creates many more jobs.”

What do you think? Are Messrs. Acemoglu and Restrepo on point here – or are they off by miles?  Please share your thoughts with other readers.

Tax filing: Is there a better way to do it here in the United States?

untitledTax filing day has come and gone, and for millions of Americans, it’s another reminder of how complicated and convoluted our current tax collection system is.

For some of us, it means setting aside a couple evenings or an entire weekend to collect receipts and other relevant documentation, work through the filing documents and prepare tax information — most of which the federal government already possesses.

For many others, trepidation — or just the sheer irritation of preparing their tax returns — means paying another person or a tax preparation service to do it for them.

The amount of hours and dollars spent on tax preparation is rather astounding; according to a White House estimate published as far back as 2010, collectively it amounts to over 7.5 billion hours and ~$140 billion each year.

Thus, the current lay of the land should make considering new alternatives just the thing to do.

Along those lines, in a recent article in The Atlantic, senior economics editor Derek Thompson posited a “third way”:  Why not receive a document from the government with the relevant information already filled in, and all the taxpayer needs to do is confirm the documentation?

It seems like a cross between Pollyanna and a pipe dream … until one begins to realize how neatly this approach aligns with the financial lives many people lead.

According to the Atlantic article, about half of American taxpayers earn all of their earned income from a single employer’s wages along with interest income from just one financial institution.  This is information the government already collects, which would make it possible for the IRS to send nearly completed tax forms to these individuals.

Some Scandinavian and Baltic countries have been doing this for years.

In fact, a full decade ago economist Austan Goolsbee proposed this very thing for the USA.  In a paper published by the Brookings Institution, Goolsbee advocated adoption of a “simple return” that would involve sending out pre-filled documents to those taxpayers who have the most straightforward taxes.

Those who qualify would include approximately 9 million single, lower income taxpayers who work for a living and don’t itemize their deductions.

An additional 17 million taxpayers have returns that are nearly as simple — including married couples who don’t itemize deductions.

Alas, as with any problem, there is a solution that’s “simple, elegant … and wrong.” Barriers preventing the adoption of a new, streamlined tax filing process include three big ones:

  • The current federal income tax system is not just complex, but also riddled with special interest protections. While in theory, a powerful argument for simplification falls on receptive ears, ultimately it fails when people begin to realize how the reform will reduce their own personal tax benefits. Too often, it’s “Tax simplification for three but not for me.”


  • The cost to overhaul the tax collection system isn’t chicken feed — and as we all know the IRS isn’t exactly swimming in excess funds after having raised the ire of Congress through its targeting of not-for-profit entities (not to mention the not-so-trivial cost of implementing Obamacare compliance enforcement).


  • Resistance is also coming from two other quarters. Tax preparation services are fundamentally opposed to simplification of the process because their very raison d’être depends on the continuation of a complex system that most people cannot or will not deal with on their own.

[On this last point, unlikely allies of the tax preparation services are political conservatives who may hate the current tax code, but who are suspicious of any remedies that might make tax collection become any “easier” for the government.]

Still … it would seem that any serious effort at rethinking the current tax filing system should be given all due consideration, as I have yet to meet anyone who is satisfied with the way things are today.

Where do you come down on the issue? Please share your observations with other readers here.

U.S. Green Energy: Sizzle? … or Fizzle?

Impending doom for Green Energy?  The economic model isn't working.Tempting as it may be to dismiss Solyndra, Solar Power, Beacon Energy, SpectraWatt and other recent horror stories regarding “energy subsidies gone bad” as just examples of governmental ineptitude resulting from overly exuberant ideological thinking coupled with political favoritism … it turns out that these events are also emblematic of a much more fundamental challenge to green energy prospects.

A report released last week warning of problems on the horizon for green energy bears this out. The report, titled “Beyond Boom and Bust,” is a collaborative effort between the Brookings Institution, the Breakthrough Institute and the World Resources Institute (WRI), and was authored by six researchers associated with these organizations.

According to the report, the federal government’s involvement in the renewable energy marketplace has led to an unsustainable system. Among the study’s key conclusions are these eye-opening points:

 Nearly all “clean” tech segments in the U.S. remain reliant on production and deployment subsidies or other policies designed to facilitate gaining an expanding foothold in today’s energy market.

 Many of the nearly 100 individual policies and subsidies that undergird clean energy – grants, tax credits, loan guarantees and the like – are getting ready to expire, with the potential for dire consequences. To illustrate: Total federal spending on the clean tech sector was more than $44 billion in 2009, but would shrink to only ~$11 billion in 2014.

 In the absence of legislation to extend or replace current green energy subsidies, America’s clean tech policy system will be largely dismantled as of the beginning of 2015 because of the scheduled expiration of ~70% of the policy provisions.

In the current political and legislative climate, it’s doubtful that many of the current policies can be expanded or replaced. And even if this could happen, the report sheds doubt on whether such policies can be successful:

“The maintenance of perpetual subsidies is not a sustainable solution to the new challenges facing the U.S. clean tech industry. Clean tech markets in America have lurched from boom to bust for decades, and the root cause remains the same: the higher costs and risks of emerging U.S. clean tech products relative to either incumbent fossil energy technologies or lower-cost international competitors, which makes U.S. clean tech sectors dependent on subsidy and policy support.”

The report makes a number of recommendations for ushering in a “new era” of clean energy policy. Among these are:

 Foster establishment of a competitive market – development policies should create market opportunities for advanced clean energy technologies while fostering competition between technology firms.

 Create market incentives that demand and reward continuing improvement in technology performance and cost.

 Avoid technology lockout and promote a diverse energy portfolio.

Also, the authors emphasize the need for a “new national conversation” to determine the best route forward to accelerate technology improvements and cost reductions in clean tech sectors.

It would be nice if that conversation could start right now. But in an election year … don’t bank on it.

A mobile society? We’re not there again yet.

U.S. Population MigrationLast year, I blogged about a startling development in the mobility of Americans: fewer of us moved in 2008 than in any year going back decades.

If there was any proof of the recession’s toll on the lives of many Americans, this is surely it. Not only that, it reflects the lost allure of many of the “magnet” states of recent decades, particularly Nevada, Arizona, California and Florida.

Now, new data covering 2009 have just been released by the U.S. Census Bureau. The latest information reveals that more Americans moved in 2009 than in 2008 … but it was just a small uptick.

Moreover, the increase in mobility was almost entirely the result of people moving within their home counties – nearly eight times more prevalent than migrating from state to state.

What does this mean? In many instances, intra-county mobility may be the result of people who have moved in with family or to nearby rental properties after having lost their homes to foreclosure.

And the low rates of mobility in general may reflect the unwillingness or inability of people to move because they owe more on their mortgage than their home’s current value, thanks to the collapse of the housing market.

William Frey, a demographer and senior fellow at the Brookings Institution, sums it up this way:

“These data show that the great migration slowdown, which began three years ago, shows no signs of revising to normal U.S. patterns. Since labor migration is often seen as the grease that spurs the flow of goods, capital and job creation, these new numbers are not encouraging.”

Mobility almost always declines during periods of economic hardship. But it’s now clearer than ever that this particular recession has caused the biggest drop in mobility rates America has seen since the days of the Great Depression.