Whether it’s defaulting to preparing the same half-dozen dinner recipes, always taking the same travel route, or preferring traditional hyms and liturgy at religious services, humans tend to be creatures of habit.
Of course, there will always be the minority who revel in being the first to try out novel communications technologies … adopt the newest fashions … or take advantage of the latest investment schemes.
But most people would prefer to hold back and let someone else take the plunge first.
That’s precisely where things stand at the moment with the Bitcoin alternative currency. The “virtual currency” has been around long enough so that it’s now getting coverage in the “popular” press … and there are even a few folks who have begun using it as an alternative to established currencies.
Indeed, for the past year now, a few national retailers and chain foodservice establishments have been accepting payments in Bitcoin currency.
But a just-released survey that queried consumer attitudes about the new-fangled currency – referred to as a “crypto-currency” by some – underscores how steep a climb the Bitcoin has before it can ever be considered a viable alternative to the Dollar or other established currencies.
TheStreet, a digital financial media company, commissioned the survey which was conducted in January 2014 by GfK Custom Research North America’s OMNITEL unit A total of 1,005 telephone surveys were conducted with Americans age 18 or older.
Let’s start out with the most basic finding from the survey: Three out of four respondents aren’t even familiar with the Bitcoin term.
So right off the bat, that’s a major hurdle. The Bitcoin may have been the subject of numerous press stories and broadcast reports, but the news hasn’t seeped into the larger market consciousness to any great extent.
Next … even after the concept of the Bitcoin was described to them, the survey respondents remained distinctly chilly to the idea:
Nearly 80% would “never consider” using an alternative form of currency like the Bitcoin.
~80% would rather own gold than Bitcoin currency.
Did the survey uncover different attitudes based on the age of the respondents? Yes – to a degree:
Just under one-third of young respondents (age 18 to 24) would consider using an alternative form of currency like the Bitcoin … versus only about one in ten seniors (over age 65).
~15% of the young respondents would prefer to own Bitcoin over gold … versus only ~4% of seniors.
~57% of young respondents feel that Bitcoin currency helps the global economy … while just ~14% of senior feel the same way.
The main takeaway from the GfK/OMNITEL research? Bitcoin proponents are going to have to keep plugging away for a good long time before positive public perceptions of an alternative currency take hold — including needing to focus on the most basic educational elements.
Considering the level of financial literacy out there … good luck with that effort.
If any readers have ever used Bitcoin as a currency and would care to comment on their experience pro or con, please share your thoughts here.
The degree of pessimism manifests itself in a higher percentage of adults believing that the economy will get worse (~32%) compared to those who feel it will get better (~27%).
The most optimistic contingent are Baby Boomers (age 49 to 67), where nearly 30% feel the economy will improve in 2014. The opposite is true with the very youngest group (age 18 to 36), where only ~23% think the American economy will improve this year.
And the most pessimistic group when it comes to believing the economy will get worse? That would be the oldest contingent (people age 68 and older), ~40% of whom share this opinion.
The message Americans seem to be sending is this: “We may be in the fifth year of a recovery … but we’re still waiting for it to hit us.”
Comparing these Harris figures to what the pollsters recorded a year earlier, it’s interesting that the percentage of people who envision the economy “staying the same” has grown by ~11 percentage points. So, treading water appears to be the order of the day.
How Americans are responding in their own personal lives to their views of the economy correlate to their level of general optimism or pessimism. Here’s what the survey found in terms of their intentions for the year:
Cut back on my household spending: ~45%
Save more in the year ahead: ~40%
Pay down my debt level: ~40%
Save more for retirement: ~23%
Get rid of one or more credit card: ~15%
Broadly speaking, the Harris poll findings point to a distinctly blasé environment. And it helps explain the mediocre holiday shopping season we just witnessed – more than inclement weather and a shorter shopping days calendar can explain.
For anyone who thinks he or she is circumventing web tracking via enabling Do Not Track (DNT) functionality … think again.
A recently released study from researchers at KU Leuven-iMinds, a Dutch-based university think tank, shows that nearly 150 of the world’s leading websites have ditched tracking cookies in favor of “device fingerprinting” (or “browser fingerprinting” as it’s sometimes called).
What’s that? It’s the practice of evaluating selected properties of desktop computers, tablets and smartphone to build a unique user identifier. These properties include seemingly innocuous details found on each device, such as:
Versions of installed software and plugins
Screen size
A listing of installed fonts
An analysis by the Electronic Frontier Foundation (EFF) has shown that for the majority of browsers, the combination of these properties creates a unique ID – thereby allowing a user to be tracked without the perpetrator needing to rely on cookies — or having to deal with pesky legal restrictions pertaining to the restriction of cookies’ use.
Overwhelmingly, browser fingerprinting targets popular and commonly used JavaScript or Flash functions, so that nearly every person who accesses the web is a target – without their knowledge or consent.
According to the Leuven-iMinds analysis, the use of JavaScript-based fingerprinting allows websites to track non-Flash mobile phones and devices. So it’s cold comfort thinking that the iPad platform will offer protection against this form of “non-cookie tracking.”
Is there anything good about device fingerprinting? Perhaps … in that it can be used for some justifiable security-related activities such as protection against account hijacking, fraud detection, plus anti-bot and anti-scraping services.
But the accompanying bad news is this: It can also be used for analytics and marketing purposes via the fingerprinting scripts hidden behind banner advertising.
How to fight back, if one is so-inclined? The Leuven-iMinds researchers have developed a free tool that analyzes websites for suspicious scripts. Known as FPDetective, it’s being made available to other researchers to conduct their own investigations.
So you’re able to identify the offenders. But then what — short of never visiting their websites again?
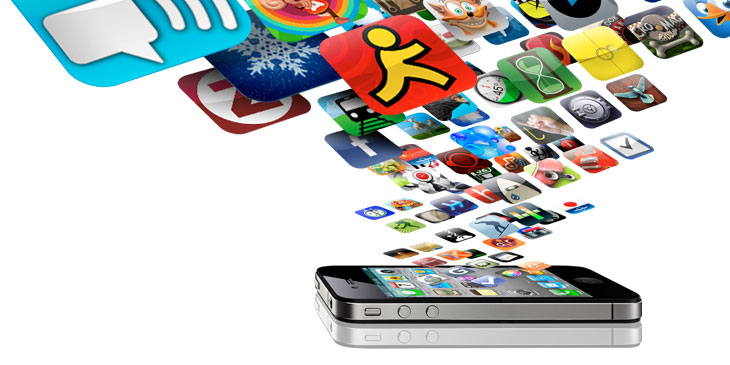
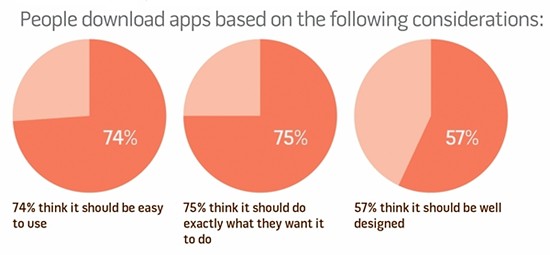
Here’s an interesting statistic offered up by marketing consultant Rich Meyer: Three-fourths of mobile apps are deleted within three weeks of being downloaded by their users.
How can the attrition rate be so high?
According to Meyer, it’s because people decide they don’t really have a need for the apps … or they find them too difficult to use and master.
I suspect the percentage may also be so high because marketers fail to query their target audiences prior to developing apps to determine now much of a need it will be satisfying.
… Or to put it another way, to avoid falling into the trap of developing a cure for something that isn’t a disease.
Sources: MarketingProfs; Harris Interactive and EffectiveUI field survey, 2010.
Meyer believes part of the dynamic at work is a knee-jerk “bias for action” as the marketing playing field shifts endlessly.
“It’s called ‘do it’ because everyone else is doing it, and it results in not only bad marketing, but in turned off consumers and customers,” he maintains.
Questions as simple as “What would you like to see in a mobile app?” … or testing an app concept with a sample of potential users before spending the effort and energy to produce it would be good places to start.
Marketers can use the research findings to adjust the proposed design of an app — or to trash it altogether and come up with an alternative one that actually meets a need.
If more companies did this, perhaps the 75% deletion rate for mobile apps would cease to be so flat-out dismal.
Like self-driving cars, Google Glass devices – those intriguing contraptions that allow users to be “online connected” at all times – appear to be one of those innovations that spark a thousand “what if?” scenarios.
And it’s not at all clear what all the implications of Google Glass may be. But we’re beginning to get some clues as to what’s in store for users.
For starters, Google Glass owners have been sternly warned against using them in locker rooms, movie theaters, casinos … and even restaurants.
And earlier this month, attorney Paul Alan Levy of Public Citizen, a consumer advocacy group, claimed that Google Glass wearers in some states could potentially face prosecution for recording people without their explicit consent.
“Many states require the consent of all parties in a conversation – at least, conversations not occurring in public situations – and provide both criminal penalties and a civil cause of action for participants.”
While such laws are on the books in just 12 states at the moment, collectively those jurisdictions represent more than a third of the American population (including the all-important states of California, Florida, Pennsylvania and Illinois).
So far, there doesn’t appear to be any record of prosecutions pertaining to using a Google Glass device to record someone without his or her consent. But since these devices are such a rarity yet, that seems hardly surprising.
Too, there’s the possibility that the courts will rule that people are giving the wearer of a Google Glass device implicit consent to record them. However, there’s something to the notion that many people would be basically clueless about whether they’re being recorded because of their unfamiliarity with the device and the technology.
And as if that angle isn’t enough, now there’s a company (FacialNetwork) that has developed a real-time facial recognition app for Google Glass. With this app, called NameTag, people can snap a photo and search for more information online about the image – all in one action.
With new technology like this, finding a mate (or just a good-time girl or guy) will never be the same again.
Nor will the inevitable charges of invasion of privacy or stalking that follow.
Of course, to hear how the folks at FacialNetwork characterize it, you’d never think there were any potential negative consequences. Instead, it’s all sweetness and light. As NameTag co-creator Kevin Tussy puts it:
“It’s not about invading anyone’s privacy; it’s about connecting people that want to be connected. We will even allow users to have one profile that is seen during business hours, and another that is only seen in social situations.”
It’s been more than 35 years since I began my post-collegiate working career in the commercial banking business. At that time, there were well more than 17,000 federally chartered banking institutions in the United States.
The reasons for the high tally were clear. Most states didn’t allow commercial branch banking across state lines. And quite a few others – mainly in the Midwest and Plains regions – put severe restrictions on state branch banking as well.
That’s why states like Illinois and several others could have as many as 1,500 or more independent banking institutions each.
Of course, this hardly meant that these banks were operating in a vacuum. Not only were there efficient automated clearing houses to process interbank transactions, there were also robust correspondent banking networks interlinking smaller and larger banks.
These networks enabled community banks to offer many of the same deposit, lending and cash management services provided by the larger institutions.
“Bigger is Better …”
Beginning in the late 1980s and early 1990s, many of the regulatory barriers began to fall. States relaxed prohibitions on branch banking, while branching across state lines became common. It wasn’t long before a string of acquisitions created large, consolidated banks. The banking system began to look a lot more like Europe and Canada and a lot less like … well, the United States.
But then a countervailing trend developed, and it wasn’t the proverbial “dead-cat bounce.” Consolidation caused voids in local banking coverage in many regions. As a result, some businesses and consumers sought a return to banking institutions where ownership and management were part of the community, and where decision-making was based on a more intimate knowledge of the local economy.
So the commercial banking industry actually witnessed an uptick in the number of institutions during the late 1990s and early 2000s.
… Until the Great Recession of 2008/09 hit.
Today, the number of federally chartered U.S. banking institutions now stands at its lowest level since the Great Depression.
The stark facts are these: A sluggish economy, low interest rates and ever-more complex regulations have diminished the number of federally chartered institutions to below 6,900. The tally, according to FDIC stats, had never fallen below 7,000 since the mid-1930s.
Almost entirely, the recent numerical decline has come among smaller institutions – those with fewer than $100 million in assets. And of the more than 10,000 banks that are now gone, it isn’t only because of mergers and consolidations. Nearly 20% of them simply collapsed.
We’re not simply dealing with a reduction in banking charters; the number of physical bank locations is also declining – by about 3% since late 2009, thanks in part to the rise of online banking in addition to institutional consolidation.
John Barlow
I asked banking industry specialist John Barlow for his thoughts on the latest bank figures. Not only is this expert head of Minneapolis-based Barlow Research, Inc., a nationally recognized financial services industry market research and consulting firm that counts the largest U.S. institutions among its client base, Barlow is also chairman of Iowa Falls State Bank, a family-owned institution that could be characterized as the quintessential “local bank.” (He’s also a former boss of mine back when I was working in the banking industry during the 1970s.)
Barlow noted an additional point about small banks: “By their very nature, community banks are typically closely held – often family-owned enterprises. A significant headwind for continued ownership is the transition of the business to a younger generation. The Baby Boomers had smaller households, and their children are more likely to move away from the business – mentally as well as geographically.”
… or Is it Not Better?
There may be something of a silver lining in the recent trends, however. Actual bank deposits have continued to grow, and consolidations have helped alleviate concerns that an abundance of separate banks leads to lower efficiencies in the financial system and more difficulties in conducting regulatory oversight.
… But only to a degree. “It remains to be seen where the economies of scale exist in banking. According to our studies at Barlow Research, larger banks do appear to be more efficient at generating income. But that’s because they’re more aggressive at charging fees, not because of lower costs,” Barlow reports.
David Kemper, CEO of Missouri-based Commerce Bancshares, may have a point when he notes, “There’s no reason why we need [so] many banks, especially if those smaller banks have a much lower return on capital. The small banks’ bread-and-butter is just not there anymore.”
[To that point, Barlow contends that one of the reasons smaller banks have a lower return on capital is that they have too much capital.]
There’s an important counter-argument to the “consolidation is better” view. It goes like this: Community banks remain critically important to the economy because they are the ones more likely to engage in small-business lending.
Barlow Research’s statistical studies show that the small businesses that deal with community banks are more likely to be able to secure a loan. And the average size of that loan will be larger than one obtained from a large institution.
The Most Startling Trend?
Another FDIC statistic might be the most startling trend of all. Over the decades, each year has witnessed new bank startups – ranging from at least a handful to the low hundreds in any given year. But that’s all changed since the Great Recession.
In fact, there has been just one new federally approved bank charter issued since 2010.
That institution, the Bank of Bird-in-Hand (located in Lancaster County, Pennsylvania), was able to raise approximately $17 million in investment capital. But it also had to expend nearly $1 million in consulting and legal fees to properly prepare its application for a new charter — including spelling out policies and procedures detailing its systems to guard against cyber-attacks and other security risks.
“Intense” doesn’t tell the half of it when describing the effort needed to obtain a new Federal bank charter.
Considering those hurdles, what made the Bird-in-Hand investors think they could run a profitable banking operation in today’s economic and business climate? It’s because they see an opportunity in serving a local community heavily populated by Amish and other rural/farming families. Banking-wise, it’s an underserved community.
There once was a local independent bank, of course … but that one was acquired by a larger entity in 2003. The new bank’s investors believe they can provide services that are better suited to the needs of the local community – which, in turn, will make their new bank successful.
John Barlow adds this observation about community banking: “A well-managed community bank is one of the best investments you can make, as long as you do not make bad loans. Do that, and it’s all over in a couple years.”
And about the degree of governmental regulation in the industry, he remarks: “I grew up in a banking family. My grandfather and father complained about regulators all the time. Banks are regulated businesses: What’s new about that?”
Barlow and the Bird-in-Hand bank investors may well be right about the prospects for smaller banks in America. Still … one wonders how many new banking institutions will be starting up in the current economic and regulatory environment.
… Or that the prospective investors will determine that it’s even worth the effort.
Here’s a statistic that surprises no one, probably: As of November 1st, more than one in five U.S. consumers had already begun their holiday season shopping.
Considering that many merchants begin pushing online and in-store holiday sales in October, it’s hardly any wonder.
In fact, marketing firm IgnitionOne is predicting that American consumers will spend 11% more during Thanksgiving weekend than they did last year.
Some of the increase is undoubtedly due to the calendar; Thanksgiving weekend is nearly a full week later than it was in 2012.
And other forecasting data don’t presage a big jump in holiday sales this year.
According to the National Retail Federation, sales are expected to be “not too hot … not too cold” – up a tad from 2012 but not at the growth level witnessed in 2010 and 2011:
2009: 0.5% sales increase over previous year
2010: 5.3% increase
2011: 5.1% increase
2012: 3.5% increase
2013 (forecast): 3.9% increase to $602 billion
Clues to the reasons behind the middling sales growth forecast can be found in Nielsen’s Holiday Spending Forecast report, in which American consumers describe their financial circumstances in these terms:
Two-thirds still feel like they’re in a recession.
Half are limited to spending funds on only the basics.
One in five has no spare cash at all.
How this translates to the amount of dollars consumers expect to spend on their holiday shopping breaks down as follows:
~44% will spend less than $250 this season
~30% will spend between $250 and $500
~20% will spend between $500 and $1,000
~6% will spend more than $1,000
As in years past, the most popular gift item promises to be … gift cards. Technology products, toys, food and apparel round out the “top five” holiday gifts. This is little changed from last year.
And here’s one other stat that retail establishments must be looking at: Mobile commerce sales grew by ~16% during the holiday season between 2011 and 2012, and ~18% of shoppers checked out deals on their mobile devices.
Those percentages are bound to increase this year.
It’s a question many people are asking: To what extent is the digital revolution fundamentally changing shopping habits?
A new report from Forrester Research titled “U.S. Cross-Channel Retail Forecast, 2012 to 2017” attempts to answer this question.
Its prediction: just over 10% of total U.S. retail sales will be online purchase in five years’ time.
By comparison, in 2012, e-commerce accounted for about 5% of total U.S. retail spending, so Forrester is projecting a doubling of e-commerce volume.
Forrester also projects that by 2017, ~60% of retail sales in the United States will involve the Internet – either as a direct commercial transaction or as part of buyers’ pre-purchase research on laptops, tablets or smartphones.
The sectors most likely to be influenced by online research are grocery, apparel, home improvement and consumer electronics – no doubt abetted by the ability to access customer reviews and comparison prices during shopping excursions, Forrester reports.
These findings and more are included in Forrester’s report which can be found here (it’s a for-purchase study).
The thrill has gone, to linger on would spoil it anyhow … for the party’s over now.
— Noël Coward
The chart above isn’t the descent of the Matterhorn … it’s the downward trajectory of Barack Obama’s approval ratings in the Gallup Poll since his reelection last year.
No good end: Explorer Edward Whymper’s climbing team shortly after reaching the summit of the Matterhorn (1865).
So it is a descent of sorts. And it’s beginning to look eerily similar to what befell George W. Bush and his poll numbers at roughly the same period in his presidency, as this comparative graph prepared by the Pew Research Center illustrates:
One can point to specific events during each administration that could be inflection points in the public’s changing perception of presidential performance: The Iraq War surge … Hurricane Katrina … the Affordable Care Act rollout … the Benghazi Consulate attack … the NSA eavesdropping scandal and so forth.
But I wonder if it’s actually those elements … or is it more that we fickle Americans are prone to tire of our presidents after about the fifth year or so.
Hearing one speech or one press conference too many … or perhaps hearing a statement or two by the administration that doesn’t ring quite true. It’s not a big step to go from those unpleasant interactions to simply tuning out.
Whatever it is, we’re probably in the midst of witnessing a break between the public and the Obama administration that’s here to stay for the remainder of the President’s term.
Of course, the chart above also reminds us that second term presidential popularity trends looked somewhat different if we dip back in history 15 years or further.
What are your thoughts on today’s developments? Is this the “new normal” for Americans in our “instant gratification” age? Or do you see the dynamics differently? Feel free to share your comments with other readers here.
Indeed, in certain states that are in close physical proximity to time zone boundaries, the issue can be controversial enough to affect the popularity of elected officials, as has happened in Indiana and Arizona.
Daylight savings time, an innovation that became popular in the 1970s, continues to be a nettlesome issue because of when it is in effect in the United States – nearly a month earlier and a month later than before … and no longer in sync with other countries (if they even observe DST — and many of them don’t).
Daylight savings time is supposed to be more energy-efficient. But it turns out the energy savings are minimal if any. Uncoordinated time changes could very well undermine economic efficiency far more than any positive impact in energy savings.
A case in point: Lack of synchronization with European time changes is estimated to cost the airline industry nearly $150 million in travel disruptions each year.
Does the current time zone structure have to be cast in stone? Of course not. The history of “time” is actually one of pretty constant change, dating all the way back to when time zones were first implemented in the 1880s.
Before then, each city and town had its own local time which was established by calculating the solar time in the local location using sundials. Effectively, this meant that there were more than 300 different time zones in the U.S.A.
The American railroads were more streamlined: They operated with only about 100 time zones.
Clearly, introducing four time zones for the continental U.S. was a way to introduce simplicity while compromising only a little regarding human biorhythms.
Of course, it took awhile for the time zone system to be adopted worldwide, but eventually it happened.
The economic and commercial landscape looks far different today than in the late 19th Century. We are no longer bound by the physical limitations of geography in terms of how we do business.
As a result, some economists are suggesting that it’s time to overhaul the time zone structure and to move to a system that is even simpler and less disruptive to people’s lives.
One economist, Allison Schrager, has come up with the most radical solution I’ve seen yet. Drawing from economic models plus her own experiences working across multiple time zones, Dr. Schrager has put forward the following recommendations:
Scrap daylight savings time altogether
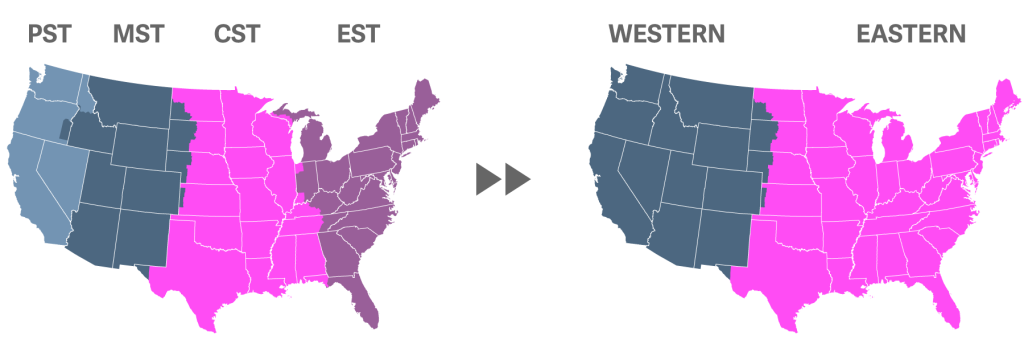
Consolidate and reduce the four current continental U.S. time zones (Eastern, Central, Mountain, Pacific) to just two (Eastern, Western)
Under the Schrager scenario, the new time zone map for the continental United States would look like this:
Dr. Schrager points out that, while a fewer number of larger time zone geographies would seem to remove some people further from their “true” time zone, the realities of global commerce are already doing that anyway.
By contrast, she sees the benefits as more major. For example, frequent travel between time zones under today’s four zones causes jet lag, robbing employees of productive work time.
With just a one-hour time difference between New York and California, bi-coastal travel would become almost effortless in that regard, Schrager maintains.
As for the disruption such a change might cause to international business coordination, Dr. Schrager contends that just as it took one or two countries to start things off in the 1880s, someone needs to step up to the plate today to start a new trend.
She says: “… America won’t line up with the time zones of countries directly north and south unless this catches on as a global trend. But the discontinuity ship already sailed when rich Western countries haphazardly adopted daylight savings time and most other countries didn’t. Time is already arbitrary; why not make it work in our favor?”
Does Dr. Schrager raise some good points? Would simplifying the time zone map and ditching daylight savings time be a “net positive” or not?
Some of her arguments seem to make sense to me. What do you think? Please share your thoughts with other readers if you’re so inclined.


 Next … even after the concept of the Bitcoin was described to them, the survey respondents remained distinctly chilly to the idea: