The “Millennial Effect” – and how it’s affecting the Boomer Generation.

bm

In the world of marketing communications, it seems that confluence is in the air. This point was underscored recently by Eric Trow, a MediaPost columnist who is also vice present of strategic services at Pittsburgh, PA-based marketing communications firm Gatesman+Dave.

Trow’s main point is this:  Despite the big differences that marketers have traditionally noted between members of the Boomer Generation and their younger Millennial counterparts, today the two groups are becoming more similar than they are different.

In particular, Boomers are beginning to act more like Millennials.

Trow identifies a set of fundamental trending characteristics that underscore his belief:

  • Boomers increasingly want instant gratification – and related to that, they want convenience as well.
  • Boomers are embracing technology more every day, including being nearly as dependent on mobile devices as their younger counterparts.
  • Boomers connect online – with adults over the age of 65 now driving social media growth more than any other generation at the moment.
  • Boomers want control – and to that end, they do their research as well.
  • Boomers want to live healthier – with levels of interest in natural, healthy and environmentally responsible products rivaling those of younger age groups.
  • Boomers are more questioning of traditional authority – and not just because of the 2016 U.S. presidential election race, either.

Putting it all together, Trow concludes that he and many other Boomers could, in practice, be classified more accurately as “middle-aged Millennials.”

Speaking as someone who falls inside the Boomer generation age range, I concede many of Trow’s points.

But how about you?  Do they ring true to you as well?

The Top Ten U.S. Cities for Stretching a Dollar

… They’re pretty nice in other ways, too.

Wausau, Wisconsin
Wausau, Wisconsin

A few months ago, my eldest daughter received her graduate degree in higher education academic counseling, and immediately thereafter started a new career position at a university located in a medium-sized city in the state of Wisconsin.

Of course, the main attraction was the job position itself and the potential it offers for professional growth.

But another important factor was the cost-of-living dynamics in an urban area where real estate and other costs are clearly more “friendly” to a career person just starting out.

Along those lines, the recent publication of CareerCast.com‘s newest “Ten Best Cities for Return on Salary” is revealing.

What it shows is that for young professionals just beginning in their careers – and likely saddled with student loans that are a significant chunk of change – the top cities for “stretching a dollar” aren’t particularly known for being the hippest places around.

By the same token, they aren’t the dregs, either.

Here’s CareerCast’s “Top 10” listing in order of the most budget-friendly cities:

  • #1 most budget-friendly: Wausau, WI
  • #2: Tucson, AZ
  • #3: Pittsburgh, PA
  • #4: Midland, TX
  • #5: Lincoln, NE
  • #6: Houston, TX
  • #7: Fort Worth, TX
  • #8: Durham, NC
  • #9: Columbus, OH
  • #10: Austin, TX

Scanning the roster, you might see a few surprises.

One shows up as #10 on the list; certainly no one is going to accuse Austin of being anything less than trendy.  Houston and Fort Worth (#6 and #7 on the list) are major metropolises.

Affordable, livable housing in Pittsburgh, Pennsylvania

And more people are falling in love with the charms of Pittsburgh, PA (#3 on the list) – especially when compared to its old, worn-out and unsafe urban counterpart on the other side of the state.

The Midwestern cities on the list might not be the end-all in trendiness, but one can’t complain about quality-of-life factors like friendly neighborhoods and lower crime rates in places like Lincoln, Columbus and Wausau.

And if nothing else, Midland is the city that played host to President George W. Bush in his formative years …

Overall, I think it can be said that these ten cities aren’t a bad set of choices for young working professionals. The fact that they also happen to be the best ones for stretching a dollar is just icing on the cake.

Quick-change artistry: Masculinity goes from “alpha-male” to “alta-male” inside of a generation.

Alpha-male: Venezuelan actor Alejandro Nones
Alpha-male: Venezuelan/Mexican actor Alejandro Nones

Many people contend that changes in society are driven by many influences – not least movies and music. Certainly, the popular arts reflect the current culture, but they also drive its evolution.

This view was underscored recently in the results of field research conducted by a British- and Singapore-based survey firm Join the Dots for Dennis Publishing, which has just launched Coach, a magazine in the U.K.

The magazine’s audience consists of men who are committed to lifestyles that make themselves “healthier, fitter and happier.”

The research aimed to figure out what are today’s characteristics of being “male.” An in-depth qualitative focus group session with men aged 22 to 60 helped establish the set of questions that was then administered in a quantitative survey of ~1,000 respondents (including women as well as men) between the ages of 25 and 54 years old.  The survey sample represented a diverse mix of family status, sexual preferences, incomes, professions and interests.

The survey questions focused on the habits and aspirations of men … and the results showed how far we’ve come from the heydays of the “alpha-male” barely 25 years ago.

The researchers contrasted good and not-go-good alpha-male stereotypes (self-absorbed … unwilling or unable to talk about insecurities or vulnerabilities) with a new persona they dubbed the “alta-male.”

The alta-male is a man who values work/life balance and finds personal fulfillment as much in self-improvement as in material wealth.

Additionally, the alta-male tends to reject male role models from earlier generations, instead opting to establish their own identity based on a myriad of diverse influences.

Of course, it’s one thing to aspire to these goals and quite another to actually attain them. The study found that two-thirds of the respondents are finding it difficult to achieve the satisfactory work/life balance they desire.

On the other hand, alta-males tend to be more adaptable, and they’re willing to embrace uncertainty more than the alpha-males of yore.

Even more strongly, alta-males are seekers of experiences, which they value over “mere money” – despite recognizing that it takes money to partake in many such life experiences.

Perhaps most surprising, the study found little difference in perspectives between older and younger male respondents.

It turns out that older men are just as likely to have an “alta-male” attitude towards life.  So clearly, the culture has been rubbing off on them, too.

From my own personal standpoint (as someone whose been around the track quite a few times over the decades), I sense a similar shift in my own personal perspectives as well.

What about the rest of you?

Cutting Some Slack: The “College Bubble” Explained

huThere are several “inconvenient truths” contained among the details of a recently released synopsis of college education and work trends, courtesy of the Heritage Foundation. Let’s check them off one-by-one.

The Cost of College

This truth is likely known to nearly everyone  who has children: education at four-year educational institutions isn’t cheap.  Here are the average annual prices for higher education in the United States for the current school year (includes tuition, fees, housing and meals):

  • 4-year public universities (in-state students): ~$19,550
  • 4-year public universities (out-of-state students): ~$34,000
  • 4-year private colleges and universities: ~$43,900

These costs have been rising fairly steadily for years now, seemingly without regard to the overall economic climate. But the negative impact on students has been muted somewhat by the copious availability of student loans — at least in the short term until the schedule kicks in.

The other important mitigating factor is the increased availability of community college education covering the first two years of higher education at a fraction of the cost of four-year institutions.  Less attractive are “for-profit” institutions, some of which have come under intense scrutiny and negative publicity concerning the effectiveness of their programs and how well students do with the degrees they earn from them.

Time Devoted to Education Activities

What may be less understood is the degree to which “full-time college” is actually a part-time endeavor for many students.

According to data compiled by the Bureau of Labor Statistics over the past decade, the average full-time college student spends fewer than three hours per day on all education-related activities (just over one hour in class and a little over 1.5 hours devoted to homework and research).

It adds up to around 19 hours per week in total.

In essence, full-time college students are devoting 10 fewer hours per week on educational-related activities compared to what full-time high school students are doing.

Lest this discrepancy seem too shocking, this is this mitigating aspect:  When comparing high-schoolers and full-time college students, the difference between educationally oriented time spent is counterbalanced by the time spent working.

More to the point, for full-time college students, employment takes up ~16 hours per week whereas with full-time high school students, the average time working is only about 4 hours.

Full-Time Students vs. Full-Time Workers

Here’s where things get quite interesting and where the whole idea of the “college bubble” comes into broad relief. It turns out that full-time college students spend far less combined time on education and work compared to their counterparts who are full-time workers.

Here are the BLS stats:  Full-time employees work an average of 42 hours per week, whereas for full-time college students, the combined time spent on education and working adds up to fewer than 35 hours per week.

This graph from the Heritage Foundation report illustrates what’s happening:

CT

Interestingly, the graph insinuates that full-time college students have it easier than many others in society:

  • On average, 19-year-olds are spending significantly fewer hours in the week on education and work compared to 17-year-olds.
  • It isn’t until age 59+ that people are spending less time on education and work than the typical 19-year-old.

No doubt, some social scientists will take these data as the jumping off spot for a debate about whether a generation of “softies” is being created – people who will struggle in the rigors of the real world once they’re out of the college bubble.

Exacerbating the problem in the eyes of some, student loan default rates aren’t exactly low, and talk by some politicians about forgiving student loan debt is a bit of a lightning rod as well.  The Heritage Foundation goes so far as to claim that loan forgiveness programs are leaving taxpayers on the hook for “generous leisure hours,” since ~93% of all student loans are originated and managed by the federal government.

What do you think? The BLS stats don’t lie … but are the Heritage Foundation’s conclusions off-target?  Please share your thoughts with other readers here.

Journalism’s Slow Fade

jjLate last month, the 2016 Lecture Series at the Panetta Institute for Public Policy in Carmel, CA hosted a panel discussion focusing on the topic “Changing Society, Technology and Media.”

The panelists included Ted Koppel, former anchor of ABC News’ Nightline, Howard Kurtz, host of FAX News’ Media Buzz, and Judy Woodruff, co-anchor and managing editor of the PBS NewsHour show.

During the discussion, Ted Koppel expressed his dismay over the decline of journalism as a professional discipline, noting that the rise of social media and blogging have created an environment where news and information are no longer “vetted” by professional news-gatherers.

One can agree or disagree with Koppel about whether the “democratization” of media represents regression rather than progress, but one thing that cannot be denied is that the rise of “mobile media” has sparked a decline in the overall number of professional media jobs.

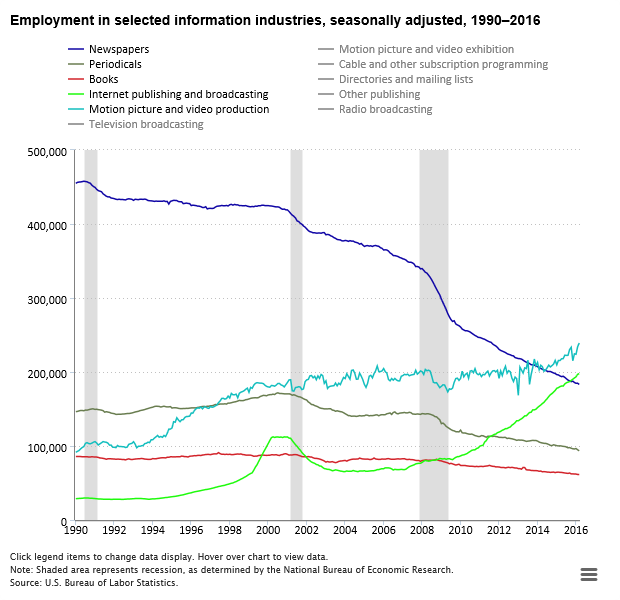
Data from the Bureau of Labor Statistics can quantify the trend pretty convincingly. As summarized in a report published in the American Consumers Newsletter, until the introduction of smartphones in 2007, the effect of the Internet on jobs in traditional media, newspapers, magazines and book had been, on balance, rather slight.

To wit, between 1993 and 2007, U.S. employment changes in the following segments looked like this:

  • Book Industry: Net increase of ~700 jobs
  • Magazines: Net decline of ~300 jobs
  • Newspapers: Net decline of ~79,000 jobs

True, the newspaper industry had been hard hit, but other segments not nearly so much, and indeed there had been net increases charted also in radio, film and TV.

But with the advent of the smartphone, Internet and media access underwent a transformation into something personal and portable. Look how that has impacted on jobs in the same media categories when comparing 2007 to 2016 employment:

  • Book Industry: Net loss of ~20,700 jobs
  • Magazines: Net loss of ~48,400 jobs
  • Newspapers: Net loss of ~168,200 jobs

Of course, new types of media jobs have sprung up during this period, particularly in Internet publishing and broadcasting. But those haven’t begun to make up for the losses noted in the segments above.

According to BLS statistics, Internet media employment grew by ~125,300 between 2007 and 2016 — but that’s less than half the losses charted elsewhere.

All told, factoring in the impact of TV, radio and film, there has been a net loss of nearly 160,000 U.S. media jobs since 2007.

employment-trends-in-newspaper-publishing-and-other-media-1990-2016

You’d be hard-pressed to find any other industry in the United States that has sustained such steep net losses over the past decade or so.

Much to the chagrin of old-school journalists, newspaper readership has plummeted in recent years — and with it newspaper advertising revenues (both classified and display).

The change in behavior is across the board, but it’s particularly age-based. These usage figures tell it all:

  • In 2007, ~33% of Americans age 18 to 34 read a daily newspaper … today it’s just 16%.
  • Even among Americans age 45 to 64, more than 50% read a daily newspaper in 2007 … today’s it’s around one third.
  • And among seniors age 65 and up, whereas two-thirds read a daily paper in 2007, today it’s just 50%.

With trends like that, the bigger question is how traditional media have been able to hang in there as long as they have. Because if it were simply dollars and cents being considered, the job losses would have been even steeper.

Perhaps we should take people like Jeff Bezos — who purchased the Washington Post newspaper not so long ago — at their word:  Maybe they do wish to see traditional journalism maintain its relevance even as the world around it is changing rapidly.

Is there an emerging crisis in caregiving?

ecIt surprised me to learn recently that nearly 45 million American adults are providing unpaid care to family members. And in nearly 80% of the cases, the persons being cared for are over the age of 50.

As it turns out, there are tens of millions of parents and spouses who require daily care.  And for many of folks who take on the role of unpaid caregivers, these tasks are like a second job for them.

Typically, they require a minimum of 20 hours per week (and often far more than that).

Juggling work and life under such circumstances is more than merely an inconvenience. It can also put caregivers’ own health and emotional well-being at risk – not to mention the added financial burdens where all the little extra expenses can add up to be quite a lot.

AARP is asking the question: Is there a coming crisis in senior care?  Looking at this chart, there very may well be one looming on the horizon:

tc


What this chart tells us is that in 2010, the ratio of caregivers to care recipients was about 7:1.  In just 20 years, that ratio will be down to 4:1.  And it’s going to get even worse after that.

It comes down to simple math. The population of Americans over the age of 80 is expected to grow by nearly 45% between 2030 and 2040, whereas the number of available caregivers won’t even begin to keep up (rising by just 10%).

And then there’s looking at the role of caregiving from the other side. As it turns out, there are nearly 8 million children who live in families where a grandparent is the head of household.

The reasons for “grand-families” are varied: military deployment of parents, incarceration, substance abuse or mental illness.  And where these families are found crosses all societal lines.

When you look at it from all the angles, caregiving is a big challenge with no easy answers.  But considering its ubiquity, it’s an issue that doesn’t get the kind of attention it probably should.

If you have personal observations to share based on your own family’s caregiving experiences, I’m sure other readers will find them worth hearing — so jot them down in the comment section below.

State migration trends: A familiar pattern reasserts itself?

During the “great recession” that began in 2008, the United States saw an interruption in a decades-long pattern of more Americans moving away from states in the Midwest and Northeast than moving in, while more moved to states in the South and West.

The break in this pattern was good news for those who had bemoaned the loss of political clout based on the relative changes in state population.

To wit:  In the four census periods between the 1960s and the 2000s, the 11 Northeast states plus DC saw their Electoral College percentage plummet by 15 percentage points, so that today they represent barely 20% of the electoral votes required to elect the U.S. president, with s similar lack of clout in the House of Representatives.

For the 12 Midwestern states, the trends haven’t been much better.

But for a few years at least, states in the Midwest and Northeast stopped shedding quite so many of their residents to the Southern and Western regions of the country.

The question was, would it last?  Now we know the answer:  Nope.

Instead, new census data is showing a return to familiar patterns.  In the past few years, the states with the largest net in-migration of people are these predictable ones in the Sunbelt region:

  • Florida: +200,000 net new migrants
  • Texas: +170,000
  • Colorado: +54,000
  • Arizona: +48,000
  • South Carolina: +46,000

By comparison, woebegone Illinois, beset by state fiscal crises, a mountain of over-bloated state pension obligations and a crumbling infrastructure that causes some people major-league heartburn on a daily basis, experienced a net loss of more than 100,000 people.

New York, Pennsylvania, Michigan, New Jersey and other “rust belt” states aren’t far behind.

This map, courtesy of The Washington Post, pretty much says it all:


untitled


There is one glaring difference today compared to previous decades. Back then, California was always at or near the top in terms of positive net in-migration from other states.  That’s all different now – as California is a state with one of the largest net losses.

What’s particularly telling is that California, which used to share many of the characteristics of other Sunbelt and Western states, now seems much more in line with the Northeast and Industrial Midwest when it comes to fundamental factors like state personal and corporate tax rates, real estate prices, environmental regulations, employment dynamics, unionization rates, and the size of public payrolls as a share of the total labor force.

Based on the entrenched and intractable socio-political dynamics at work, don’t look for the migration patterns to change anytime soon.

What are your own personal perspectives, based on where you live?

Mobile shopping goes majorly mainstream.

untitledFor years, the common perception has been that consumers tend to use their laptops, tablets or mobile devices to research purchases while ultimately visiting a store to make the actual purchase.

And up until now, most studies have shown that no matter what type of digital device consumers use to shop, large majorities prefer to complete the sale in a store or at the mall.

But now a new study is telling us something different. The research, conducted by questioning ~1,000 U.S. consumers by research firm Ipsos, shows that shopping frequency in physical stores hasn’t kept pace with the growth of smartphone shopping.

According to Ipsos, over the past year there has been a significant increase in the amount of smartphone shopping, with two-thirds of respondents reporting that they are doing more of this today:

  • Shopping more frequently via smartphone: ~64%
  • Shopping more frequently via tablet: ~60%
  • Shopping more frequently via desktop computer: ~57%
  • Shopping more frequently via laptop computer: ~57%

At first blush, these figures don’t seem startling at all, considering the rise in the consumer economy over the past year or so.  Moreover, ~41% of the survey’s respondents reported that they haven’t made a significant change in their frequency of shopping in physical stores.

But in considering the ways respondents reported how and where they’ve been shopping less frequently over the past year, the differences appear much more stark:

  • Shopping less frequently via physical store: ~30%
  • Less frequently via desktop computer: ~11%
  • Less frequently via laptop computer: ~11%
  • Less frequently via tablet: ~11%
  • Less frequently via smartphone: ~9%

It even goes further than that. The two groups which seemed most inclined to shop less frequently in physical stores were younger consumers (age 25 and under) as well as consumers who earn more than $100,000 per year.

Add to this the propensity for younger consumers to be using smartphones and tablets more often than their older counterparts, and it’s clear that some of the most prized demographic categories are migrating to smartphone shopping in a big way.

The implications for traditional retail could not be more clear:  adapt your business model or else.

Checking messages: First, last and always.

cemIf you think your personal and professional life has become consumed with checking messages ad nauseum, you’re not alone.

Recently, Adestra and Flagship Research surveyed Internet-using Americans for eMarketer to find out just how pervasive the practice of checking messages has become.

The results surprise no one — even if they’re a bit depressing to contemplate.

Asked to cite when their first message check of the day is typically done, here’s what the eMarketer survey found:

  • I check messages first thing, before anything else: ~39% reported
  • After coffee/tea but before breakfast: ~22%
  • After breakfast but before departing for work: ~20%
  • On the way to work: ~4%
  • Once at work: ~8%
  • Later in the day: ~3%
  • Other responses: ~4%

[I was a little surprised to find myself in a distinct minority (checking messages upon arriving at work) … but I suppose when one gets to the office at 07:00 hrs. each workday, as I do, that may be when most others are en route to the office or still at home.]

Not surprisingly, the “check messages before anything else” contingent is more heavily represented by younger people, with over 45% of the survey’s respondents under the age of 35 reporting that they check messages first thing in the day.

The type of messages in question run the gamut from e-mail to text, social media and voicemail. But it’s overwhelmingly e-mail and text messaging apps that smartphone users check first thing in the day:

  • Text messaging: ~67% check this mobile app first
  • E-mail: ~63%
  • Facebook: ~48%
  • Weather app: ~44%
  • Calendar app: ~30%
  • News app: ~21%
  • Games: ~19%
  • Instagram: ~16%
  • Pandora: ~16%
  • Other social media: ~9%
  • Other apps: ~7%

More details on the eMarketer survey can be found here.

What are your message checking practices — and how are they different or similar to these survey results?

Inked in stone: One societal trend that’s going off the charts.

ttWhat’s one of the biggest societal trends in America nowadays? Believe it or not, it’s the rapidly growing popularity of tattoos.

Once the province of just a slim slice of the American population, today we’re smack in the middle of dramatic changes in attitudes about tattoos.

Let’s begin with figures published by the Harris Poll recently, based on its survey or more than 4,000 American conducted in late 2015. That survey finds that nearly one in three Americans age 18 or older have at least one tattoo (29%, to be exact).

Not only did that percentage surprise me, but also the increase that represents over a similar Harris Poll conducted just four years ago. In that survey, ~21% reported having a tattoo … which means that the nearly 40% more people have tattoos today than in 2010.

Pretty amazing, I thought.  And the surprises don’t stop there, either. Of those people who are tattooed, more than two-thirds report that they have more than one tattoo.

What isn’t surprising at all is that the tattoo craze is most prevalent among younger Americans:

  • Millennials: ~47% report having at least one tattoo
  • GenX: ~36%
  • Baby Boomers: ~13%
  • Matures: ~10%

There are also some locational differences, with rural and urban Americans somewhat more likely to be tattooed than those people who reside in suburbia:

  • Rural folks: ~35% have at least one tattoo
  • Urban dwellers: ~33%
  • Suburbanites: ~25%

[There’s no discernible difference at all between people of differing partisan/political philosophies, according to Harris.]

With such a big increase in tattooing, the next question is, what’s behind the trend? For clues, we can see how respondents described what their tattoo(s) mean to them personally:

  • Makes me feel more sexy: ~33% of tattooed Americans cited
  • Makes me feel more attractive: ~32%
  • Makes me feel more non-conformist/rebellious: ~27%
  • Makes me feel more spiritual: ~20%

[Far smaller percentages felt that their tattoo(s) made them feel more intelligent, more employable, more respected or more healthy.]

But what about regrets? Are there people who wish they hadn’t taken the plunge?  The Harris survey found that approximately one in four respondents do feel at least some regrets about having a tattoo.  The reasons why are varied — yet all pretty obvious:

  • Personality changes … doesn’t fit my present lifestyle
  • The tattoo includes someone’s name I’m no longer with
  • The tattoo was poorly done … doesn’t look professional
  • The tattoo is no longer meaningful to me
  • I was too young when I got the tattoo

In conclusion, I think it’s safe to conclude that tattoos are a generational thing. Those of us north of age 50 don’t have any tattoos — and likely will never get one.

But for the younger generations, not only have tattoos gone “mainstream,” for many they’re a decidedly aspirational thing.  And that, of course, means ever widening acceptance of tattoos along with encountering more of them than ever before.

Comments … thoughts anyone?