In the wake of recent election campaigns and referenda in places like the United States, the United Kingdom, France, Austria and the Philippines, it seems that everyone’s talking about “fake news” these days.
People all across the political and socio-economic spectrum are questioning whether the publishing and sharing of “faux” news items is having a deleterious impact on public opinion and actually changing the outcome of consequential events.
The exact definition of the term is difficult to discern, as some people are inclined to level the “fake news” charge against anyone with whom they disagree.
Beyond this, I’ve noticed that some people assign nefarious motives – political or otherwise – to the dissemination of all such news stories. Often the motive is different, however, as over-hyped headlines – many of them having nothing to do with politics or public policy but instead focusing on celebrities or “freak” news events – serve as catnip-like clickbait for viewers who can’t resist their curiosity to find out more.
From the news consumer’s perspective, the vast majority of people think they can spot “fake” news stories when they encounter them. A recent Pew survey found that ~40% of respondents felt “very confident” knowing whether a news story is authentic, and another ~45% felt “somewhat confident” of that fact.
But how accurate are those perceptions really? A recent survey from BuzzFeed and Ipsos Public Affairs found that people who use Facebook as their primary source of news believed fake news headlines more than eight out of ten times.
That’s hardly reassuring.
And to underscore how many people are using Facebook versus more traditional news outlets as a “major” source for their news, this BuzzFeed chart showing the Top 15 information sources says it all:
CNN: ~27% of respondents use as a “major source” of news
Fox News: ~27%
Facebook: ~23%
New York Times: ~18%
Google News: ~17%
Yahoo News: ~16%
Washington Post: ~12%
Huffington Post: ~11%
Twitter: ~10%
BuzzFeed News: ~8%
Business Insider: ~7%
Snapchat: ~6%
Drudge Report: ~5%
Vice: ~5%
Vox: ~4%
Facebook’s algorithm change in 2016 to emphasize friends’ posts over publishers’ has turned that social platform into a pretty big hotbed of fake news activity, as people can’t resist sharing even the most outlandish stories to their network of friends.
Never mind Facebook’s recent steps to change the dynamics by sponsoring fact-checking initiatives and banning fraudulent websites from its ad network; by the accounts I’ve read, it hasn’t done all that much to curb the orgy of misinformation.
Automated ad buying isn’t helping at all either, as it’s enabling the fake news “ecosystem” big-time. As Digiday senior editor Lucia Moses explains it:
“One popular method … is tapping the competitive market for native ad widgets. Taboola, Revcontent, Adblade and Content.ad are prominently displayed on sites identified with fake news, while there are a few retargeted and programmatic ads sprinkled in. Publishers install these native ad widgets with a simple snippet of code — typically after an approval process — and when readers click on paid links in the widget, the host publisher makes money. The ads are made to appear like related-content suggestions and often promote sensational headlines and direct-marketing offers.”
So attempting to solve the “fake news” problem is a lot more complicated than some people might realize – and it certainly isn’t going to improve because of any sort of “political” change of heart. Forrester market analyst Susan Bidel sums it up thus:
“While steps taken by … entities to curb fake news are admirable, as long as fake news generators can make money from their efforts, the problem won’t go away.”
So there we are. Bottom-line, fake news is going to be with us for the duration – whether people like it or not.
What about you? Do you think you can spot every fake news story? Or do you think at least of few of them come in below radar?
In today’s world of marketing, it’s been obvious for some time that the pace of technological change is dramatically shortening the life cycle of marketing techniques.
Consider online search. Twenty-five years ago it was hardly a blip on the radar screen. Picking up momentum, paid search soon began to rival traditional forms of advertising, as companies took advantage of promo programs offered by Google and others that aligned neatly with consumers when they were on the hunt for products, services and solutions..
Google has attracted billions upon billions of dollars in search advertising revenue, becoming one of the biggest corporations in the world, even as entire industries have grown up around optimizing companies’ website presence and relevance so as to rank highly in search query results.
And now, thanks to continuing technology evolution and the emergence of the Internet of Things, the next generation of search is now upon us – and it’s looking likely to make keyboards and touchscreens increasingly irrelevant within a few short years.
Searches without screens are possible thanks to technology like Google Assistant, Amazon Echo/Alexa, and software development kits from providers like Soundhound and Microsoft.
It’s happening already, actually. In web search, Amazon Echo answers voice queries, while the Bing knowledge and action graph allows Microsoft to provide answers to queries rather than a set of answer possibilities in the form of links as has been the case up to now.
Gartner envisions voice interactions overtaking typing in search queries because it is so much easier, faster and more intuitive for consumers. By eliminating the need for people to use eyes and hands for search and browsing, voice interactions improve the utility of web sessions even while multitasking takes on ever-increasing degrees of shared activity (walking, driving, socializing, exercising and the like).
Related to this, Gartner also predicts that one in five brands will have abandoned offering mobile apps by 2019. Already, many companies have found disappointing levels of adoption, engagement and ROI pertaining to the mobile apps they’ve introduced, and the prognosis is no better going forward; the online consumer is already moving on.
Gartner’s predictions go even further. It envisions ever-higher levels of what it calls “just-in-time knowledge” – essentially trading out searching for knowledge by simply getting answers to voice queries.
Speaking personally, this prediction concerns me a little. I think that some people may not fully grasp the implications of what Gartner is forecasting.
To me, “just-in-time knowledge” sounds uncomfortably close to being “ill-educated” (as opposed to “uneducated”). Sometimes, knowing a little bit about something is more dangerous than knowing nothing at all. Bad decisions often come from possessing a bit of knowledge — but with precious little “context” surrounding it.
With “just-in-time knowledge,” think of how many people could now fall into that kind of trap.
One of the neat aspects of online shopping is the ability to learn about consumer behaviors almost in real-time. No waiting around for published reports that are released months after the fact.
Moreover, we can know quite a bit more than simply gross sales figures, including traffic stats.
In fact, we already have extensive information available about consumer online shopping activities in the 2016 holiday season, thanks to data released by firms such as Connexity’s Hitwise division, which measures consumer behaviors across desktop, tablet and smartphone devices.
From Hitwise, we know that its Top 500 retail websites received more than 335 million visits on Thanksgiving Day alone. That averages out to just under 14 million visits per hour … but the time period of 8 pm to 11 pm had more than 50% greater traffic compared to the hourly average for the day.
Amazon.com was among the retailers receiving extensive traffic volume from 8 pm onward – in its case ~25% of its total traffic on Thanksgiving came in those final four hours of the day.
One supposes that after the “big meal,” the “big game” and the “big cleanup,” consumers decided cap off the day by plunking down at their computers or smartphones for some heavy-duty online shopping.
Hitwise found that Black Friday online shopping dynamics were different, with the top retail sites being busiest in the late morning hours, when site visits were around half again larger than Black Friday’s daily hourly average.
As for Cyber Monday, Hitwise found that consumer online shopping dynamics weren’t very much different from any other typical Monday – except that the overall volume (nearly 330 million visits) was substantially higher than the typical Monday volume of ~200 million visits. That, and a slightly greater-than-average share of online shopping happening in the early morning hours of 6, 7 and 8 am.
As for the persistent belief that Cyber Monday has more people shopping online during their time in the office, Hitwise is not seeing that phenomenon any longer.
Again, not very surprising in that more consumers have 24/7 access to digital devices in 2016 than they did ten or even just five years ago.
The Hitwise report for 2016 includes extensive findings not just on hourly shopping patterns, but also on product searches and key traffic drivers for the major online shopping websites. More data can be found on the Connexity/Hitwise website.
As in every year, 2016 has seen the fall of famous brands; some are young upstarts that flamed out quickly, but others are venerable names that have been with us for decades.
Here are ten of the more notable casualties of the year – albeit a few of them still kicking but for all intents and purposes, going lights-out:
A&P – This brand name goes back 150 years … but eventually even venerable A&P couldn’t survive in the cutthroat grocery market. Actually, this brand’s been on life support for a while now, but has always managed to scrape by. No longer. Albertstons Companies – itself facing big competition in the grocery segment – has purchased the remaining 600 A&P outlets and will re-brand those it keeps open under its Acme brand name. Nevertheless, at a century and a half it’s been quite a run – one that only a very few other brands can match.
American Apparel – When a once high-flying apparel company has its equally high-flying chief executive fending off salacious reports of secretly recorded sex videos – yes, they’re on the Internet – coupled with spiraling debt levels and plummeting sales, can Chapter 11 be far behind? You already know the answer.
Office Max – Sales at the big three U.S. office supply chains have struggled for a number of years, but Office Max was the one to fall victim first. Its merger in 2013 with Office Depot began the brand’s slide, and now the final nail is in the coffin with the merger of Office Depot and Staples. What’s the rationale for continuing to have three store brands under one company umbrella? Answer: No reason at all … which is why the weakest of the three brands is now becoming history.
Olympic Garden – In a development that some might characterize as divine retribution, the Las Vegas “adult” establishment colloquially known as “The OG” couldn’t handle its myriad legal battles even as it continued to attract big crowds.
RadioShack – OK, we still see RadioShack outlets in certain locations around the country – typically in small- to medium-sized markets. But they’re co-branded locations with Sprint. The reality is that this nearly 100-year-old brand is fading away; the only question is whether we’ll cease seeing the name in five years or just one or two.
Sears – Another iconic brand name has been struggling mightily in the past decade or so, despite its merger with Kmart. The company has lost more than $1 billion in each of the past three years. Now it appears that the Sears name is the one that will disappear as its store locations continue to dwindle – nearly 250 in 2015 and close to another 100 this year. At that rate, there’ll be none left before long.
SimplyHired – An international job search engine with upwards of 30 million active users that once sparred with the likes of Monster.com, ultimately this HR resource was unable to successfully compete in the space, shutting down in mid-year.
Sports Authority – A cautionary tale of what happens to a big retailer when it fails to keep its operations and product offerings fresh and appealing. This retailer has been absorbed into Dick’s Sporting Goods, which has been far more nimble – and successful – in the “big box” sporting goods niche.
US Airways – We knew this had to be coming eventually; in 2013, this airlines’ merger with American Airlines was finalized. Now that its operating systems are fully consolidated, one of the brand names was bound to disappear – and it’s US Airways. Just like we all knew that Southwest Airlines would eventually consign the AirTran brand name to the dustbin, the same thing is happening with US Airways now.
Vine – In October, Twitter shut down this video-sharing app so it could refocus on its (also struggling) core business. Vine was definitely a flash-in-the-pan brand – barely a half-decade old.
So, now it’s time say a fond farewell to these brands. For a good many of them, the names may soon disappear, but they won’t be forgotten …
Do you have other 2016 brand casualties you’d add to the list? Please share your choices with other readers here.
… But first it needs to convince consumers that wearables are a “need-to-have” versus a “nice-to-have” product.
Between Fitbits, Apple Watches and other “wearables,” I suspect the holiday season this year will be full of gift-giving of these and other types of interactive gadgetry.
The question is – how many of these items will still be being used by the end of the next year?
According to a recent online survey of ~9,600 consumers in the United States, the United Kingdom and Australia conducted by market research firm Gartner, many of these wearable devices will be destined for the dresser drawer.
The abandonment rate for smartwatches is expected to be ~29%, while for fitness trackers, it’s forecast to be nearly the same at ~30%.
Part of the problem is that while most people typically purchase these products for themselves, more than one-third of fitness trackers and more than a quarter of smartwatches are given as gifts.
When gadgets like these are gifted, often it’s “easy-come, easy-go.”
The Fitbit company knows about these dynamics all-too well. According to an article earlier this month in The Wall Street Journal, the company is struggling to develop its next generation of products and to attract new users.
While that’s going on, for this holiday season, Fitbit’s sales are forecast to grow only in the 2% to 5% range, as compared to double-digit increases in prior quarters.
Essentially, what Fitbit and other brands need to do is to move consumers to start considering wearables as “need-to-have” rather than “nice to have” products — and to avoid the dreaded “fad” moniker (as in “for-a-day”).
This imperative helps explain Fitbit’s attempts to position its products as ones that measure long-term health conditions rather than being simply fitness trackers.
The notion is that physicians could start prescribing Fitbit devices to track patients’ vital signs in heart health, or physical therapists doing the same to help monitor their patients’ at-home exercise routines.
Fitbit is also working on developing trackers that can detect and diagnose long-term health conditions. To that end, what’s critical is to come up with defining functions that other gadgets can’t perform.
Otherwise, consumers are less likely to be interested — figuring that they can get the same kind of functionality out of other devices they already own.
In the meantime, look for wearables to be under the tree this holiday season … and then for many of them to be stuffed in a drawer someplace by next summer.
When it comes to attitudes about personal finances, millennials appear to have more in common with their Depression-era grandparents or great-grandparents than with anyone else.
Headlining the TDA results is this interesting finding: More than three-quarters of the millennials surveyed would place an extra $1,000 in a savings account rather than invest it in the stock market.
Concurrent with that conservative financial worldview, two-thirds of the respondents in the TDA survey consider themselves to be “savers.” Even more have established personal budgets for themselves and their families.
Helping to explain the similarities in characteristics between millennials and the Depression-era generation, Matthew Sadowsky, director of retirement and annuities at TD Ameritrade, put it this way:
“The Silent Generation and Millennials [both] came of age during a major financial crisis, which increases the propensity to save and financial conservativism. Further adding to Millennials’ financial anxiety is the economy, student debt, and escalating peer influence from social media.”
Social media could partially explain one finding in the Ameritrade field research – the notion that the vast majority of the survey respondents don’t feel financially secure now.
Being active on social media is much more likely to cause Millennials to compare themselves to others: Nearly two-thirds of Millennials admitted that fact (64%), whereas with Baby Boomers the percentage is less than half of that (29%).
Despite Millennials’ awareness of their financial limitations, it doesn’t seem to translate into seeking out the counsel of professional financial advisors. Instead, they’re more likely to rely on parents (38%) and/or friends (28%).
As for their financial goals, most Millennials have bought into the idea that home ownership is a good thing – and something most of them aspire to achieving by the age of 30.
They also appear to have pretty realistic attitudes about retirement, too, as about half are concerned about running out of money during retirement, and hence are open to retiring at an older age in order to maintain a decent lifestyle in retirement.
Does this mean that Millennials will be better-prepared to handle the challenges of living and growing old in our society? The TD Ameritrade survey suggests so. Still, life has a way of playing tricks on people, so the question remains as to whether this generation will actually do any better than the preceding ones.
The holiday season isn’t yet upon us, and already there are a plethora of prognostications being made as to how holiday sales will stack up compared to prior years.
These predictions come courtesy of numerous forecasters including the National Retail Foundation, Deloitte, Kantar Media, eMarketer, the International Council of Shopping Centers, Market Track and others.
So what’s in store? On balance, forecasters predict that holiday sales in the United States will post an increase of approximately 3.5%. That’s higher than the 10-year rolling average of 2.5% but down a tick from last year’s 3.7% increase.
Still, at more than $655 billion in total sales, holiday spending continues to be the biggest single driver of the U.S. consumer market.
Hardly surprising, e-commerce sales are expected to continue their double-digit growth over last year’s holiday season, with various predictions ranging from 14% to 17% growth in this sector. Not only are consumers attracted by the convenience of online shopping, many of them believe they can find products at the cheapest price via online sources rather than taking a trip to the shopping mall.
Another factor that drives at least some people to shop on their online devices is their aversion to the crush of holiday shopping at the stores. A McKinsey study has found that nearly one-third of U.S. consumers basically hate Black Friday (the day after Thanksgiving), and make it a point to stay as far away from it as possible.
But there’s one drawback for businesses about online holiday shopper dynamics, however: Those consumers tend to be less brand loyal than is typical. RJ Metrics calculates that the typical e-commerce business acquires nearly 25% of its new customers during just the months of November and December. Tempering that healthy statistic is the lifetime value of those consumers, which RJ Metric has determined is about 13% lower than the lifetime value of customers acquired at other times of the year.
You might be wondering what amount of money the typical U.S. consumer will spend on his or her holiday shopping this year. Wait for it: The 2015 per capita amount is expected to be $935.
That figure may seem quite rich … but it’s actually a little bit lower than 2015’s average spend-per-person, which at $953 happens to have been the all-time high ever recorded.
Does the new $935 forecast signify a reversal of a trend … or is it just a pause in an otherwise ever-increasing amount of money that consumers are willing to plunk down as part of their celebration of the holiday season?
Check back in about a year and we should have an answer.
Regular readers of the Nones Notes blog will know that my brother, Nelson Nones, sometimes contributes his thoughts and perspectives for the benefit of other readers. As someone who has lived and worked outside the United States for the past two decades, Nelson’s perspectives on domestic and international events and megatrends are always insightful — and often different from prevailing local opinions.
That has certainly been the case during 2016. In a year of four major election surprises, my brother correctly predicted the results at the ballot box in every single case. Below is a guest post written by Nelson in which he explains how he arrived at predictions that were so much at odds with the prevailing views and conventional wisdom.
Oh, and by the way … I was one of the “confidantes” Nelson refers to in his post, so I can personally vouch for the fact that his “fearless predictions” were made before the events happened — even if they were delivered to a skeptical (and at times incredulous!) audience.
_______________________________________
A TALE OF FOUR PREDICTIONS
By Nelson M. Nones, CPIM
Bangkok, Thailand — 13th November 2016
Rodrigo Duterte and Donald Trump
A handful of my confidantes across the world can vouch that I correctly predicted four momentous events during the past fifteen months: that Donald Trump would be the US Republican nominee, United Kingdom (UK) citizens would vote to leave the European Union (EU), Rodrigo Duterte would be elected President of the Philippines and Trump would win the US Presidency.
To my knowledge, no one else correctly predicted all four events.
Skeptics might dismiss my predictions as reckless, and credit my successes to dumb luck, but my confidantes can also attest that these predictions were the products of diligent analyses which I freely shared alongside the predictions themselves. What did I do to gain insights into the future that most others did not see?
Independent, Globally-Connected Thinking
Although I’m American, I have lived and worked in Thailand since 2004, and elsewhere in Asia and Europe for 16 years of the past two decades. During that time I’ve had the good fortune to visit or reside in over 40 countries on five continents, and form long-lasting professional relationships with knowledgeable people all over the world.
Not only has this experience given me a truly global perspective, it also filters out most of the distractions that partisans everywhere deliberately craft to alter what people think. Happily, for instance, I almost never encounter the barrage of negative attack advertising which fills every US election cycle. Avoiding so much propaganda, instead of continually having to confront and fend it off, has given me freedom and time to nurture and hold a much more independent and finely balanced point of view than I could ever have acquired by sitting in a single locale.
By now, the repudiation of globalization and free trade, and the rise of nationalist, populist fervor are universally recognized as key reasons why these four events unfolded as they did. Most people have come to realize or accept this only in hindsight, but my global perspective made the eventual gathering of these forces obvious years ago.
In 1999, while living in London, I published the article “Deflation’s Impact on Business Information System Requirements” in which I anticipated that deflation would force manufacturers to reduce their variable labor costs and warned, “These actions will have adverse and increasing social effects. Worker demands for improved economic security may lead to renewal of isolationist policies in some locales, which would effectively reverse the economic liberalization and globalization trends of recent years. Business models designed to optimize performance in the previous climate of unrestricted free trade will be adjusted to account for the artificial incentives and penalties created by new government regulations.” My inspiration was a special section of The Economist, “Could it happen again?” published on February 18th, 1999 which declared, “It is conceivable that the world may be in for a new period of global deflation (meaning falling consumer prices) for the first time since the 1930s” and concluded, “The world economy is, in short, precariously balanced on the edge of a deflationary precipice … history has shown that once deflation takes hold, it can be far more damaging than inflation.”
At that time, global inflation had fallen to 3.6% per year, from a peak of 14.8% in 1980. By 2014, global inflation had fallen further to 1.7%, and the best-fitting linear trend over the previous 44 years suggested to me that prices could stop rising altogether by 2018 globally, after which a period of negative inflation (“deflation”) might ensue, with prices falling perhaps by 0.4% in 2020. From this I concluded that the rise of isolationism, and the concomitant demise of globalization, economic liberalization and free trade, were near at hand.
First Hand Observation
It is one thing to sit in a chair, reading and writing about such things, and quite another to see the evidence up close and in person.
Nigel Farage
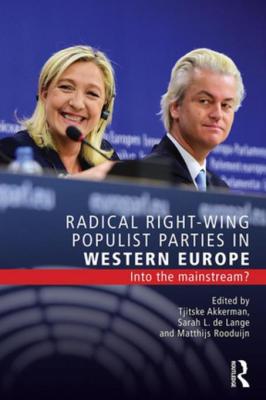
I spent four months of 2013 working in the UK, which gave me plenty of opportunity to watch local television news. One person who seemed to make headlines every day was the controversial politician Nigel Farage, then a Member of the European Parliament and Leader of the UK Independence Party (UKIP) who would spearhead the campaign to leave the EU nearly three years later. Earlier in 2013, he had led UKIP, a Eurosceptic and right-wing populist party, to its best performance ever in a UK election. Key planks in its platform at that time sound eerily familiar now and included deporting migrants, legalizing handguns, destroying wind farms (which many climate change deniers like to condemn as wasteful and unattractive), privatizing the National Health Service (NHS) and improving relations with Vladimir Putin. Just like Trump would do in 2016, UKIP ran strongest among less-educated voters in predominantly white, blue-collar areas, while faring much worse in areas dominated by college graduates, immigrants and minorities.
The following year I had the opportunity to travel by train from Paris to London. It was the first time I’d passed through the Channel Tunnel, that most emblematic symbol of free trade and European economic integration. But as the train approached the tunnel’s French portal, I was struck by the tight security and double fencing meant to prevent migrants from climbing or jumping onto trains bound for the UK. These were impressively similar to the border fencing and controls separating El Paso, TX from Ciudad Juárez, Mexico which my family and I visited in early January, 2015.
Later, I spent July and August 2015 in the Pacific Northwest. Trump was all over the news, both before and after his infamous Republican primary debate on August 6th. I instantly noticed the many similarities between Trump’s rhetoric and what I’d heard from Nigel Farage two years before. Just like Farage, Trump appeared to be running a campaign requiring no television advertising whatsoever. By provoking so much controversy, he seemed to receive thirty minutes’ free television interview time for every thirty seconds any other candidate got.
Based on these observations, on August 19th, 2015, I wrote a confidante, “Last week, at lunch, I made a prediction to our project team in Washington state: Trump will win the Republican nomination, and he will probably win the Presidency too (or at least come very close to winning it).” I added, “Right now, he is looking like a steamroller, and all the other candidates (Hillary [Clinton] included), are looking like ants who can’t run fast enough to get out of the way.”
Fast-forward to October, 2016, when I next visited the U.S. and drove all the way from New York to Minnesota through Pennsylvania, Ohio, Indiana, Illinois and Wisconsin. These states, with the exception of New York and Illinois, form the majority of the “blue wall” which Trump successfully breached on Election Day, losing only Minnesota by a tiny margin. I noticed, particularly outside the big cities of New York, Cleveland, Chicago, Saint Paul and Minneapolis, that Trump’s lawn signs and bumper stickers seemed to outnumber Clinton’s by something like four to one. I even spotted a few homemade Trump signs or marquees, but not a single one for Clinton.
My arrival in the U.S. coincided with the Washington Post release of the video containing Trump’s lewd comments about women. Yet while I was driving across America, even as new accusers came forward with fresh allegations of sexual assault and Trump’s prospects, according to media pronouncements, sagged precipitously toward new lows, the lopsided proportion of Trump lawn signs and bumper stickers appeared to stay firmly planted in place.
Hypothesis Framing
As early as August, 2015, long before the Republican primaries got underway, I began to formulate a hypothesis to explain why Trump could possibly win the nomination as well as the US Presidency. At the time, Trump led the Republican polls and there was talk that he would hit a 25 or 30 percent “ceiling” of support which, if true, would put the Republican nomination out of his reach.
I decided to test this notion using Lee Drutman’s analysis of an American National Election Studies (ANES) 2012 Time Series data set (Lee Drutman, “What Donald Trump gets about the electorate,” Vox, August 18th, 2015). Drutman’s thesis was that Trump, as well as Bernie Sanders, were playing to a sizeable number of voters representing up to 40 percent of the total electorate. In very broad terms, according to Drutman, the electorate breaks down like this:
40 percent are “Populists” – of which 55 percent are strongly Republican, lean Republican or are independent; attracted to Trump and Sanders.
33 percent are “Liberals” – of which 80 percent are strongly Democratic, lean Democratic or are independent, thus forming the core of Clinton’s support (and presumably would vote for Sanders as well).
21 percent are “Moderates” – evenly divided between Democratic, independent and Republican, thus more likely than not to vote for Clinton on the Democratic side or a mainstream Republican like Jeb Bush on the Republican side.
4 percent are “Business Republicans” – attracted to mainstream Republicans.
2 percent are “Political Conservatives” – attracted to other Republicans in the field.
Considering this, I reckoned that Trump, being the only populist candidate in the Republican field, could potentially attract all the Republican as well as independent “Populists” and thereby conceivably garner up to 58 percent of the Republican primary vote, far exceeding any 25 or 30 percent “ceiling” and more than enough to win nomination.
Thereafter, assuming Clinton won the Democratic nomination, I reasoned that in the general election Trump, as the only “Populist” standing for the Presidency and also the Republican nominee, could potentially attract all the “Populists,” Republican “Moderates,” “Business Republicans” and “Political Conservatives,” thereby taking about an eighth of Clinton’s natural support away from her and giving him up to 52 percent of the popular vote.
My reasoning was simplistic, but good enough to frame my working hypothesis: Trump wins the nomination, and the US Presidency, by running as a populist under the Republican brand.
Later on, right before the Brexit referendum, another of my confidantes, who is British, mentioned rumors that published polls were understating the true extent of support for leaving the EU because likely voters, who actually intended to vote for leaving, were reluctant to admit this fact to the pollsters. Indeed, the final compilation of polls released by The Economist on the eve of the referendum revealed 45 percent each for leaving and remaining, and 10 percent undecided, yet 52 percent actually voted to leave. This meant that seven out of every ten supposedly undecided voters ultimately chose to leave. It’s not improbable that many of them truly intended to do so all along. But if this were true, polling data alone could not be relied upon to predict the outcome.
This insight led me to frame a supplementary hypothesis just before the US general election. In consequence of Trump’s many campaign missteps and personal indiscretions, a “closet” vote exists comprising likely voters who fully intend to vote for Trump in the privacy of a ballot booth, but are too ashamed to admit it to a pollster (or anyone else, for that matter).
Data Gathering
As much as I prefer gathering and analyzing my own data, instead of relying on secondary sources, this option was out of the question. I would have to rely on whatever public polls were available.
Fortunately even in Thailand, using high-speed Internet it is possible to instantly retrieve and compile data from thousands of public polls. But not all public polls are alike. Some have better track records than others. Some rely on questionable methodologies or don’t disclose their methodologies at all. While some are issued by reputable and supposedly impartial polling organizations, others come from partisan outfits. Last, and most importantly, some are less timely than others. A poll’s usefulness for predicting the winner decays rapidly with the passage of time.
Nonetheless, when doing empirical analyses, data of any kind or quality is always better than no data at all, so I employ a simple set of rules to separate the wheat from the chaff.
First, in countries such as the UK and Philippines, I analyze only national polls because national elections are decided by popular vote across the whole country. But for US data, considering how the Republican nomination process and the US Electoral College are designed to work, I completely disregard national US polls, and analyze only polls taken at the state and territorial levels. Unless no other polling data is available, I also disregard any poll taken over a period exceeding one week, or which is not documented to have been designed and taken according to standard opinion polling practices, or for which the polling dates, sample size, margin of error and confidence level are not disclosed.
Second, because polls are merely snapshots of an electorate at specific moments in time, for any given election I only use the most recent poll, after combining all the polls taken on the same day by weighting their frequencies according to sample size. To determine when a poll was taken, I use the last date it was conducted in the field and not the date it was released.
The US general election, and other national elections, are held on the same day so I prefer to wait until a few days before each election before gathering any data. However the US Republican nominating process is a sequence of 56 separate statewide or territorial elections, caucuses or conventions held over a period lasting just over four months. It is therefore necessary to refresh the analysis nearly every week, as late as possible before the next scheduled events, using previously-bound delegate counts together with the latest polling data.
Model Building
To turn poll results into election predictions, you need models. A model is simply an algorithm for converting the frequency distribution of the latest poll into a projection which takes all working hypotheses and applicable decision rules into consideration.
Modeling a national election decided by popular vote is quite straightforward. The poll’s reported frequency distribution is adjusted, if required, according to the working hypotheses. The candidate or proposition preferred by the greatest adjusted number (or percentage) of respondents is deemed the winner.
For example, the final compilation of polls available on the eve of the Brexit referendum reported that the percentage of respondents who preferred to leave the EU was exactly the same as the percentage of respondents who preferred to remain. A smaller percentage of respondents was undecided. According to the working hypothesis, the number of respondents who claim to be undecided but actually prefer to leave exceeds the number of respondents who claim to be undecided but actually prefer to remain. Because any possible adjustment conforming to the working hypothesis would break the tie in favor of respondents who preferred to leave, I predicted that the UK would choose to leave the EU.
Modeling Republican primary contests is much more complicated. Each state or territory sends its prescribed number of delegates to the national nominating convention. Most of those delegates are bound to vote for a specific candidate, at least during the initial balloting round, but the rules for binding those delegates vary widely based on proportional, winner-takes-all and other voting systems.
32 of the 56 states and territories bind their delegates proportionally according to each candidate’s share of the vote in a primary election, convention or local caucuses. Candidates may also need to exceed a minimum threshold before earning any delegates. The outcome is decided exclusively at the state or territorial level in some of these states and territories, while in the others outcomes are decided separately for each congressional district and, for some, at the state level also to bind their at-large delegates.
To illustrate, New York has 95 delegates comprising three delegates from each of its 27 congressional districts, plus 14 at-large delegates. It holds an April primary election to bind the delegates from each of its congressional districts proportionally, and uses the statewide popular vote to proportionally bind the at-large delegates. At both the congressional district and state levels, candidates must receive at least 20 percent of the popular vote and, at both levels also, a candidate who receives more than 50 percent of the popular vote wins all delegates. Finally, if at least two candidates receive 20 percent or more of the vote, the candidate with the most votes receives two delegates and the candidate with the second most votes receives one.
18 other states and territories use the winner-takes-all system which binds all delegates to the single candidate who received the largest number of popular votes in a primary election or local caucuses. Just as for states and territories using the proportional voting system, outcomes are decided either at the state or territorial level, by congressional district or at both levels.
California, for instance, has 172 delegates comprising three delegates from each of its 52 congressional districts, plus 13 at-large delegates. It holds a June primary election to bind the delegates from each of its congressional districts on a winner-takes-all basis, and uses the statewide popular vote to bind the at-large delegates, again on a winner-takes-all basis. Florida, on the other hand, holds a March primary election to bind all of its 99 delegates on statewide winner-takes-all basis.
West Virginia Republicans, uniquely, hold a primary election in which its 34 delegates are elected directly. Only the delegates’ names appear on the ballot.
Lastly, 5 states and territories don’t bind their delegates at all, nor do they hold primary elections. Instead they select their delegates at local caucuses or state nominating conventions.
Given the voting system differences and wide disparities between the rules, my basic approach is to model each state or territory separately. This allows me to take as many local variations into account as possible. Inevitably, though, compromises must be struck to deal with missing data and other uncertainties.
Although polling data is available for most states and territories, very little is available for individual congressional districts. In 2016, data were published only for congressional districts in New York and California. Accordingly, I modeled New York and California at both the state and congressional district levels, but elsewhere only at the state or territorial level which effectively employs statewide or territorial poll results as proxies for congressional districts.
Finally, for West Virginia as well as other states and territories whose delegates are unbound, I could only use statewide or territorial poll results as proxies to predict the outcomes of their primary elections, conventions or local caucuses.
To arrive at predictions for the Republican nomination, I saw no need to apply any supplemental working hypotheses. Instead, I used the unadjusted frequency distributions reported for the polls most recently taken in each state or territory, and then applied the relevant state or territorial model to project the number of delegates bound to each candidate in each state or territory. I summed these projections by candidate, and then added the actual number of delegates already bound to each candidate, to arrive at the national projection. The candidate projected to enter the national convention with at least 1,237 bound delegates (half the total of national convention delegates plus one) was deemed the eventual winner.
Incidentally, if no candidate was projected to enter the convention with at least 1,237 bound delegates, I made no attempt to model or project the eventual winner. In other words, I didn’t try to predict who would win the nomination on the second or subsequent rounds of balloting.
As mentioned earlier, I refreshed these projections nearly every week during the Republican primary season to reflect the actual outcomes of previous primary elections, conventions and local caucuses, and to incorporate the most recent polling data available.
Turning finally to modeling the US general election, under the Electoral College system each state, along with the District of Columbia, has a prescribed number of electors. All but two states use a winner-takes-all system which binds those electors to the single candidate who received the greatest number of popular votes. The exceptions are Maine and Nebraska, where each congressional district has one elector who is bound to the candidate receiving the greatest number of popular votes in that district. The remaining two electors from each of those states are bound to the candidate receiving the largest number of votes statewide, on a winner-takes-all basis. However, due again to the lack of polling data for individual congressional district in these states, I modeled Maine and Nebraska only at the state level, thus effectively employing statewide poll results as proxies for congressional districts.
To predict the outcome of the US general election, I applied alternate versions of the supplemental working hypothesis described earlier to the unadjusted frequency distributions reported for the polls most recently taken in each state.
The first alternate relied strictly on the actual outcome of the Brexit referendum. There, seven out of every ten presumably undecided voters ultimately chose to leave. So, I adjusted each state’s frequency distribution by allocating 70 percent of the undecided percentage to Trump, and the remainder to Clinton.
The second alternate moderates the actual Brexit referendum outcome as suggested by one of my confidantes. It assumes that half the undecided voters do not vote, and 70 percent of those who do vote for Trump. I adjusted each state’s frequency distribution by allocating 35 percent of the undecided percentage to Trump (that is, half the number of presumably undecided Brexit referendum voters who ultimately chose to leave), and 15 percent (remainder of those who presumably voted) to Clinton.
I then applied the statewide winner-takes-all model to project the number of electors bound to each candidate from each state. I summed these projections by candidate to arrive at the national projection. The candidate projected to win at least 270 bound electors (half the total of Electoral College votes plus one) was deemed the winner.
Rigorous Application of Data to the Models
All the races I predicted were hotly contested. Above and beyond civilized advertising, policy briefings, campaign rallies, speeches and debates, partisans of every stripe blasted falsehoods, negative attacks, dirty tricks, leaks, and endless spin through every available mass media and social media channel in their attempts to reinforce or change what voters were thinking.
Underlying this noise were the inevitable disruptions arising from transformational change. Although Switzerland’s Parliament voted, in March 2016, to retract its application to join the EU, and both Greenland and Algeria chose to leave the EU’s predecessors long ago, until the Brexit referendum no EU member state had ever exercised its right to withdraw under the current Treaty on European Union (TEU) Article 50. The withdrawal of the UK, which is the EU’s second-largest economy, is a transformational change for Europe which, according to many commentators, is likely to create serious repercussions and might be an existential threat to the EU itself.
The rise of populism, and “renewal of isolationist policies in some locales, which would effectively reverse the economic liberalization and globalization trends of recent years” as I warned back in 1999, are symptoms of even broader transformational change that in the worst case harkens back to the dark days preceding World War II. Donald Trump, Nigel Farage and Rodrigo Duterte are by no means the only populists ascending to the worldwide political stage today. Others include Norbert Hofer (Austria), Marine Le Pen (France), André Poggenburg (Germany), Pawel Kukiz (Poland), Marian Kotleba (Slovakia), Recep Tayyip Erdoğan (Turkey) and Nicolás Maduro as well as his predecessor Hugo Chávez (Venezuela). Narendra Modi became India’s Prime Minister on a populist platform, although he recently stated that he is avoiding a “populist course.” In Thailand, the populist politician Thaksin Shinawatra rose to power democratically, and so did his sister, Yingluck, after Thaksin was deposed in a 2006 military coup. And Italy’s conservative populist Silvio Berlusconi first took power in 1994, though he is no longer Prime Minister.
Increasingly, these developments are rendering conventional political wisdom obsolete. The old-school ways, which rely upon centrist voters to nominate and elect mainstream candidates who lean either left or right, are becoming increasingly irrelevant. The advice of pols who cut their political teeth before the mid-nineties can no longer be counted upon to reliably predict the future.
Which is to say, to predict elections correctly in this day and age, it’s vital to filter out as much partisan noise and conventional wisdom as possible, and trust both the data and the models to speak for themselves. For me, time and time again, this meant resisting the temptation to fiddle with my projections based on what television, the Internet and even my confidantes were saying.
As mentioned earlier, during the Republican primary season I refreshed my projections nearly every week to reflect the actual outcomes as they occurred, remove candidates as they dropped out of the race, and incorporate the most recent polling data available. I began my first analysis on March 3rd, 2016, just after the “Super Tuesday” primaries, and it projected Trump would come up 87 delegates short. After that, every one of my subsequent analyses indicated Trump would win, except the one I published on March 25th, 2016, just after the Utah caucuses and the Arizona primary, when I projected he would fall 9 delegates short. My final analysis, on April 29th, 2016, projected Trump would enter the convention with 86 more delegates than he needed. The following Tuesday, Trump performed significantly better than my final projection, sweeping all of Indiana’s 57 delegates, and his main opponent Ted Cruz dropped out. It was game over.
The Philippine Presidential election was scheduled to take place the next week, on Monday, May 9th, 2016. I didn’t pay much attention until I spotted news reports labeling Duterte the “Trump of the East.”
Duterte had led every one of the 19 polls taken after March 25th, 2016, except three. Grace Poe, an independent businessperson, consistently placed second but never within the statistical margin of error. Curiously, another candidate, Mar Roxas, was tied with Poe in the first and led the second two of the three polls putting Duterte second or third. The last of those polls, which showed Roxas surging to a five-point lead, was also the final poll to be conducted before the election. Its immediate predecessor, conducted two days earlier by a highly-regarded polling organization, had shown Duterte leading Poe by 11 and Roxas by 13 points.
Shifts of that magnitude over such a short period of time always look suspicious to me. I started digging. It didn’t take long to discover that the organization which released the three polls showing Duterte second or third had never published any other polls, and the first of those three polls had been conducted merely three weeks before the election. I also learned that Roxas and his Liberal party were favored by outgoing Philippines President, Benigno Aquino III, himself a Liberal.
This was all the evidence I needed to disregard the final Philippines poll, and substitute its immediate predecessor. Seeing no need to apply any supplemental working hypotheses, I projected Duterte to win by 11 points. He actually won by 15.6 points over Roxas, and 17.6 points over Poe.
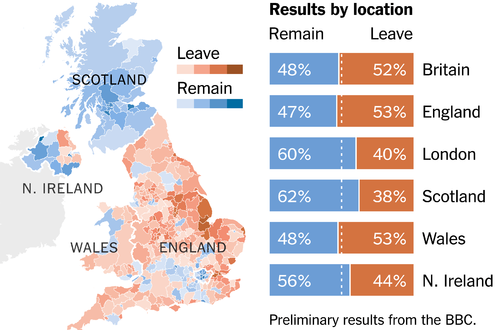
Next up was the Brexit referendum scheduled for June 23rd, 2016. I hadn’t initially planned to predict the outcome, but a lengthy conversation with my British confidante motivated me to give it a try. Using the working hypotheses, data and models I’ve already described, it took almost no time to predict that UK voters would choose to leave the EU. I shared my prediction with two confidantes in Singapore and sat back to watch the result, which ended up looking like this:
I began to analyze the US general election only on Sunday, November 6th, 2016. To save time, I quickly narrowed the scope of my analysis to 18 battleground states. These were Arizona, Colorado, Florida, Georgia, Iowa, Maine, Michigan, Minnesota, Missouri, Nevada, New Hampshire, New Mexico, North Carolina, Ohio, Pennsylvania, Utah, Virginia and Wisconsin. Victory appeared all but assured for Trump or Clinton in the remaining 32 states, as well as the District of Columbia, so I allocated their electoral votes as all key media outlets were unanimously projecting.
The latest available polls covering 13 of the 18 battleground states were conducted on November 6th, 2016, so most of the data was very recent. Altogether, I relied upon 31 polls from 16 different polling organizations. Notably, the oldest poll was conducted on October 25th, 2016, covering Minnesota. It showed Clinton with a 10 point lead. As it turned out, Clinton won Minnesota by only 1.4 points.
The latest polls, before any adjustments, pointed to a Clinton victory with 277 electoral votes versus 261 for Trump.
After adjusting the poll frequencies according to both the first and second alternate supplemental working hypotheses, the Electoral College model projected Trump the winner. So, I published my final prediction that Trump would win the US Presidency with 276 electoral votes versus 262 for Clinton.
U.S. Presidential Election Prediction by Nelson Nones
As at this writing, Michigan’s unofficial results show that Trump finished ahead of Clinton by just 13,107 votes in Michigan (0.3 points) but major news organizations, including the Associated Press (AP), have not yet called the race. If Trump’s current lead holds in Michigan, he will receive 306 electoral votes and Clinton will receive 232. Otherwise Trump will receive 290 electoral votes and Clinton will receive 248.
It’s perhaps premature to judge my forecast accuracy because Michigan still hasn’t been called. But if Michigan holds for Trump, my performance looks like this:
On a geographic basis, I have correctly predicted 50 of 55 (91 percent). The total includes 50 states, plus the District of Columbia, plus the four congressional districts in Maine and Nebraska.
On an electoral vote basis using either of the supplemental working hypotheses, I have correctly predicted 478 of 538 (89 percent).
In terms of the actual outcome, my prediction was 100 percent accurate.
I’ve also compared the latest polls as well as my projected winning margins against the actuals reported so far. The average statistical margin of error among the 31 polls within the scope of my final US general election analysis was 3.3 percent. So far, their average actual error is 4.2 percent with a 2 percent standard deviation, and the actual polling error exceeded the statistical margin of error in half the states I analyzed. Meanwhile, for either of the supplemental working hypotheses, the average actual error for my projected winning margins is 3.0 percent with a 0.5 percent standard deviation.
These performance measures tell me that none of my working hypotheses are likely to be disproven by the actual outcomes. Indeed, had I not framed them, and relied solely upon the latest available polls instead, I doubt that I would have correctly predicted any of these events except the Philippines Presidential election.
Conclusion
My method boiled down to framing hypotheses, adjusting the latest available polls according to my working hypotheses, if any, and running the adjusted data through deterministic models of voting systems and rules to project the winners. Along the way, especially during the Republican primary season, I discovered and corrected numerous errors of my own making. I am indebted to my confidantes for their information and critiques, and also for pointing out important details such as specific delegate allocation rules I’d overlooked. As such, my endeavors were error-prone at times and remained a constant work in process throughout.
In truth, along the way I judged my approach to be quite primitive. I didn’t (and couldn’t, from halfway round the world) consider the myriad soft factors or nuances that other prominent forecasters, with seemingly vast resources at their disposal, appeared to be incorporating into probabilistic models which seem far more elegant than mine.
But in the end, it’s the degree of objectivity combined with diligent work that really counts. And I can truthfully say that I did my best to leave my personal preferences outside the door, trust my cumulative experience and first-hand observations, incorporate my previous research, maintain a balanced point of view, and ultimately let the data points themselves guide me to my conclusions.
It’s a common complaint of people in business: E-mail is this great big blob that consumes way too much of their day.
And now we know just how much. According to a recent report published by Adobe — “E-Mail Survey 2016,” — white collar adults around the world are spending ~17% more time on e-mail activities today compared to last year. And on the business side, the growth is even bigger.
According to the findings of this research, which included surveys of ~1,000 American and ~3,000 European white collar workers, the time spent on work e-mails on a typical day is ~4 hours, while personal e-mail communications account for an additional ~3.3 hours.
This combined total of nearly 7.5 hours means that nearly one third of the typical day is spent working with e-mail communication.
Those findings suggest that other than sleeping, people spend more time on e-mail than on any other type of activity. How frightening is that?
[Findings among Europeans are much different, either, as this infographic illustrates.]
Contributing to the “always on” atmosphere, is the fact that smartphones have definitely become the “go-to” device for e-mail activities. Nearly 85% of the survey respondents reported that they check e-mail regularly on their smartphone, compared to around 70% who check their desktop or laptop regularly for e-mail.
In the workplace, the two devices are used approximately equally for e-mail activities, but on the personal side, smartphones have it all over other desktops and laptops. Nearly two-thirds report that they use their smartphones regularly for e-mail, compared to fewer than 30% who use other devices.
The other attribute that e-mail affects is the speed at which e-mails engage their recipients. The nature of e-mail is that it is “intrusive” and engenders a sense of time-sensitivity. For work e-mails that require a response, here’s how quickly those responses happen:
Within a few minutes: ~14%
Within 1 hour: ~29%
1 to 2 hours: ~24%
Within half a day: ~16%
Within 1 day: ~10%
1 to 2 days: ~5%
Longer than 2 days: ~2%
This means that two-thirds of work-related e-mails elicit a response from the recipient in two hours or sooner. But believe it or not, that’s not good enough; nearly three-fourths of the respondents expect to receive a response to their e-mail within that time period.
What this research proves is that although many people like to complain about e-mail communications taking over their lives, it’s actually become an integral part of daily life, to the degree that those same people are now conditioned to expect e-mail engagement in real-time.
In short, “always on” e-mail is now the norm. And if you don’t like that very much, there’s basically nothing you can do about it.
For more information on the results of the Adobe research, click here.
If you’re like many people, you may have begun to notice some telling changes in the “atmospherics” you encounter in your visits to the doctor’s office.
Perhaps the signs are just subtle, but things seem to be a little more stressed in the office – and a little less comforting for patients.
With the big changes happening in how healthcare services are delivered and how care providers are compensated, perhaps those changes are to be expected.
But a new survey of more than 500 physicians by InCrowd, a Boston-based market intelligence company focusing on the healthcare, pharmaceutical and life sciences fields, points to some unwelcome “collateral damage” that has to be concerning to everyone.
According to the InCrowd research results, three-fourths of the physicians surveyed do not feel that their healthcare facility or practice is doing enough to address the issue of physician burnout.
For the purposes of the research, burnout was defined as “decreased enthusiasm for work, depersonalization, emotional exhaustion, and a low sense of personal accomplishment.”
If three-quarters of the physicians think that too little attention is being paid to burnout issues, that may be one explanation for the changes in the “dynamics” many patients sense when they pay a visit to their doctor.
This doesn’t mean that the majority of physicians feel that they themselves have experienced burnout. But in two particular physician categories – emergency care and primary care – nearly 60% of the physicians surveyed reported that they had personally experienced burnout.
And most of the remaining respondents know other physicians who have experienced the same.
While burnout may be a more extreme condition, for many physicians the average day presents any number of challenges and frustrations. Nearly four in ten respondents reported that they “feel frustrated” by their work at least a few times weekly — or even every day.
The two biggest contributors to this frustration? Time pressures, and working with electronic medical records.
Perhaps the most startling finding from the InCrowd survey is that ~58% of the physician respondents say that they’re either unsure or wouldn’t recommend a career in medicine to a family member or child.
To me, that finding says volumes. When a profession goes from being the object of aspiration to something to be avoided … we really do have a problem.
What’s been your experience at your doctor’s office on recent visits? Do you sense a degree of tension or stress that’s more than before? Please share your thoughts with other readers.

 In the wake of recent election campaigns and referenda in places like the United States, the United Kingdom, France, Austria and the Philippines, it seems that everyone’s talking about “fake news” these days.