Today, it’s more than just the “usual suspect” keywords that are landing e-mails in the junk folder.
Most of us are aware of the kinds of words that trip spam alarms and cause e-mails to be sent straight to the junk folder – or not to be delivered at all.
How about these for starters:
Cash
Congratulations
Discount
Free
Income
Make Money
Urgent
Viagra
$$ / $$$
But research done by MailJet, an international e-mail service provider, looked at more than 14 billion e-mail communiqués and found that a bunch of other keywords are setting off alarm bells nearly as often as terms like “Urgent” or “Viagra.”
… Especially when considering the business categories that are so active in e-mail communications — retail goods, pharmaceuticals, providers of personal services, and the like.
Some of the other terms MailJet has found to be nearly as “toxic” are these:
Dear Friend
FedEx
Increase Sales
Increase Traffic
Internet Marketing
Invoice
Lead Generation
Lose Weight
Marketing Solutions
Online Degree
Online Pharmacy
Order
PayPal
Search Engine Optimization
Sign Up
Trial Offer
Visa/Mastercard
Winning
… And there are more, of course – including various permutations of the words and phrases above.
The inevitable conclusion: It’s becoming more difficult all the time to use the most common phrases in “subject” lines and “from” lines that’ll land your e-mail in someone’s inbox successfully.
And getting into the inbox just the first step, of course. The next is motivating the recipient to actually open your e-mail and engage with it, which are additional hurdles in themselves.
What words or phrases have you found to be surprisingly problematic in getting your e-mails delivered to your customers’ inboxes? How have you dealt with it? Please share your experiences with other readers here.
It’s no secret that Google has been trying to diversify its revenue stream away from clickthrough advertising, which historically has accounted for the overwhelming majority of its income.
How else to explain Google’s shopping spree over the past decade, scooping up a veritable smorgasbord of industry players like these:
AdMob(mobile)
Adometry (attribution)
Channel Intelligence (product feeds)
DoubleClick(display)
Invite Media(programmatic creative and media buying)
Teracent (programmatic creative and media buying)
YouTube (video)
Wildfire (social)
So the next question is, “How much have these acquisitions and investments done to diversify Google’s sources of revenue?”
The answer: Hardly anything.
Consider this statistic: In 2011, nearly all of Google’s revenue came from online pay-per-click advertising, as reported by SEO firm WordStream.
Now let’s look at 2014 figures: WordStream reports that the percentage of Google revenues from pay-per-click advertising is actually higher than in 2011, at 97%.
So much for the “diversifying effects of diversity.”
Mesothelioma continues to attract a lot of ad dollars, but it’s no longer commanding $100 a pop as it once did. In fact, it’s no longer on the Top 10 most expensive keywords list.
That list looks like this now (in descending order of bid pricing, starting at over $50 per click and dropping to “only” around $45 for the #10 keyword):
Insurance
Loans
Mortgage
Attorney
Credit
Lawyer
Donate
Degree
Hosting
Claim
In developing the ranking, WordStream determined which keywords reside in the stratosphere by compiling data from its own large keyword dataset and the Google Keyword Tool (over a 90-day period) to determine the 10,000 most expensive keywords.
These were then organized into categories like “credit” and “insurance” by weighting the number of keywords in each category, estimating the monthly search volume as well as the average cost-per-click for each keyword.
Notice the preponderance of financial and legal terms – both of them key to sectors that attract and manage a ton of money.
The word degree is right up there, too, underscoring how important the educational complex has become to the ad business.
It must be pretty unappealing to be active in these industries and have to pony up such big dollars to participate in the pay-per-click advertising space. But how else do we think Google racks up annual advertising revenues that are north of $32 billion?
How does the market sort out which keywords are worthy of commanding $40 or $50 per click? Essentially, it boils down to this: Invariably, the most expensive niches paying for the most costly keywords are ones with very high lifetime customer value – where the customer pay-off is high.
Think about it: The amount of money an insurance company gets from an individual signing up for coverage makes the high cost-per-click rates – even at $50 a pop — worth it.
Business observers point to long-range trends that may make search engine marketing increasingly irrelevant as the growth of multichannel, multi-device marketing picks up steam.
But don’t hold your breath; Google will likely be earning billions off of pay-per-click advertising for years to come.
One of the predictions we’ve heard about the admittedly controversial Affordable Care Act is that acceptance of it will grow over time, as people become more familiar and comfortable with its provisions.
So far at least, we haven’t seen this happening in the public polling about the law.
And now we’re seeing similar dynamics playing out in the all-important physician community.
The survey was conducted in January 2015 by LocumTenens, a physician staffing firm and online job board.
The headline finding must be this: While ~44% of the survey respondents reported that they had been opposed to the Affordable Care Act legislation prior to its implementation, now ~58% are opposed to it after a year of working under the confines of the law.
R. Shane Jackson, president of LocumTenens, had this to say about the key finding:
“After a year in the trenches trying to help patients understand this legislation, physicians by and large feel the law hasn’t done a lot to help improve healthcare.”
More specifically, Jackson noted,
“Physicians feel the ACA has made serving patients and running their businesses much harder. A year after implantation – and years after the political debate started – doctors are still passionate about how this law should have been designed, and would still like to see changes made that will make it simpler for their staffs and patients to understand.”
Among the negatives physicians see with the current ACA law are these aspects:
Lower reimbursement rates to hospitals and physicians
Increased compliance burdens for physician practices
Higher patient debt due to high-deductible plans
Also faulted are the insurance companies for not doing more to inform newly insured patients about their premiums, deductibles and coverage limits.
It isn’t all poor marks for the ACA, however. Physicians in the LocumTenens survey do credit the legislation for a number of positive outcomes including:
Helping more people gain access to healthcare
Expanding coverage to more children and young adults
Eliminating coverage denials due to pre-existing health conditions
Placing more focus on preventive healthcare measures
Decreasing the costs of end-of-life care
So what is the “net-net” on all of this?
Two-thirds of the physician respondents want the ACA law repealed (and three-fourths think it will be, incidentally). But physicians want it replaced by something else that retains the positive aspects of the ACA while doing away with the negatives.
That’s the same message we’ve been hearing from politicians, too. So the bigger question is how to unscramble the ACA egg … and whether anything actually better can come out of the effort.
Would anyone care to weigh in with their thoughts and ideas in this never-ending debate?
But how many of us have really stopped to think about how the adoption of self-driving vehicles will change everyday life as we know it?
Consulting firm McKinsey & Co. has done so, and a recently released report predicts some pretty major changes – most of them very fine, indeed. Here’s a sampling:
The number of car crashes will plummet.
“Drivers” will become “riders,” with more time for working, leisure and interaction with others.
“Dead time” in commuting will decrease, and productivity will increase as a result.
The ubiquity of the multi-car household will change.
And it’s not just McKinsey that is looking at self-driving cars with such optimism.
Even the normally dour and scolding National Highway Traffic Safety Administration predicts that consumer adoption of self-driving vehicles will usher in “completely new possibilities for improving highway safety, increasing environmental benefits, expanding mobility, and creating new economic opportunities for jobs and investment.”
But self-driving cars won’t overtake conventional automobiles in one fell swoop. The McKinsey report outlines a timeline for adoption of self-driving features — and it’s pretty drawn-out.
Within the next three to five years, McKinsey anticipates that cars will self-handle highway cruising and traffic jams.
The more difficult challenges of driving in urban areas and dealing with variables like pedestrians, cyclists and so forth will be tackled over the coming 25 years.
Thus, the impact of “autonomous” technology will be limited until about 2020. McKinsey figures that the technology will experience growing pains in the years 2020-2035 as driverless cars go more mainstream.
During this period, there will be numerous issues that will need to be resolved, with clear hub-and-spoke implications:
The development of comprehensive rules regarding how self-driving cars are developed, tested, approved and licensed (on an international basis)
Changes in insurance practices – migrating from individual coverage to automaker policies that cover technical failures
The growth of remote diagnostics and over-the-air updates
The decline in importance of independent automotive repair shops
The reduced need for taxi drivers and long-haul carrier jobs
The McKinsey report takes us beyond the year 2040, too, which is the point when McKinsey predicts that autonomous cars will become the primary means of transport in the United States.
The implications of this are guesstimates more than anything else, but McKinsey speculates on the following long-term effects:
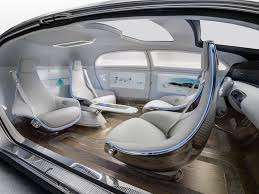
Mercedes-Benz “car of the future”: Seats facing every which-way.
Car designs will change dramatically – no more need for mirrors and pedals … and car seats will face any direction.
Space savings on streets, roadways and parking lots from more efficient vehicle use.
Fewer cars will be needed compared to today, with one autonomous car doing the job of two conventional vehicles in the typical household. The vehicles will be more expensive but fewer of them will be needed, for net savings for consumers.
As for the economic impact, the figures are difficult to quantify as some sectors of the economy will be up and others down. But with a projected 90% drop in car crashes, the savings in auto repair and healthcare bills alone are project to be around $180 billion.
If we accept the McKinsey report’s bottom-line findings, it seems the “brave new world” of self-driving cars can’t come soon enough. But what are your thoughts? Are there negative implications or “unintended consequences” that will be part of the revolution? Please share your perspectives here.
Most observers agree that 2015 will be a decent-or-better year for ad spending. But how will it break down by media segment?
Industry and market forecasting firm Strategy Analytics has just released its latest U.S. advertising spend forecast, which it expects to total almost $190 billion. That’s about a 3% increase over 2014.
But there are wide variations in the growth expectations depending on the media type.
Digital advertising leads the pack, with an expected growth increase in double digits, while at the other end of the scale, print advertising is forecast to drop by approximately 8%:
Digital advertising: 13.0% increase in 2015 U.S. ad spend
Outdoor advertising: +4.8%
Cinema advertising: +3.4%
Radio advertising: +1.8%
TV advertising: +1.7%
Print advertising: -7.9%
Of course, “digital advertising” is a broad category, and within it Strategy Analytics expects certain sub-categories to grow at a faster clip: Social media advertising looks to be the star in 2015 (+31%), followed by video advertising (+29%) and mobile advertising (+20%).
Even with these lucrative growth expectations, search advertising (SEM) will continue to represent the lion’s share of digital ad revenues – around 45%.
Also, despite the dramatic growth of digital, the segment isn’t expected to break 30% of all U.S. advertising in 2015. The more traditional TV ad segment continues to lead all others, although it has fallen below the 50% share of all advertising in recent years.
Here’s what Strategy Analytics is forecasting for ad expenditures by media segment for 2015:
TV advertising: ~$79 billion in 2015 U.S. ad spending
Digital advertising: ~$53 billion
Print advertising: ~$28 billion
Radio advertising: ~$18 billion
Outdoor advertising: ~$9 billion
Cinema advertising: ~$1 billion
Leika Kawasaki, a digital media analyst and one of the Strategy Analytics Advertising Forecast report’s co-authors, notes that looking ahead to 2018, TV’s share of advertising revenue is expected to fall further to ~40%, while digital advertising’s share will reach ~35%.
However, it’s not that TV’s volume will be declining — it’s more that digital will be robbing more funds from other segments (particularly radio and print).
Additional details on the 2015 forecast can be viewed here — if you wish to shell out $7,000 for the report, that is.
Mobile commerce is the latest big development in e-commerce. So it’s not surprising that nearly all companies engaged in e-commerce expect their mobile sales revenues to grow significantly over the next three to five years.
In fact, a new survey of ~250 such organizations conducted by IT services firm J. Gold Associates, Inc. finds that half of them anticipate their mobile revenue growth to be between 10% and 50% over the next three years.
Another 30% of the companies surveyed expect even bigger growth: between 50% and 100% over the period.
So … how could there be any sort of negative aspect to this news?
One word: Fraud.
Fraud in e-commerce is already with us, of course. For mobile purchases made now, a third of the organizations surveyed by Gold Associates reported that fraud losses account for about 5% of their total mobile-generated revenues.
For an unlucky 15% of respondents, fraud makes up around 10% of their mobile revenues.
And for an even more miserable 15%, the fraud losses are a whopping 25% of their total mobile revenues.
Risk management firm LexisNexis Risk Solutions has also been crunching the numbers on e-commerce fraud. It’s found that mobile fraud grew at a 70% rate between 2013 and 2014.
That’s a disproportionately high rate, as it turns out, because mobile commerce makes up ~21% of all fraudulent transactions tracked by LexisNexis, even though mobile makes up only ~14% of all e-commerce transactions.
The propensity for fraud to happen in mobile commerce is likely related to the dynamics of mobile communications. Unlike desktops, laptops and tablets, “throwaway” phone devices are a fact of life, as are the plethora of carriers — some of them distinctly less reputable than others.
Considering the growth trajectory of mobile e-commerce, doubtless there will be efforts to rein in the incidence of fraud – particularly via analyzing the composition and source of cellphone data.
Some of the data attributes that are and will continue to be the subject of real-time scrutiny include the following “red flags”:
> A phone number being assigned to non-contracted carrier instead of a contracted one means the propensity for fraud is higher.
> Mobile traffic derived from subprime offers could be a fraud breeding-ground.
> Multiple cellphones (five or more) associated with the same physical address can be a strong indicator of throwaway phones and fraudulent activity.
The question is whether this degree of monitoring will be sufficient to keep the incidence of mobile fraud from “exploding” – to use Gold Associates’ dramatic adjective.
I think the jury’s out on that one … but what do you think?
It’s no secret that companies large and small have been putting significant energy into social media marketing and networking in recent years.
It’s happened for a variety of reasons – not least as a defensive strategy to keep from losing out over competitors who might be quicker to adopt social media strategies and leverage them for their business.
And yet …
Now that the businesses have a good half-decade of social media marketing under their belt, it’s pretty safe to say that social tactics aren’t very meaningful sales drivers.
That’s not just me talking. It’s also Forrester Research, which as far back as 2011 and 2012 concluded this after analyzing the primary sales drivers for e-commerce. Forrester found that less than 1% was driven by social media.
And in subsequent years, it’s gotten no better.
A case in point: IBM Smarter Commerce, which tracks sales generated by 500 leading retail sites, has reported that Facebook, LinkedIn, YouTube and Twitter combined represent less than 0.5% of the sales generated on Black Friday in the United States.
Those dismal results aren’t to say that social media doesn’t have its benefits. Generating “buzz” and building social influence certainly have their place and value.
But considering what some businesses have put into social media in terms of their MarComm resources, a channel that contributes less than 1% of sales revenues seems like a pretty paltry result – and very likely a negative ROI, too.
Going forward, it would seem that more companies should pursue social media marketing less out of a fear of losing out to competitors, and more based on whether it proves itself as an effective marketing tactic for them.
Consider the points listed below. They’ve been true all along, but they’re becoming even more apparent with the passage of time:
1. Buying “likes” isn’t worth much beyond the most basic tactical “bragging rights” aspects, because “likes” have little intrinsic value and can’t be tied directly to an increased revenue stream.
2. A great social media presence doesn’t trump having good products and service; even dynamite social media can’t camouflage shortcomings of this kind for long.
3. Audiences tend to “discount” the value of content that comes directly from a company. This means publishing compelling content that clears that hurdle requires more skill and expertise than many companies have been willing to allocate to social media content creation.
Calibrating the way they look at social media is the first step companies can take to establish the correct balance between social media marketing activities and expected results. Instead of treating social media as the connection with customers, view it as a tool to connect with customers.
It’s really just a new link in the same chain of engagement that successful companies have forged with their customers for decades. In working with my clients, I’ve seen this scenario play out the same basic way time and again; it matters very little what type of business or markets they serve.
What about you? Have your social media experiences been similar to this — or different? I welcome hearing your perspectives.
Each year, the brand valuation consulting firm Brand Finance produces a report on the strength of the world’s Top 500 brands.
It’s an interesting study in that Brand Finance calculates the values of brands using the so-called “royalty relief” approach – calculating a royalty rate that would be charged for the use of the brand name if it weren’t already owned by the company.
In the 2015 report, just issued, Apple remains the world’s most valuable brand based on this criterion. The Top 10 listing of world brands is as follows:
#1 Apple
#2 Samsung
#3 Google
#4 Microsoft
#5 Verizon
#6 AT&T
#7 Amazon
#8 GE
#9 China Mobile
#10 Walmart
Of these, all but China Mobile were in the Top 10 listing in Brand Finance’s 2014 rankings. Of the others, all maintained their rank except for AT&T and Amazon, which rose, and GE and Walmart, which fell.
The most valuable brands differ by region, however. In fact, Apple is tops only in North America:
Most valuable brand in North America: Apple
… in Europe: BMW
… in Asia/Pacific: Samsung
… in the Middle East: Emirates Air
… in Africa: MTN (M-Cell)
… in South America: Banco Bradesco
As for which brand’s value is growing the fastest, top honors goes to … Twitter?
That is correct: According to Brand Finance, Twitter’s value has mushroomed from $1.5 billion in early 2014 to nearly $4.5 billion now.
Other social platform firms that have experienced big growth are Facebook (up nearly 150%) and the Chinese-based Baidu (up over 160%).
What about in non-tech or social media sectors? There, Chipotle racked up the biggest growth in brand value: nearly 125%. At the other end of the scale, the McDonald’s brand has lost about $4 billion in value over the past year.
Most Powerful Brands
In addition to its brand value analysis, Brand Finance also publishes a ranking of most powerful brands based on its “brand strength index” (BSI). This index focuses on factors more easily influenced by marketing and brand management activities — namely, marketing investment and brand equity/goodwill.
In this analysis, Brand Finance comes up with a very different set of “top brands” – led by Lego:
#1 Lego: BSI = 93.4
#2 PWC (PricewaterhouseCoopers): 91.8
#3 Red Bull: 91.1
#4 (tie) McKinsey: 90.1
#4 (tie) Unilever: 90.1
#6 (tie) Burberry: 89.7
#6 (tie) L’Oréal: 89.7
#6 (tie) Rolex: 89.7
#9 (tie) Coca-Cola: 89.6
#9 (tie) Ferrari: 89.6
#9 (tie) Nike: 89.6
#12 (tie) Walt Disney: 89.5
According to Brand Finance, Lego’s brand power stems from it being a “creative, hands-on toy that encourages creativity in kids and nostalgia in their parents, resulting in a strong cross-generational appeal.” Lego also has a big consumer marketing presence, thanks to its brand activities in film, TV and comics.
Last year’s top brand was Ferrari, which has now slipped in the rankings. Brand Finance cited the brand’s 1990s-era “sheen of glory” as wearing a bit thin 20 years on.
Do any of the results come as a surprise to you? Please share your observations with other readers as to why certain specific brands are coming on strong while others may be fading.
It was an idea that seemed pretty novel back in 2009 – and it was introduced with more than a little fanfare.
Panera Bread, the fast-casual bakery-café chain long known for its corporate citizenship, opened a series of stores in urban areas that touted a “pay what you can” pricing model.
The company’s charitable foundation opened these “Panera Cares” community cafés in five locations: metro St. Louis, Chicago, Detroit, Boston and Portland, OR.
It was the next logical step for a company that had already set up its Operation Dough-Nation initiative in the 1990s. Those activities included operating Community Breadbox cash collection boxes and donating unsold bread and baked goods to local hunger relief charities – to the tune of $100 million+ in retail value each year.
As for Panera Cares, the difference between these outlets and other Panera stores is that they operate only on suggested prices with donation boxes. Each outlet serves approximately 3,500 people weekly.
What’s been the experience of these locations?
Interestingly, Panera chose to open them in thriving urban zones rather than in inner city districts with borderline neighborhoods.
For example, the Lakeview (Chicago) location sits amongst million-dollar townhomes along with people on the street, meaning that there are customers who can help support the café as well as those who can benefit from having a free meal.
SAME Café, Denver, Colorado
The idea of Panera’s foundation was to deliver an experience that was profoundly different from a community soup kitchen or similar locations, which can have an institutional feel (as well as serving institutional-type food).
In this regard, the company’s chairman, Ron Shaich, got the idea from viewing an NBC News profile of SAME Café in Denver, CO, a restaurant founded in 2006 that also operates on a “pay what you can” model.
To make the concept work, consumers who have extra funds are asked to donate them … those who are short of funds can pay less … and those who can’t pay anything can volunteer for an hour and eat for no charge.
One way for the business model to work is operating the stores under the Panera Bread Foundation – a tax-exempt operation. That enables the business model to be successful even though these stores bring in only about 70% of a conventional Panera outlet’s typical revenue.
But Panera’s attempt to expand the concept beyond its five community cafés and into its regular stores wasn’t as successful.
In 2013, Panera pulled the plug on an experimental “pay what you want” turkey chili menu offering at around 50 St. Louis-area stores. Customers could pay the $5.89 “suggested” price … they could pay more … pay less … or pay nothing.
The company reported that after an initial burst of publicity and interest, customers stopped realizing the option existed — hence the program’s termination.
But there may be a bit more to it than that. Ayelet Gneezy, a marketing and behavioral sciences professor at the University of California San Diego, has studied the “psychological dynamics” of offering “pay what you want” systems and finds that consumer behaviors are different depending on the way the offers are communicated.
Ayelet Gneezy
Here’s what Dr. Gneezy has found in her research:
● When people can pay what they want and they also know that half of the price is going to charity, payments and donations rise well beyond what is collected if just one of these two options is offered.
● It helps to offer a suggested price that is close to what consumers think is fair in relation to the inherent value. Too far off that mark means that consumer reluctance – and participation – are liable to kick in.
● When people are asked to think about how much they wish to pay before doing so … they tend to pay less.
● Asking people to pay at least something is more likely to generate sustainable revenues, because laziness tends to win out over a sense of responsibility.
The bottom line on pay-what-you-want systems appears to be this: It’s probably not a good idea to adopt the program if you can’t afford to risk losing a good deal of money. It is possible to minimize or manage the risk, but a lot can go wrong, too.
Fortunately for Panera Bread, its overall organization is large enough and financially strong enough to be able to absorb any misfires regarding its initiatives.
Plus, they’re able to display their social consciously bona fides in the process.
I haven’t encountered “pay-what-you-want” pricing personally. I wonder if any readers have – and if so, how you responded. Please share your experiences with other readers.
Celebrating in the geriatric ward: The online banner ad turns 20.
It might come as a surprise to some, but the online banner ad is 20 years old this year.
In general, 20 years doesn’t seem very old, but in the online word, 20 years is ancient.
Simply put, banner ads represent the geriatric ward of online advertising.
In fact, there’s very little to love anymore about an advertising tool that once seemed so fresh and new … and now seems so tired and worn-out.
Furthermore, banner ads are a symbol of what’s wrong with online advertising. They’re unwelcome. They intrude on people’s web experience. And they’re ignored by nearly everyone.
A whole lotta … nothing? Online banner ads in 2015.
But despite all of this, banner ads are as ubiquitous as ever.
Consider these stats as reported by Internet analytics company ComScore:
The number of display ads served in the United States approaches 6 trillion annually.
Fewer than 500 different advertisers alone are responsible for delivering 1 billion of these ads.
The typical Internet user is served about 1,700 banner ads per month. (For 25 to 34 year-olds, it’s around 2,100 per month.)
Approximately 30% of banner ad impressions are non-viewable.
And when it comes to banner ad engagement, it’s more like … disengagement:
According to DoubleClick, Google’s ad serving services subisidary, banner ads have a click rate of .04% (4 out of every 10,000 served) for ads sized 468×60 pixels.
According to GoldSpot Media, as many as 50% of clicks on mobile banner ads are accidental.
According to ComScore, just 8% of Internet users are responsible for ~85% of the clicks on banner ads.
Come to think of it, “banner blindness” seems wholly appropriate for an advertising vehicle that’s as old as this one is in the web world.
The final ignominy is that people trust banner ads even less than they do TV ads: 15% vs. 29%, according to a survey conducted by market research company eMarketer.
Despite the drumbeat of negative news and bad statistics, banner advertising continues to be a bulwark of the online advertising system.
Publishers love them because they’re easy to produce and cost practically nothing to run.
Ad clients understand them better than other online promotional tactics, so they’re easier to sell either as premium content or as part of ad networks and exchanges.
There’s plenty of talk about native advertising, sponsored content and many other advertising tactics that seem a lot fresher and newer than banner ads. But I suspect we’ll continue to be inundated with them for years to come.
What do you think? Do you have a different prediction? Please share your thoughts with other readers here.

 Most of us are aware of the kinds of words that trip spam alarms and cause e-mails to be sent straight to the junk folder – or not to be delivered at all.
 Dear Friend