What are the short- and long-term implications of self-driving automobiles?

McKinsey’s take:  In a world where people don’t take charge of the wheel themselves … we’ll all be better off.

The Google Driverless Car

From Google’s fleet of driverless cars to the Mercedes-Benz Robo-Car concept, self-driving automobiles are stepping off the pages of science fiction and into real life.

But how many of us have really stopped to think about how the adoption of self-driving vehicles will change everyday life as we know it?

Consulting firm McKinsey & Co. has done so, and a recently released report predicts some pretty major changes – most of them very fine, indeed.  Here’s a sampling:

  • The number of car crashes will plummet.
  • “Drivers” will become “riders,” with more time for working, leisure and interaction with others.
  • “Dead time” in commuting will decrease, and productivity will increase as a result.
  • The ubiquity of the multi-car household will change.

And it’s not just McKinsey that is looking at self-driving cars with such optimism.

Even the normally dour and scolding National Highway Traffic Safety Administration predicts that consumer adoption of self-driving vehicles will usher in “completely new possibilities for improving highway safety, increasing environmental benefits, expanding mobility, and creating new economic opportunities for jobs and investment.”

But self-driving cars won’t overtake conventional automobiles in one fell swoop.  The McKinsey report outlines a timeline for adoption of self-driving features — and it’s pretty drawn-out.

Within the next three to five years, McKinsey anticipates that cars will self-handle highway cruising and traffic jams.

The more difficult challenges of driving in urban areas and dealing with variables like pedestrians, cyclists and so forth will be tackled over the coming 25 years.

Thus, the impact of “autonomous” technology will be limited until about 2020.  McKinsey figures that the technology will experience growing pains in the years 2020-2035 as driverless cars go more mainstream.

During this period, there will be numerous issues that will need to be resolved, with clear hub-and-spoke implications:

  • The development of comprehensive rules regarding how self-driving cars are developed, tested, approved and licensed (on an international basis)
  •  Changes in insurance practices – migrating from individual coverage to automaker policies that cover technical failures
  •  The growth of remote diagnostics and over-the-air updates
  •  The decline in importance of independent automotive repair shops
  •  The reduced need for taxi drivers and long-haul carrier jobs

The McKinsey report takes us beyond the year 2040, too, which is the point when McKinsey predicts that autonomous cars will become the primary means of transport in the United States.

The implications of this are guesstimates more than anything else, but McKinsey speculates on the following long-term effects:

Mercedes-Benz "car of the future":  Seats facing every which-way.
Mercedes-Benz “car of the future”: Seats facing every which-way.
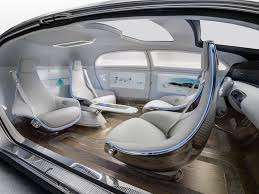
  • Car designs will change dramatically – no more need for mirrors and pedals … and car seats will face any direction.
  • Space savings on streets, roadways and parking lots from more efficient vehicle use.
  •  Fewer cars will be needed compared to today, with one autonomous car doing the job of two conventional vehicles in the typical household. The vehicles will be more expensive but fewer of them will be needed, for net savings for consumers.

As for the economic impact, the figures are difficult to quantify as some sectors of the economy will be up and others down.  But with a projected 90% drop in car crashes, the savings in auto repair and healthcare bills alone are project to be around $180 billion.

If we accept the McKinsey report’s bottom-line findings, it seems the “brave new world” of self-driving cars can’t come soon enough.  But what are your thoughts?  Are there negative implications  or “unintended consequences” that will be part of the revolution?  Please share your perspectives here.

So Many Marketing Channels … So Many Vendors …

Managing multiple vendors has become nearly a full-time job for some marketers.

marketing channelsManaging channel communications isn’t very easy for marketers these days, that’s for sure.  It’s because so many companies are using multiple outbound channels to connect with their customers.

Illustrating this point, at the Direct Marketing Association’s 2014 annual conference, some 250 marketers were surveyed by Yes Lifecycle Marketing about their activities.

The results of that survey revealed that more than half of the marketers are using at least six outbound channels to connect with customers.  And another 20% use more than ten channels.

Guess what this means?  Nearly 30% of these marketers report that they’re managing (or more likely juggling) seven or more technology vendors and service providers as part of their MarComm duties.

More to the point, many marketers are devoting huge chunks of their week just coordinating all of these tech and service providers.

For an unlucky ~20% of the respondents, the time commitment is upwards of 15 hours each week – more than a third of the time that makes up a 40-hour week.  (“What’s a 40-hour week in marketing?” one might ask, of course.)

Even for marketers who are using a smaller number of vendors to support their media and communications channel efforts, the involvement of various internal stakeholders is high – more than seven, on average, during the vendor selection process.  So the coordination responsibilities just keep adding up.

What this means … 

The Yes Lifecycle Marketing Survey found a correlation between the “choreography” demands of managing multiple vendors and the fact that other marketing activities suffer as a result — namely, market strategizing, business operations and customer relationship-building.

And even with those duties getting shorter shrift, the marketers surveyed still complained about having too many vendors to coordinate … significant challenges with properly integrating the various functions … insufficient budgets … and above all, a lack of adequate staffing.

To top it off, the typical tenure of a Chief Marketing Officer at a company isn’t exactly lengthy — ~45 months at last count.  It’s enough to make one wonder if a job in marketing is worth it.

The answer to that question can be summed up this way (with credit to Oscar Wilde and apologies for the riff):  “The only thing worse than being busy is … not being busy.”

What’s the Latest Forecast on U.S. Ad Spending?

ad forecastingMost observers agree that 2015 will be a decent-or-better year for ad spending.  But how will it break down by media segment?

Industry and market forecasting firm Strategy Analytics has just released its latest U.S. advertising spend forecast, which it expects to total almost $190 billion.  That’s about a 3% increase over 2014.

But there are wide variations in the growth expectations depending on the media type.

Digital advertising leads the pack, with an expected growth increase in double digits, while at the other end of the scale, print advertising is forecast to drop by approximately 8%:

  • Digital advertising: 13.0% increase in 2015 U.S. ad spend
  • Outdoor advertising: +4.8%
  • Cinema advertising: +3.4%
  • Radio advertising: +1.8%
  • TV advertising: +1.7%
  • Print advertising: -7.9%

Of course, “digital advertising” is a broad category, and within it Strategy Analytics expects certain sub-categories to grow at a faster clip:  Social media advertising looks to be the star in 2015 (+31%), followed by video advertising (+29%) and mobile advertising (+20%).

Even with these lucrative growth expectations, search advertising (SEM) will continue to represent the lion’s share of digital ad revenues – around 45%.

Also, despite the dramatic growth of digital, the segment isn’t expected to break 30% of all U.S. advertising in 2015.  The more traditional TV ad segment continues to lead all others, although it has fallen below the 50% share of all advertising in recent years.

Here’s what Strategy Analytics is forecasting for ad expenditures by media segment for 2015:

  • TV advertising: ~$79 billion in 2015 U.S. ad spending
  • Digital advertising: ~$53 billion
  • Print advertising: ~$28 billion
  • Radio advertising: ~$18 billion
  • Outdoor advertising: ~$9 billion
  • Cinema advertising: ~$1 billion

Strategy AnalyticsLeika Kawasaki, a digital media analyst and one of the Strategy Analytics Advertising Forecast report’s co-authors, notes that  looking ahead to 2018, TV’s share of advertising revenue is expected to fall further to ~40%, while digital advertising’s share will reach ~35%.

However, it’s not that TV’s volume will be declining — it’s more that digital will be robbing more funds from other segments (particularly radio and print).

Additional details on the 2015 forecast can be viewed here — if you wish to shell out $7,000 for the report, that is.

Is Mobile Fraud Getting Set to Balloon?

mobileMobile commerce is the latest big development in e-commerce.  So it’s not surprising that nearly all companies engaged in e-commerce expect their mobile sales revenues to grow significantly over the next three to five years.

In fact, a new survey of ~250 such organizations conducted by IT services firm J. Gold Associates, Inc. finds that half of them anticipate their mobile revenue growth to be between 10% and 50% over the next three years.

Another 30% of the companies surveyed expect even bigger growth:  between 50% and 100% over the period.

So … how could there be any sort of negative aspect to this news?

One word:  Fraud.

Fraud in e-commerce is already with us, of course.  For mobile purchases made now, a third of the organizations surveyed by Gold Associates reported that fraud losses account for about 5% of their total mobile-generated revenues.

For an unlucky 15% of respondents, fraud makes up around 10% of their mobile revenues.

And for an even more miserable 15%, the fraud losses are a whopping 25% of their total mobile revenues.

Risk management firm LexisNexis Risk Solutions has also been crunching the numbers on e-commerce fraud.  It’s found that mobile fraud grew at a 70% rate between 2013 and 2014.

That’s a disproportionately high rate, as it turns out, because mobile commerce makes up ~21% of all fraudulent transactions tracked by LexisNexis, even though mobile makes up only ~14% of all e-commerce transactions.

The propensity for fraud to happen in mobile commerce is likely related to the dynamics of mobile communications.  Unlike desktops, laptops and tablets, “throwaway” phone devices are a fact of life, as are the plethora of carriers — some of them distinctly less reputable than others.

fraudsterConsidering the growth trajectory of mobile e-commerce, doubtless there will be efforts to rein in the incidence of fraud – particularly via analyzing the composition and source of cellphone data.

Some of the data attributes that are and will continue to be the subject of real-time scrutiny include the following “red flags”:

>   A phone number being assigned to non-contracted carrier instead of a contracted one means the propensity for fraud is higher. 

>   Mobile traffic derived from subprime offers could be a fraud breeding-ground. 

>   Multiple cellphones (five or more) associated with the same physical address can be a strong indicator of throwaway phones and fraudulent activity. 

The question is whether this degree of monitoring will be sufficient to keep the incidence of mobile fraud from “exploding” – to use Gold Associates’ dramatic adjective.

I think the jury’s out on that one … but what do you think?

Social media and marketing: Is the honeymoon over?

social mediaIt’s no secret that companies large and small have been putting significant energy into social media marketing and networking in recent years.

It’s happened for a variety of reasons – not least as a defensive strategy to keep from losing out over competitors who might be quicker to adopt social media strategies and leverage them for their business.

And yet …

Now that the businesses have a good half-decade of social media marketing under their belt, it’s pretty safe to say that social tactics aren’t very meaningful sales drivers.

That’s not just me talking.  It’s also Forrester Research, which as far back as 2011 and 2012 concluded this after analyzing the primary sales drivers for e-commerce.  Forrester found that less than 1% was driven by social media.

And in subsequent years, it’s gotten no better.

A case in point:  IBM Smarter Commerce, which tracks sales generated by 500 leading retail sites, has reported that Facebook, LinkedIn, YouTube and Twitter combined represent less than 0.5% of the sales generated on Black Friday in the United States.

Those dismal results aren’t to say that social media doesn’t have its benefits.  Generating “buzz” and building social influence certainly have their place and value.

But considering what some businesses have put into social media in terms of their MarComm resources, a channel that contributes less than 1% of sales revenues seems like a pretty paltry result – and very likely a negative ROI, too.

Going forward, it would seem that more companies should pursue social media marketing less out of a fear of losing out to competitors, and more based on whether it proves itself as an effective marketing tactic for them.

Consider the points listed below.  They’ve been true all along, but they’re becoming even more apparent with the passage of time:

1.  Buying “likes” isn’t worth much beyond the most basic tactical “bragging rights” aspects, because “likes” have little intrinsic value and can’t be tied directly to an increased revenue stream.

2.  A great social media presence doesn’t trump having good products and service; even dynamite social media can’t camouflage shortcomings of this kind for long.

3.  Audiences tend to “discount” the value of content that comes directly from a company.  This means publishing compelling content that clears that hurdle requires more skill and expertise than many companies have been willing to allocate to social media content creation.

Calibrating the way they look at social media is the first step companies can take to establish the correct balance between social media marketing activities and expected results.  Instead of treating social media as the connection with customers, view it as a tool to connect with customers.

It’s really just a new link in the same chain of engagement that successful companies have forged with their customers for decades.  In working with my clients, I’ve seen this scenario play out the same basic way time and again; it matters very little what type of business or markets they serve.

What about you?  Have your social media experiences been similar to this — or different?  I welcome hearing your perspectives.

World brands: Who’s up … Who’s down?

brand finance logoEach year, the brand valuation consulting firm Brand Finance produces a report on the strength of the world’s Top 500 brands.

It’s an interesting study in that Brand Finance calculates the values of brands using the so-called “royalty relief” approach – calculating a royalty rate that would be charged for the use of the brand name if it weren’t already owned by the company.

In the 2015 report, just issued, Apple remains the world’s most valuable brand based on this criterion.  The Top 10 listing of world brands is as follows:

brand finance global 500 2015#1  Apple

#2  Samsung

#3  Google

#4  Microsoft

#5  Verizon

#6  AT&T

#7  Amazon

#8  GE

#9  China Mobile

#10 Walmart

Of these, all but China Mobile were in the Top 10 listing in Brand Finance’s 2014 rankings.  Of the others, all maintained their rank except for AT&T and Amazon, which rose, and GE and Walmart, which fell.

The most valuable brands differ by region, however.  In fact, Apple is tops only in North America:

Most valuable brand in North America:  Apple

… in Europe:  BMW

… in Asia/Pacific:  Samsung

… in the Middle East:  Emirates Air

… in Africa:  MTN (M-Cell)

… in South America:  Banco Bradesco

As for which brand’s value is growing the fastest, top honors goes to … Twitter?

That is correct:  According to Brand Finance, Twitter’s value has mushroomed from $1.5 billion in early 2014 to nearly $4.5 billion now.

Other social platform firms that have experienced big growth are Facebook (up nearly 150%) and the Chinese-based Baidu (up over 160%).

What about in non-tech or social media sectors?  There, Chipotle racked up the biggest growth in brand value:  nearly 125%.  At the other end of the scale, the McDonald’s brand has lost about $4 billion in value over the past year.

Most Powerful Brands 

In addition to its brand value analysis, Brand Finance also publishes a ranking of most powerful brands based on its “brand strength index” (BSI).  This index focuses on factors more easily influenced by marketing and brand management activities — namely, marketing investment and brand equity/goodwill.

In this analysis, Brand Finance comes up with a very different set of “top brands” – led by Lego:

Lego logo#1  Lego:  BSI = 93.4

#2  PWC (PricewaterhouseCoopers):  91.8

#3  Red Bull:  91.1

#4 (tie)  McKinsey:  90.1

#4 (tie)  Unilever:  90.1

#6 (tie)  Burberry:  89.7

#6 (tie)  L’Oréal:  89.7

#6 (tie)  Rolex:  89.7

#9 (tie)  Coca-Cola:  89.6

#9 (tie)  Ferrari:  89.6

#9 (tie)  Nike:  89.6

#12 (tie) Walt Disney:  89.5

According to Brand Finance, Lego’s brand power stems from it being a “creative, hands-on toy that encourages creativity in kids and nostalgia in their parents, resulting in a strong cross-generational appeal.”  Lego also has a big consumer marketing presence, thanks to its brand activities in film, TV and comics.

Last year’s top brand was Ferrari, which has now slipped in the rankings.  Brand Finance cited the brand’s 1990s-era “sheen of glory” as wearing a bit thin 20 years on.

For more details on these brands and other aspects of the 2015 evaluation, you can review Brand Finance’s 2015 report here.

Do any of the results come as a surprise to you?  Please share your observations with other readers as to why certain specific brands are coming on strong while others may be fading.

Doing Well by Doing Good: The Panera Bread Experience

Panera Cares

It was an idea that seemed pretty novel back in 2009 – and it was introduced with more than a little fanfare.

Panera Bread, the fast-casual bakery-café chain long known for its corporate citizenship, opened a series of stores in urban areas that touted a “pay what you can” pricing model.

The company’s charitable foundation opened these “Panera Cares” community cafés in five locations:  metro St. Louis, Chicago, Detroit, Boston and Portland, OR.

It was the next logical step for a company that had already set up its Operation Dough-Nation initiative in the 1990s.  Those activities included operating Community Breadbox cash collection boxes and donating unsold bread and baked goods to local hunger relief charities – to the tune of $100 million+ in retail value each year.

As for Panera Cares, the difference between these outlets and other Panera stores is that they operate only on suggested prices with donation boxes.  Each outlet serves approximately 3,500 people weekly.

What’s been the experience of these locations?

Interestingly, Panera chose to open them in thriving urban zones rather than in inner city districts with borderline neighborhoods.

For example, the Lakeview (Chicago) location sits amongst million-dollar townhomes along with people on the street, meaning that there are customers who can help support the café as well as those who can benefit from having a free meal.

SAME Cafe Denver
SAME Café, Denver, Colorado

The idea of Panera’s foundation was to deliver an experience that was profoundly different from a community soup kitchen or similar locations, which can have an institutional feel (as well as serving institutional-type food).

In this regard, the company’s chairman, Ron Shaich, got the idea from viewing an NBC News profile of SAME Café in Denver, CO, a restaurant founded in 2006 that also operates on a “pay what you can” model.

To make the concept work, consumers who have extra funds are asked to donate them … those who are short of funds can pay less … and those who can’t pay anything can volunteer for an hour and eat for no charge.

One way for the business model to work is operating the stores under the Panera Bread Foundation – a tax-exempt operation.  That enables the business model to be successful even though these stores bring in only about 70% of a conventional Panera outlet’s typical revenue.

Panera Bread logoBut Panera’s attempt to expand the concept beyond its five community cafés and into its regular stores wasn’t as successful.

In 2013, Panera pulled the plug on an experimental “pay what you want” turkey chili menu offering at around 50 St. Louis-area stores.  Customers could pay the $5.89 “suggested” price … they could pay more … pay less … or pay nothing.

The company reported that after an initial burst of publicity and interest, customers stopped realizing the option existed — hence the program’s termination.

But there may be a bit more to it than that.  Ayelet Gneezy, a marketing and behavioral sciences professor at the University of California San Diego, has studied the “psychological dynamics” of offering “pay what you want” systems and finds that consumer behaviors are different depending on the way the offers are communicated.

Ayelet Gneezy
Ayelet Gneezy

Here’s what Dr. Gneezy has found in her research:

●     When people can pay what they want and they also know that half of the price is going to charity, payments and donations rise well beyond what is collected if just one of these two options is offered.

●     It helps to offer a suggested price that is close to what consumers think is fair in relation to the inherent value.  Too far off that mark means that consumer reluctance – and participation – are liable to kick in. 

●     When people are asked to think about how much they wish to pay before doing so … they tend to pay less. 

●     Asking people to pay at least something is more likely to generate sustainable revenues, because laziness tends to win out over a sense of responsibility. 

The bottom line on pay-what-you-want systems appears to be this:  It’s probably not a good idea to adopt the program if you can’t afford to risk losing a good deal of money.  It is possible to minimize or manage the risk, but a lot can go wrong, too.

Fortunately for Panera Bread, its overall organization is large enough and financially strong enough to be able to absorb any misfires regarding its initiatives.

Plus, they’re able to display their social consciously bona fides in the process.

I haven’t encountered “pay-what-you-want” pricing personally.  I wonder if any readers have – and if so, how you responded.  Please share your experiences with other readers.

Banner Ads Turn 20 This Year …

… But who really wants to celebrate?

paint the town red
Celebrating in the geriatric ward: The online banner ad turns 20.

It might come as a surprise to some, but the online banner ad is 20 years old this year.

In general, 20 years doesn’t seem very old, but in the online word, 20 years is ancient.

Simply put, banner ads represent the geriatric ward of online advertising.

In fact, there’s very little to love anymore about an advertising tool that once seemed so fresh and new … and now seems so tired and worn-out.

Furthermore, banner ads are a symbol of what’s wrong with online advertising.  They’re unwelcome.  They intrude on people’s web experience.  And they’re ignored by nearly everyone.

Old banner advertising
A whole lotta … nothing? Online banner ads in 2015.

But despite all of this, banner ads are as ubiquitous as ever.

Consider these stats as reported by Internet analytics company ComScore:

  • The number of display ads served in the United States approaches 6 trillion annually.
  • Fewer than 500 different advertisers alone are responsible for delivering 1 billion of these ads. 
  • The typical Internet user is served about 1,700 banner ads per month. (For 25 to 34 year-olds, it’s around 2,100 per month.) 
  • Approximately 30% of banner ad impressions are non-viewable.

paying no attention to advertisingAnd when it comes to banner ad engagement, it’s more like … disengagement:

  • According to DoubleClick, Google’s ad serving services subisidary, banner ads have a click rate of .04% (4 out of every 10,000 served) for ads sized 468×60 pixels. 
  • According to GoldSpot Media, as many as 50% of clicks on mobile banner ads are accidental. 
  • According to ComScore, just 8% of Internet users are responsible for ~85% of the clicks on banner ads.

Come to think of it, “banner blindness” seems wholly appropriate for an advertising vehicle that’s as old as this one is in the web world.

The final ignominy is that people trust banner ads even less than they do TV ads:  15% vs. 29%, according to a survey conducted by market research company eMarketer.

Despite the drumbeat of negative news and bad statistics, banner advertising continues to be a bulwark of the online advertising system.

Publishers love them because they’re easy to produce and cost practically nothing to run.

Ad clients understand them better than other online promotional tactics, so they’re easier to sell either as premium content or as part of ad networks and exchanges.

There’s plenty of talk about native advertising, sponsored content and many other advertising tactics that seem a lot fresher and newer than banner ads.  But I suspect we’ll continue to be inundated with them for years to come.

What do you think?  Do you have a different prediction?  Please share your thoughts with other readers here.

Managing email communications: Winning the battle … losing the war?

many emailsHere’s a statistic that won’t come as a big surprise to many office workers … but it still looks pretty stark when you see it on the page:  According to research by McKinsey Global Institute, knowledge workers, including managers and professionals, spend nearly 30% of their work time managing e-mail communications.

This means that for a typical 50-hour work week, a total of 15 hours are sucked up in the e-mail vortex.

It’s nothing new, of course.  And for years, companies and individuals have been making efforts in big and small ways to manage their e-mail.

One method has been through the use of IM social collaboration platforms, but that solves only some of the problem.

Other methods include aggressive pruning of spam mail … sending unsubscribe notices … and tightening incoming mail filters.

e-mail inboxBeing more aggressive with e-mail unsubscribe requests can lighten the inbox, but other pruning efforts can sometimes be counterproductive, with “good” e-mails getting sent to junk e-mail folders, thereby requiring workers to scan those inboxes every day as well.

Another popular e-mail management technique can work at cross-purposes, too.  Research by Carnegie Mellon Institute has found that about a third of office workers file their e-mail messages into folders right after they’ve been read.

But according to Alex Moore, who heads up e-mail management service Baydin, Inc. creating files associated with different clients, projects or people turns out to have its own inefficiencies when searching for e-mail messages later.

It seems counterintuitive, but searching for older e-mail correspondence is often easier to do when using a single chronological file coupled with a search function, because it’s just one search instead of potentially many.

inbox managementSpeaking as someone who receives around 200 e-mail messages each business day, give or take, I find that the following strategies work best for me:

  • Unsubscribing – as best as possible (even with the shortcomings of attempting to do so)
  • Keeping my settings so that e-mail messages download every 20 minutes instead of right away
  • Aside from important client messages, “batch-processing” e-mails just four times each business day: early morning, late morning, mid-afternoon, and end-of-day

Adopting these practices makes it easier for me to concentrate on my other work tasks, keeping those Job 1 and relegating e-mail management to being “ornaments on the tree” rather than the tree itself.

If other readers use particular e-mail management techniques and tactics that are effective for them, let’s hear about them.  Please share your thoughts below.

Gallup’s CEO Calls the Official U.S. Unemployment Rate a “Big Lie”

American consumersI’ve blogged before about how the American public doesn’t seem to be responding to the news that the country has been out of its economic recession for a number of years now.

It’s not for lack of trying.  From the White House and other politicians to government agencies, financial industry practitioners and news media articles, there’s been a steady stream of speeches, announcements, news items and commentary lamenting the disconnect between the perception and the reality.

Plus … I’m reminded often by my business counterparts who work in Europe and Asia that the situation is much better in America than in many other countries.  I consider it advice to “count our blessings,” as it were.

With this as backdrop, it’s easy to fall into the paradigm of thinking that the American public is simply being unrealistic in its expectations for economic recovery — and the recovery’s ability to reach into all strata of society.

But then … along comes a commentary by Jim Clifton, chairman and CEO of the Gallup polling organization.

Jim Clifton Gallup CEO
Jim Clifton

In addition to heading what is arguably America’s most famous polling company, Mr. Clifton is a keen observer of economics and public policy.  He is also the author of the book The Coming Jobs War (published in 2011).

The gist of Clifton’s commentary is that the official unemployment rate, as reported by the U.S. Department of Labor, is very misleading.

Moreover, it’s Clifton’s contention that the very way the Department of Labor calculates the unemployment rate goes straight to the heart of the disconnect between the experts and the “person on the street.”

Here’s what Clifton wrote in a column released earlier this month:

“If a family member or anyone is unemployed and has subsequently given up on finding a job — if you are so hopelessly out of work that you’ve stopped looking [for work] over the past four weeks — the Department of Labor doesn’t count you as unemployed. 

That’s right:  While you are as unemployed as one could possibly be, and tragically may never find work again, you are not counted in the [unemployment] figure we see relentlessly in the news — currently 5.6%.”  

official U.S. unemployment rate
The official U.S. unemployment rate as reported by the United States Department of Labor’s Bureau of Labor Statistics.

In Clifton’s estimation, right now as many as 30 million Americas are either out of work or severely unemployed.  That would equate to an unemployment rate far higher than the reputed 5.6% figure.

But it goes even beyond that.  Clifton points out another clue as to why the perception gulf between the “statisticians” and the “street” seems so wide — and he puts it in the form of two examples:

“Say you’re an out-of-work engineer or healthcare worker or construction worker or retail manager.  If you perform a minimum of one hour of work in a week and are paid at least $20 — maybe someone pays you to mow their lawn — you’re not officially counted as unemployed in the much-reported 5.6% [figure]  

Few Americans know this. 

Yet another figure of importance that doesn’t get much press:  those working part time but wanting full-time work.  If you have a degree in chemistry or math and are working 10 hours part time because it is all you can find — in other words, you are severely unemployed — the government doesn’t count you in the 5.6%.   

Few Americans know this.”

Clifton doesn’t mince words in his characterization of the official unemployment rate; he calls it a “Big Lie” — one which has consequences that go well-beyond simply the stats being arguably wrong.

Here’s how he puts it:

“… It’s a lie that has consequences because the Great American Dream is to have a good job — and in recent years, America has failed to deliver that dream more than it has in any other time in recent memory.   

A good job is an individual’s primary identity — their very self-worth, their dignity.  It establishes the relationship they have with their friends, community and country.  When we fail to deliver a good job that fits a citizen’s talents, training and experience, we are failing the American Dream.”

Statisticians and economic policy experts can and do disagree about what constitutes a “good job” in America.  The Gallup organization defines it as working 30 or more hours per week for an organization that provides a regular paycheck, with or without other benefits.

That’s actually a pretty low-bar for what defines a “good job.”  But however jobs are defined, the U.S. economy is currently delivering at a rate of just 44%, which equates to the number of full-time jobs as a percent of the adult population (age 18 and over).

It would seem that the 44% figure would need to be significantly higher to really solve the challenge of available jobs.

Clifton concludes his commentary by issuing this challenge:

“I hear all the time that ‘unemployment is greatly reduced, but the people aren’t feeling it.’  When the media, talking heads, the White House and Wall Street start reporting the truth — the percent of Americans in good jobs; jobs that are full time and real — then we will quit wondering why Americans aren’t ‘feeling’ something that doesn’t remotely reflect the reality in their lives. 

And we will quit wondering what hollowed out the middle class.”

I’ve devoted significant space in this blog post to quoting Jim Clifton’s words verbatim, so as not to change their tenor or dilute them in any way.

What do you think?  Is Clifton speaking truth to power?  Or is he painting an overly negative view of things?  I welcome your thoughts and comments.