Mobile commerce is the latest big development in e-commerce. So it’s not surprising that nearly all companies engaged in e-commerce expect their mobile sales revenues to grow significantly over the next three to five years.
In fact, a new survey of ~250 such organizations conducted by IT services firm J. Gold Associates, Inc. finds that half of them anticipate their mobile revenue growth to be between 10% and 50% over the next three years.
Another 30% of the companies surveyed expect even bigger growth: between 50% and 100% over the period.
So … how could there be any sort of negative aspect to this news?
One word: Fraud.
Fraud in e-commerce is already with us, of course. For mobile purchases made now, a third of the organizations surveyed by Gold Associates reported that fraud losses account for about 5% of their total mobile-generated revenues.
For an unlucky 15% of respondents, fraud makes up around 10% of their mobile revenues.
And for an even more miserable 15%, the fraud losses are a whopping 25% of their total mobile revenues.
Risk management firm LexisNexis Risk Solutions has also been crunching the numbers on e-commerce fraud. It’s found that mobile fraud grew at a 70% rate between 2013 and 2014.
That’s a disproportionately high rate, as it turns out, because mobile commerce makes up ~21% of all fraudulent transactions tracked by LexisNexis, even though mobile makes up only ~14% of all e-commerce transactions.
The propensity for fraud to happen in mobile commerce is likely related to the dynamics of mobile communications. Unlike desktops, laptops and tablets, “throwaway” phone devices are a fact of life, as are the plethora of carriers — some of them distinctly less reputable than others.
Considering the growth trajectory of mobile e-commerce, doubtless there will be efforts to rein in the incidence of fraud – particularly via analyzing the composition and source of cellphone data.
Some of the data attributes that are and will continue to be the subject of real-time scrutiny include the following “red flags”:
> A phone number being assigned to non-contracted carrier instead of a contracted one means the propensity for fraud is higher.
> Mobile traffic derived from subprime offers could be a fraud breeding-ground.
> Multiple cellphones (five or more) associated with the same physical address can be a strong indicator of throwaway phones and fraudulent activity.
The question is whether this degree of monitoring will be sufficient to keep the incidence of mobile fraud from “exploding” – to use Gold Associates’ dramatic adjective.
I think the jury’s out on that one … but what do you think?
It was an idea that seemed pretty novel back in 2009 – and it was introduced with more than a little fanfare.
Panera Bread, the fast-casual bakery-café chain long known for its corporate citizenship, opened a series of stores in urban areas that touted a “pay what you can” pricing model.
The company’s charitable foundation opened these “Panera Cares” community cafés in five locations: metro St. Louis, Chicago, Detroit, Boston and Portland, OR.
It was the next logical step for a company that had already set up its Operation Dough-Nation initiative in the 1990s. Those activities included operating Community Breadbox cash collection boxes and donating unsold bread and baked goods to local hunger relief charities – to the tune of $100 million+ in retail value each year.
As for Panera Cares, the difference between these outlets and other Panera stores is that they operate only on suggested prices with donation boxes. Each outlet serves approximately 3,500 people weekly.
What’s been the experience of these locations?
Interestingly, Panera chose to open them in thriving urban zones rather than in inner city districts with borderline neighborhoods.
For example, the Lakeview (Chicago) location sits amongst million-dollar townhomes along with people on the street, meaning that there are customers who can help support the café as well as those who can benefit from having a free meal.
SAME Café, Denver, Colorado
The idea of Panera’s foundation was to deliver an experience that was profoundly different from a community soup kitchen or similar locations, which can have an institutional feel (as well as serving institutional-type food).
In this regard, the company’s chairman, Ron Shaich, got the idea from viewing an NBC News profile of SAME Café in Denver, CO, a restaurant founded in 2006 that also operates on a “pay what you can” model.
To make the concept work, consumers who have extra funds are asked to donate them … those who are short of funds can pay less … and those who can’t pay anything can volunteer for an hour and eat for no charge.
One way for the business model to work is operating the stores under the Panera Bread Foundation – a tax-exempt operation. That enables the business model to be successful even though these stores bring in only about 70% of a conventional Panera outlet’s typical revenue.
But Panera’s attempt to expand the concept beyond its five community cafés and into its regular stores wasn’t as successful.
In 2013, Panera pulled the plug on an experimental “pay what you want” turkey chili menu offering at around 50 St. Louis-area stores. Customers could pay the $5.89 “suggested” price … they could pay more … pay less … or pay nothing.
The company reported that after an initial burst of publicity and interest, customers stopped realizing the option existed — hence the program’s termination.
But there may be a bit more to it than that. Ayelet Gneezy, a marketing and behavioral sciences professor at the University of California San Diego, has studied the “psychological dynamics” of offering “pay what you want” systems and finds that consumer behaviors are different depending on the way the offers are communicated.
Ayelet Gneezy
Here’s what Dr. Gneezy has found in her research:
● When people can pay what they want and they also know that half of the price is going to charity, payments and donations rise well beyond what is collected if just one of these two options is offered.
● It helps to offer a suggested price that is close to what consumers think is fair in relation to the inherent value. Too far off that mark means that consumer reluctance – and participation – are liable to kick in.
● When people are asked to think about how much they wish to pay before doing so … they tend to pay less.
● Asking people to pay at least something is more likely to generate sustainable revenues, because laziness tends to win out over a sense of responsibility.
The bottom line on pay-what-you-want systems appears to be this: It’s probably not a good idea to adopt the program if you can’t afford to risk losing a good deal of money. It is possible to minimize or manage the risk, but a lot can go wrong, too.
Fortunately for Panera Bread, its overall organization is large enough and financially strong enough to be able to absorb any misfires regarding its initiatives.
Plus, they’re able to display their social consciously bona fides in the process.
I haven’t encountered “pay-what-you-want” pricing personally. I wonder if any readers have – and if so, how you responded. Please share your experiences with other readers.
I’ve blogged before about how the American public doesn’t seem to be responding to the news that the country has been out of its economic recession for a number of years now.
Plus … I’m reminded often by my business counterparts who work in Europe and Asia that the situation is much better in America than in many other countries. I consider it advice to “count our blessings,” as it were.
With this as backdrop, it’s easy to fall into the paradigm of thinking that the American public is simply being unrealistic in its expectations for economic recovery — and the recovery’s ability to reach into all strata of society.
In addition to heading what is arguably America’s most famous polling company, Mr. Clifton is a keen observer of economics and public policy. He is also the author of the book The Coming Jobs War (published in 2011).
The gist of Clifton’s commentary is that the official unemployment rate, as reported by the U.S. Department of Labor, is very misleading.
Moreover, it’s Clifton’s contention that the very way the Department of Labor calculates the unemployment rate goes straight to the heart of the disconnect between the experts and the “person on the street.”
Here’s what Clifton wrote in a column released earlier this month:
“If a family member or anyone is unemployed and has subsequently given up on finding a job — if you are so hopelessly out of work that you’ve stopped looking [for work] over the past four weeks — the Department of Labor doesn’t count you as unemployed.
That’s right: While you are as unemployed as one could possibly be, and tragically may never find work again, you are not counted in the [unemployment] figure we see relentlessly in the news — currently 5.6%.”
The official U.S. unemployment rate as reported by the United States Department of Labor’s Bureau of Labor Statistics.
In Clifton’s estimation, right now as many as 30 million Americas are either out of work or severely unemployed. That would equate to an unemployment rate far higher than the reputed 5.6% figure.
But it goes even beyond that. Clifton points out another clue as to why the perception gulf between the “statisticians” and the “street” seems so wide — and he puts it in the form of two examples:
“Say you’re an out-of-work engineer or healthcare worker or construction worker or retail manager. If you perform a minimum of one hour of work in a week and are paid at least $20 — maybe someone pays you to mow their lawn — you’re not officially counted as unemployed in the much-reported 5.6% [figure].
Few Americans know this.
Yet another figure of importance that doesn’t get much press: those working part time but wanting full-time work. If you have a degree in chemistry or math and are working 10 hours part time because it is all you can find — in other words, you are severely unemployed — the government doesn’t count you in the 5.6%.
Few Americans know this.”
Clifton doesn’t mince words in his characterization of the official unemployment rate; he calls it a “Big Lie” — one which has consequences that go well-beyond simply the stats being arguably wrong.
Here’s how he puts it:
“… It’s a lie that has consequences because the Great American Dream is to have a good job — and in recent years, America has failed to deliver that dream more than it has in any other time in recent memory.
A good job is an individual’s primary identity — their very self-worth, their dignity. It establishes the relationship they have with their friends, community and country. When we fail to deliver a good job that fits a citizen’s talents, training and experience, we are failing the American Dream.”
Statisticians and economic policy experts can and do disagree about what constitutes a “good job” in America. The Gallup organization defines it as working 30 or more hours per week for an organization that provides a regular paycheck, with or without other benefits.
That’s actually a pretty low-bar for what defines a “good job.” But however jobs are defined, the U.S. economy is currently delivering at a rate of just 44%, which equates to the number of full-time jobs as a percent of the adult population (age 18 and over).
It would seem that the 44% figure would need to be significantly higher to really solve the challenge of available jobs.
Clifton concludes his commentary by issuing this challenge:
“I hear all the time that ‘unemployment is greatly reduced, but the people aren’t feeling it.’ When the media, talking heads, the White House and Wall Street start reporting the truth — the percent of Americans in good jobs; jobs that are full time and real — then we will quit wondering why Americans aren’t ‘feeling’ something that doesn’t remotely reflect the reality in their lives.
And we will quit wondering what hollowed out the middle class.”
I’ve devoted significant space in this blog post to quoting Jim Clifton’s words verbatim, so as not to change their tenor or dilute them in any way.
What do you think? Is Clifton speaking truth to power? Or is he painting an overly negative view of things? I welcome your thoughts and comments.
Recent reports on economic activity appear to show a continuation of a rather wobbly recovery of the U.S. economy since coming out of the Great Recession.
Still, things are still better for the U.S. economy as compared to many others around the world.
America’s small businesses appear to feel similarly about the U.S. economy. Their perspective may be even more positive, in fact.
Illustrating this perspective, a January 2015 survey of ~850 U.S. businesses (ones that employ ten or fewer full-time or part-time workers) finds small business owners having a pretty bullish outlook on the year ahead.
In a survey conducted by web hosting company Endurance International Group (formerly Bizland), two-thirds of the respondents reported positive prospects for their businesses for 2015:
General business outlook is very positive: ~26% of respondents
Generally positive outlook: ~45%
Neutral outlook: ~25%
Negative outlook: ~5%
These findings align quite neatly with how these business owners see 2015 as compared to 2014’s performance:
2015 will be positive compared to 2014: ~66% of respondents
2015 will be about the same: ~29%
2015 will be negative compared to 2014: ~5%
But … these positive impressions happen with no thanks to the government. When asked if they felt that the U.S. Congress is effective in addressing the issues that are important to small businesses, a whopping 87% gave thumbs-down.
Even the changes in Congressional leadership that came about as a result of the 2014 midterm elections have done little to improve the perceptions of these business owners, as ~69% do not believe that the new leadership in Congress will be any more effective in addressing small business issues in 2015.
And what are those issues that are so important to small businesses?
They’re the usual things: business taxes first and foremost … followed by the ability to obtain financing.
The next tier of issues includes the ability to hire workers with the appropriate skills, along with the ongoing healthcare coverage challenges.
Any other issues are basically just an asterisk at the bottom of the page …
More details on the survey results can be found here.
Actually, the pronouncement isn’t really all that earth-shattering.
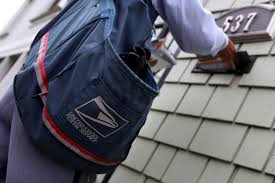
But the fact that “letters are going away” has been stated by a spokesperson for the United States Postal Service speaks volumes.
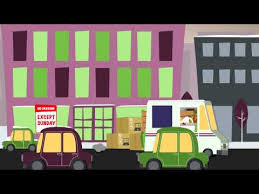
The comment came after a not-for-profit interest group calling itself the “Taxpayers Protection Alliance” released a video that admonishes the USPS to “stick to delivering our letters.”
In the cartoon video, a girl is mailing a holiday card to her grandmother while complaining that it’s getting harder and harder to send First Class mail.
Referring to the package delivery and grocery delivery services that the USPS now offers, the cartoon character pleads for the USPS “stop cutting mail services in favor of these other costly things and stick to what we really need them to do: deliver our letters.”
The Postal Service’s response can be summed up in two words: “Dream on.”
In fact, here’s what a USPS spokesperson stated to Target Marketing magazine about single-piece First Class mail, which includes personal correspondence and bill payments:
“[It] historically has funded the organization, since we do not receive tax dollars. Package volume is growing exponentially … The mail mix is changing and the Postal Service welcomes that change.”
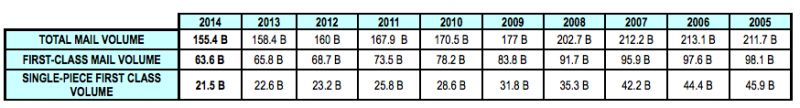
Indeed, First Class mail volume — and particularly single-piece First Class mail — has been declining rapidly, as can be seen in the USPS’s annual volume figures shown below:
First Class Mail Volume Trends: 2005 – 2014. (Source: U.S. Postal Service)
By comparison, package delivery has grown by nearly 20% over the past five years.
Target Marketing and others have done a bit of digging to learn more about the “Taxpayers Protection Alliance” … and they’ve discovered that the group is particularly perturbed about the USPS getting into the grocery products delivery business.
“Expanding services into the private market is not only wrong because it undercuts private competitors,” the TPA organization’s president David Williams complains, “but because it is coming at the expense of its government-granted monopoly – mail delivery.”
All of which makes it intriguing to speculate who is actually behind the “Taxpayers Protection Alliance” and what particular agenda they may have. Hint: private companies that offer grocery delivery services, perhaps?
But the bigger news is this: The USPS is no longer even pretending to claim that First Class mail is a central part of its business model looking to the future. And that’s a huge change from only a couple of years ago.
As we’ve closed out the year 2014, more than a few people – from politicians to business leaders and business journalists – have sought to reassure us that the American economy is not only on the right track, it’s back in a big way.
But evidently, word hasn’t trickled down to “John Q. Public.” Or if it has, it’s been greeted by a gigantic Bronx Cheer.
We have the latest evidence of this in management consulting firm McKinsey & Company’s most recent annual Consumer Sentiment Survey, which was conducted in September 2014 with results released last month.
The bottom-line on consumer sentiment is that despite the recent spate of decent economic news and higher employment figures, people are still reluctant to increase spending, and thriftiness remains the order of the day.
While people don’t think things are deteriorating … they don’t think they’re becoming much better, either.
So … treading water is about all.
It’s not too difficult to figure out why sentiment continues to be so skittish. After all, median household income for Americans, adjusted for inflation, actually declined in recent years and hasn’t rebounded.
With people still feeling the earnings squeeze, it’s only natural that McKinsey’s findings show consumer sentiment still in the doldrums, with only ~23% feeling optimistic about America’s economy.
Consider these further findings from the research:
About 40% of respondents report that they are living “paycheck to paycheck”
Around 39% are at least somewhat worried about losing their job
Approximately 34% feel they have decreased ability to make ends meet financially
Not surprisingly, respondents with lower family incomes (under $75,000 per year) have higher concerns, and roughly 40% of those households report cutting back or delaying purchases as a result.
[Even among people living in households earning $150,000+ per year, one in five say that they’ve cut back or delayed purchases because of financial uncertainty.]
Activities we commonly associate with recessionary eras continue to be practiced by consumers. According to McKinsey’s research, those practices include:
Looking for ways to save money (comparison shopping, coupon use, etc.): ~55 of respondents report doing so
Purchasing more products online to save money: ~48%
Cutting spending over the past year: ~40%
Doing more shopping at “dollar stores”: ~34%
No longer preferring/buying more expensive product brands over private-label substitutes: ~33%
Where things really look different “on the ground” than in the economists’ forecasts is what the public is saying about their future behaviors: McKinsey believes that consumers and their attitudes have been permanently changed by the years of austerity.
The strongest indication of this? Nearly 40% of the survey respondents say that they’ll likely never go back to their pre-recession approaches to buying and spending.
As McKinsey concludes in its report: Cautious is the new normal … and it’s unlikely to change anytime soon.
Coming off of Thanksgiving Day and heading into the remaining holidays of the year, with their emphasis on “giving,” it’s tempting for we Americans to think of ourselves as a generous people.
Which we are. The latest comparative analysis proves the point.
In fact, America is tied with one other country as the most generous in the world.
And that other country is … wait for it … Myanmar.
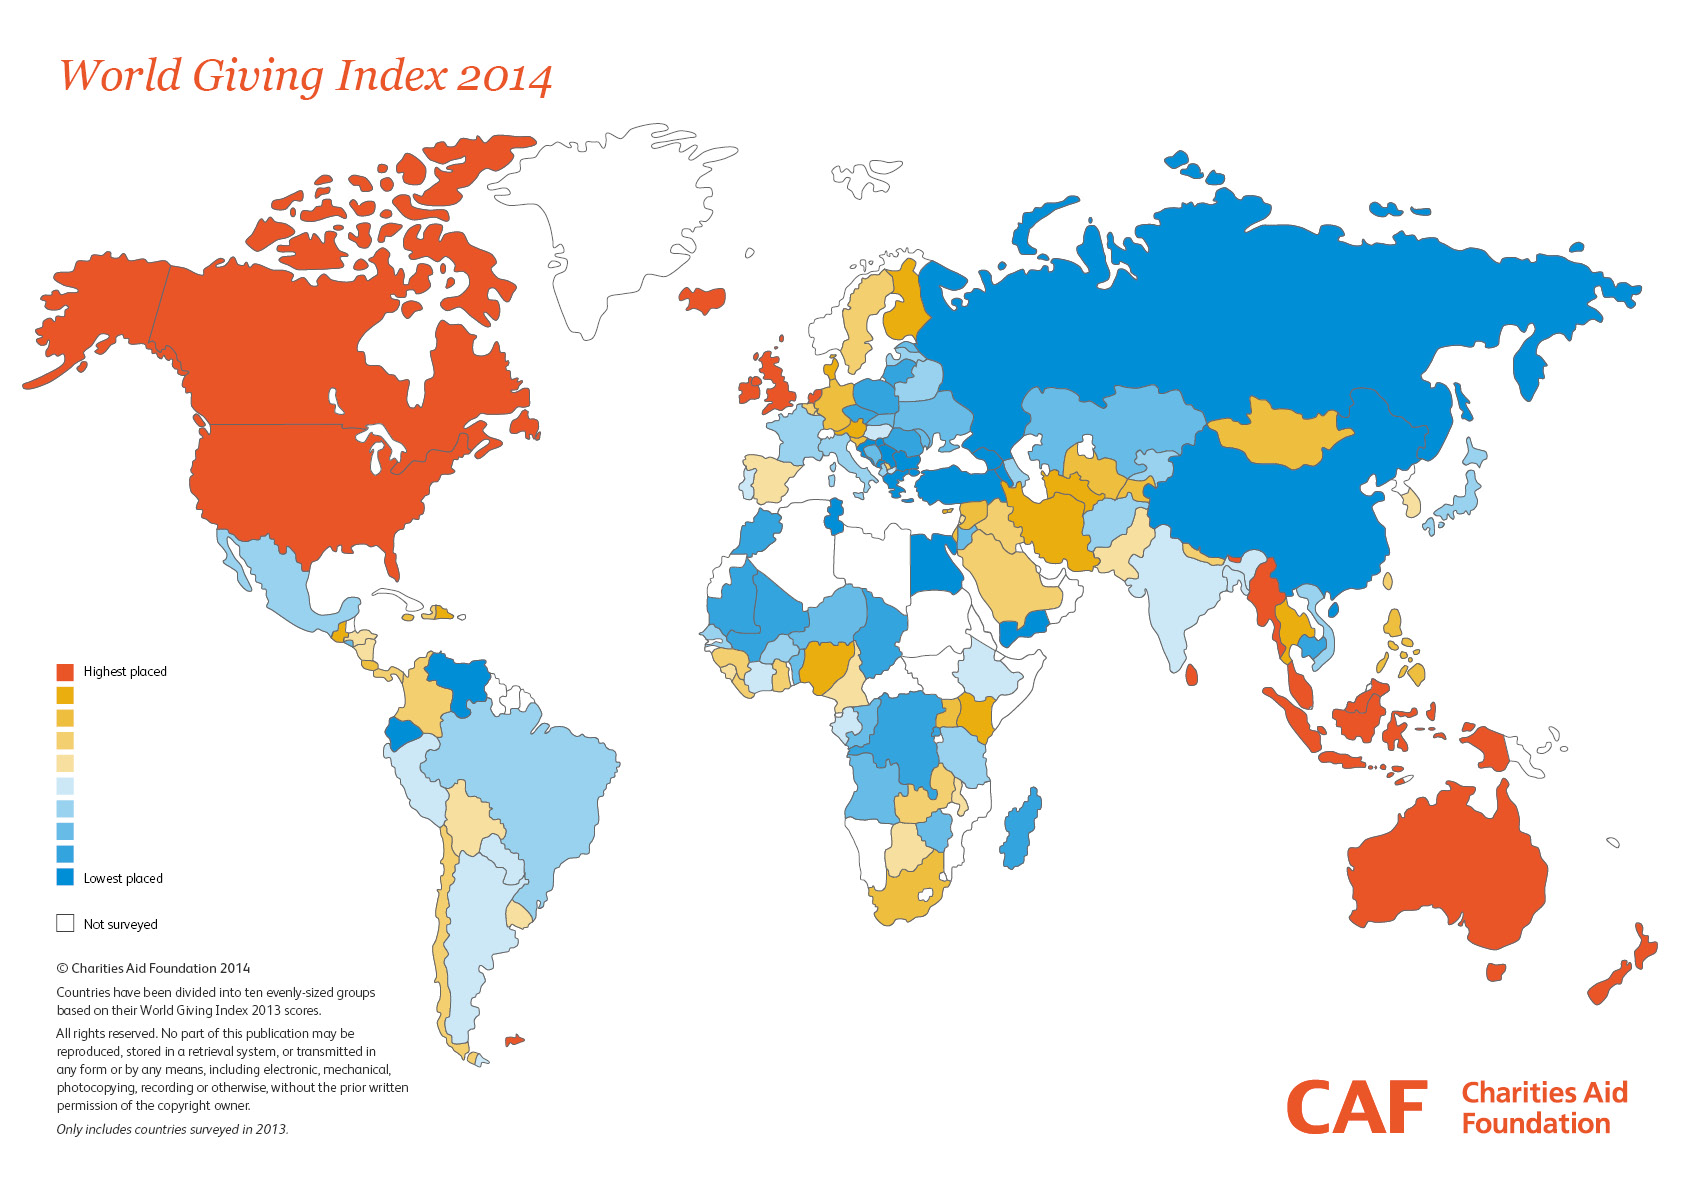
That is correct: the United States and Myanmar (Burma) each scored a 64% generosity rating in the recently published World Giving Index. The two nations were followed closely by Canada, Ireland, New Zealand and Australia.
The World Giving Index is actually an aggregated figure, calculated based on three kinds of giving:
Volunteering of time
Donating money
Helping a stranger
Data was collected in field research carried out across more than 140 countries via Gallup’s World View World Poll, then compiled by international research firm CAF-America for creating the World Giving Index based interview questions that measured the behaviors of people during the 30-day period prior to interviewing.
A sampling of adults in each of the countries was interviewed, with the percentages of people participating in each of the three behavioral attributes collected. The scores were amalgamated to determine the overall index score per country.
How did the United States achieve its first-place tie? It ranked #1 among all surveyed countries in helping a stranger (a participation score of 79%) … #5 in volunteering of time (a score of 44%) … and #9 in donating money (a score of 68%).
Myanmar’s route to the shared top spot was different: It ranked #1 for donating money (a participation score of 91%) … #2 for volunteering time (a score of 51%), but only #49 for helping a stranger (a score of 49%).
This 2014 World Giving Index “heat map” shows which nations are the most generous. (Gallup survey data amalgamated by CAF.)
For the record, here’s how the Top 10 countries fared in terms of their overall World Giving Index scores:
#1 (tie) USA: 64% World Giving Index score
#1 (tie) Myanmar: 64%
#3 (tie) Canada: 60%
#3 (tie) Ireland: 60%
#5 New Zealand: 58%
#6 Australia: 56%
#7 (tie) Malaysia: 55%
#7 (tie) United Kingdom: 55%
#9 (tie) Sri Lanka: 54%
#9 (tie) Trinidad & Tobago: 54%
Looking at the Top 10 list – and also at where the other countries surveyed fell further down the roster – it appears that living in a prosperous economy doesn’t necessarily translate into being more charitable.
If that were the case, we’d see the G20 economies making up the top tier — which they don’t.
“Aspiring” economies also don’t show up particularly well, either. The so-called BRIC nations (Brazil, Russia, India and China) are nowhere to be found in the Top 10 ranking.
The MINT nations (Mexico, Indonesia, Nigeria and Turkey) are no-shows, too.
Myanmar poses a very interesting case. It’s 91% rating of people giving money reflects a practice of charitable giving (daana) that is a centerpiece tenets of religious observance amongst the Theravada Buddhists that thrive in the country.
And in the United States, charitable giving participation rates have grown significantly in the years since the Great Recession, so that today about two-thirds of adults reported donating money within 30 days of when they were interviewed.
In the days following Black Friday this year, we heard reports that consumer purchase volumes at stores were down more than 10% compared to 2013.
A number of explanations for the decline were given, among them the notion that Black Friday sales are less of a draw this year, since merchandise sales now begin before Thanksgiving and tend to run the entire month of December.
But some observers speculated as to whether soft Black Friday revenue figures presage an equally soft holiday shopping season overall.
Well … now that we have sales figures from Cyber Monday (the Monday following Black Friday weekend), I think it’s safe to say that any concerns about a tepid holiday buying season are unfounded.
Custora E-Commerce Pulse, a customer relationship management firm which tracked more than 100 million online shoppers and over $40 billion in e-commerce revenue over the full Thanksgiving Holiday weekend, has just reported that Cyber Monday e-commerce revenues were up over 15% compared with Cyber Monday 2013.
That makes Cyber Monday 2014 the single biggest day in U.S. online shopping ever in history.
Other days of the Thanksgiving weekend also showed robust gains in online shopping: Black Friday online sales were up ~21% over 2013, and online shopping on Thanksgiving Day itself were up nearly 18% over Thanksgiving Day in 2013.
The strong growth was fueled by mobile shopping, e-mail marketing, plus online product searches on Google and other search engines.
In particular, mobile shopping accounted for ~22% of orders on Cyber Monday, significantly higher than the ~16% of orders recorded last year.
On Black Friday itself, mobile shopping accounted for around 30% of all orders — yet another dramatic increase over 2013 when mobile shopping account for just shy of 23% of orders.
This year’s Cyber Monday stats put the lie to the notion that e-mail marketing is losing its luster. In fact, e-mail marketing drove nearly one in four online shopping orders, outstripping natural search (at ~19% of all orders) and paid search (~16% of orders).
Much ado about (practically) nothing: Social media and Cyber Monday.
And guess which channels weren’t a meaningful part of the holiday shopping experience this year?
If you guessed social media … you’re absolutely correct.
Taken together, Facebook, Twitter, Pinterest and Instagram accounted for only about 1.5% of online e-commerce orders on Cyber Monday. (For the weekend as a whole, it was only slightly better at ~1.7%.)
This year’s statistics just add more confirmation of several truisms about online consumer marketing:
The articles of business thinker and writer Gord Hotchkiss are some of my favorite “go-to” columns on the web because they’re invariably thought-provoking pieces to read.
In one recent column, Hotchkiss poses an interesting set of questions and points surrounding what he dubs the emerging “metaphysical corporation.” He notes that more business today is being conducted in non-physical markets.
As he points out, “Businesses used to produce stuff. Now they produce ideas.”
To illustrate this claim, Hotchkiss cites a recent evaluation issued by intellectual property merchant bank Ocean Tomo, which reports that the asset mix of companies has undergone a massive shift over the past 40 years.
In 1975, tangible assets — equipment, buildings, inventory and land — made up more than 80% of the asset market value of the S&P 500 companies.
In just 35 years, that ratio has flipped completely. Intangible assets — patents, trademarks, goodwill, brand equity — now make up 80% of the S&P 500’s asset market value.
To Hotchkiss, this trend promised to have major implications on the future structure of corporations. He notes:
Historically, companies that made physical products needed a supply chain. Vertical integration was the common way to remove physical “transactional friction” from the manufacturing process. And vertical integration was best managed through hierarchical management styles.
On the other hand, companies that sell ideas or intangible products need to have a network. By their very nature, these networks don’t have physical friction, so supply chains aren’t required. In fact, attempting to control a network via a centralized organizational structure tends to be counterproductive, as branches of the network are prone to wither under such constraints.
Economic and social theorist Jeremy Rifkin takes this point even further. In his new book The Zero Marginal Cost Society, Rifkin contends that capitalism as we know it is dying a slow death, to be replaced by a new “collaborative common market” made possible by the shrinkage of marginal costs.
Building on this notion, Hotchkiss concludes:
“As we move from the physical to the metaphysical, the cost of producing consumable services or digital concept-based products … drops dramatically. Capital was required to overcome physical transactional friction. If that friction disappears, so does the need for capital.”
Like other big trends, this transformation won’t happen overnight. But it will happen by degrees in the coming years and decades, according to Hotchkiss.
… So much so that the corporates structure we know today will be all-but-unrecognizable to workers 50 years from now.
I find this theory pretty fascinating, and I certainly recognize the logic behind it. What are your thoughts about it? Are Hotchkiss and Rifkin onto something? Please share your thoughts with other readers here.
It may seem fanciful, but a new report published last week by The Conference Board concludes that the United States and other advanced economies will actually face significant labor shortages over the coming decade and a half.
This forecast has been made primarily based on the Baby Boomer workforce departing the labor market over this period.
The Baby Boomer phenomenon is what makes things different in now compared to the decades previously: For the first time since World War II, working age populations will actually be declining in mature markets.
As Dr. Gad Levanon, director of macroeconomics at The Conference Board reported, “The global financial crisis and its aftermath – stubbornly high unemployment in many countries – have postponed the onset of this demographic transformation, but will not prevent it from taking hold.”
According to The Conference Board’s analysis, several countries have already begun to see this happen, as their natural rates of employment have now fallen below their pre-recession levels: Japan, Germany, South Korea and Canada.
The same thing is expected to happen in the United States and the United Kingdom by 2015 … and in the Scandinavian countries, the Benelux countries plus Australia by 2016 or 2017.
Other mature economies like those of Spain, France, Portugal, Italy and Greece won’t experience this until the years further out – but The Conference Board predicts that it will happen there as well.
U.S. market sectors that are expected to experience the most severe labor shortages include healthcare occupations, STEM occupations (science, technology, engineering and mathematics), as well as skilled trades that don’t require a college degree but that do require specialist training.
Among the challenges The Conference Board envisions in these three major categories are the following:
Skilled labor occupations like construction, transportation and utility plant operations are going to be adversely affected by many more retirements happening than new job seekers coming in to fill the void.
STEM occupations won’t be as stressed as some might imagine, because higher productivity will alleviate the pressure on hiring more workers in IT and high-tech manufacturing segment. That being said, certain sub-segments such as information security, environmental and agricultural engineering, and applied mathematics are expected to face severe labor shortages.
The numbers of new entrants in various healthcare occupations are constrained by high barriers to entry such as extensive education and experience requirements, along with accreditation requirements.
The Conference Board report has constructed a Labor Shortage Index covering 32 countries. The index combines current labor-market tightness with future demographic trends to predict the likelihood of the different countries experiencing labor shortages.
The bottom line on the index: with the exception of the Mediterranean countries, all of the labor markets in developed economies are expected to be squeezed pretty tightly starting within the next few years.
It’s been quite a while since we’ve been hearing about pending labor shortages … but that’s exactly what The Conference Board is predicting. Here’s a link to more details about the report, which is appropriately titled From Not Enough Jobs to Not Enough Workers.
If you have thoughts or personal observations to share on the job markets on the domestic scene or internationally, please share them with other readers here.

 Mobile commerce is the latest big development in e-commerce. So it’s not surprising that nearly all companies engaged in e-commerce expect their mobile sales revenues to grow significantly over the next three to five years.
 Considering the growth trajectory of mobile e-commerce, doubtless there will be efforts to rein in the incidence of fraud – particularly via analyzing the composition and source of cellphone data.