Even with the end-of-year holidays coming up, for many families, the biggest vacation time of the year is now over.
And if you took that vacation and were able to steer completely clear of any work-related requirements … consider yourself lucky.
For years now, we’ve heard about the challenge to “disconnect” completely while on vacation, as more ways for the office to intrude on personal time and space continue to proliferate.
For the latest insights on this issue, we have a recent online survey of 6,600+ travelers from 14 urban areas around the world, conducted by Marriott Reward’s Global Travel Tracker. Foremost among the research findings is that the majority of us are staying connected with our work via e-mail or other digital means while on vacation.
Breaking down the responses by gender, a larger portion of women than men reported that they are able to completely disconnect from work while on vacation.
On the other hand, by a 36% to 44% margin, fewer men than women reported being “more stressed” upon returning to the office and facing the presumably larger stack of work requirements that have built up during their absence.
Interestingly, the Marriott Rewards survey found that residents of Tokyo report the highest levels of stress upon returning to work, whereas residents of Mexico City are at the other end of the scale. Residents of major U.S. cities – New York, Chicago and Los Angeles — fall in the middle range of the 14 international urban areas that were included in the Marriott Rewards survey.
Speaking personally, I haven’t been able to “completely disconnect” from the office while on vacation in living memory — and I don’t think I know anyone else who has.
What is your vacation track record in this regard? What sorts of strategies do you use to get the most relaxation out of your days away from the office? I’m quite sure other readers will be interested in hearing about them.
While public perceptions of “greedy businesspeople” have always been part of the sociological landscape, over the years opinions about family businesses have tended to be more forgiving.
That perception appears to be holding. A newly published report reveals that people trust family businesses significantly more than businesses in general.
The trust levels are ~75% for family-owned businesses versus just 59% overall.
That finding comes from a survey of ~15,000 respondents age 18 or older conducted by research firm Edelman Intelligence, which is part of the Edelman marketing communications firm.
The research was conducted across 12 country markets and are contained in the 2017 Edelman Trust Barometerreport. In addition to the United States, the other country markets that were surveyed included:
Brazil
Canada
China
France
Germany
India
Indonesia
Italy
Mexico
Saudi Arabia
United Kingdom
Not only do the respondents in the Edelman survey trust family businesses more, they themselves would rather work for a family business.
Moreover, if they know a company is a family-run business, they’re three times more likely to be willing to pay more for its products or services.
Not everything is quite so positive, however. Compared to businesses in general, family-run businesses aren’t viewed as innovators (only ~15% compared to ~45%), or drivers of financial success (just ~15% vs. ~43%).
Even more discouraging is this finding: Although in actuality family-run businesses are often major sources of philanthropy, only ~17% of the Edelman survey respondents view these companies as leaders in helping to address societal challenges. So, more work appears to be needed to attain the recognition that is deserved in this arena.
Another common perception – and this may be a more accurate one in reality – is that family-run businesses are skimpy in their willingness to share financial and other information about how their businesses are run.
But the most potentially harmful perception is the opinion the general public has about successive generations of family members managing family-run businesses. “Next-generation” CEOs are ~17% less trusted than founders. They’re also considered far more likely to mismanage the business – not to mention being seen as less committed to the success of their enterprises.
In short, an inherited business, like inherited wealth, is viewed with suspicion by many people, and it’s more likely to be perceived as “undeserved.”
So, the portrait of family businesses isn’t completely rosy … but the reputation of these enterprises remains better than for businesses in general.
More information and key findings from the Edelman report can be found here.
It’s common knowledge by now that the data breach at credit reporting company Equifax earlier this year affected more than 140 million Americans. I don’t know about you personally, but in my immediate family, it’s running about 40% of us who have been impacted.
And as it turns out, the breach occurred because one of the biggest companies in the world — an enterprise that’s charged with collecting, holding and securing the sensitive personal and financial data of hundreds of millions of people — was woefully ill-prepared to protect any of it.
How ill-prepared? The more you dig around, the worse it appears.
Since my brother, Nelson Nones, works every day with data and systems security issues in his dealings with large multinational companies the world over, I asked him for his thoughts and perspectives on the Equifax situation.
What he reported back to me is a cautionary tale for anyone in business today – whether you’re working in a big or small company. Nelson’s comments are presented below:
Background … and What Happened
According to Wikipedia, “Equifax Inc. is a consumer credit reporting agency. Equifax collects and aggregates information on over 800 million individual consumers and more than 88 million businesses worldwide.”
Founded in 1899, Equifax is one of the largest credit risk assessment companies in the world. Last year it reported having more than 9,500 employees, turnover of $3.1 billion, and a net income of $488.1 million.
On September 8, 2017, Equifax announced a data breach potentially impacting 143 million U.S. consumers, plus anywhere from 400,000 to 44 million British residents. The breach was a theft carried out by unknown cyber-criminals between mid-May 2017 until July 29, 2017, which is when Equifax first discovered it.
It took another 4 days — until August 2, 2017 — for Equifax to engage a cybersecurity firm to investigate the breach.
Equifax has since confirmed that the cyber-criminals exploited a vulnerability of Apache Struts, which is an open-source model-view-controller (MVC) framework for developing web applications in the Java programming language.
The specific vulnerability, CVE-2017-5638, was disclosed by Apache in March 2017, but Equifax had not applied the patch for this vulnerability before the attack began in mid-May 2017.
The workaround recommended by Apache back in March consists of a mere 27 lines of code to implement a Servlet filter which would validate Content-Type and throw away requests with suspicious values not matching multipart/form-data. Without this workaround or the patch, it was possible to perform Remote Code Execution through a REST API using malicious Content-Type values.
Subsequently, on September 12, 2017, it was reported that a company “online portal designed to let Equifax employees in Argentina manage credit report disputes from consumers in that country was wide open, protected [sic] by perhaps the most easy-to-guess password combination ever: ‘admin/admin’ … anyone authenticated with the ‘admin/admin’ username and password could … add, modify or delete user accounts on the system.”
Existing user passwords were masked, but:
“… all one needed to do in order to view [a] password was to right-click on the employee’s profile page and select ‘view source’. A review of those accounts shows all employee passwords were the same as each user’s username. Worse still, each employee’s username appears to be nothing more than their last name, or a combination of their first initial and last name. In other words, if you knew an Equifax Argentina employee’s last name, you also could work out their password for this credit dispute portal quite easily.”
The reporter who broke this story contacted Equifax and was referred to their attorneys, who later confirmed that the Argentine portal “was disabled and that Equifax is investigating how this may have happened.”
The Immediate Impact on Equifax’s Business
In the wake of these revelations, Equifax shares fell sharply: 15% on September 8, 2017, reducing market capitalization (shareholder value) by $3.97 billion in a single trading day.
Over the next 5 trading days, shares fell another 24%, reducing shareholder value by another $5.4 billion.
What this means is that the cost of the breach, measured in shareholder value lost by the close of business on September 15, 2017 (6 business days), was $9.37 billion – which is equivalent to the entire economic output of the country of Norway over a similar time span.
This also works out to losses of $347 million per line of code that Equifax could have avoided had it deployed the Apache Struts workaround back in March 2017.
The company’s Chief Information Officer and Chief Security Officer also “retired” on September 15, 2017.
Multiple lawsuits have been filed against Equifax. The largest is seeking $70 billion in damages sustained by affected consumers. This is more than ten times the company’s assets in 2016, and nearly three times the company’s market capitalization just before the breach was announced.
The Long-Term Impact on Equifax’s Brand
This is yet to be determined … but it’s more than likely the company will never fully recover its reputation. (Just ask Target Corporation about this.)
Takeaway Points for Other Companies
If something like this could happen at Equifax — where securely keeping the private information of consumers is the lifeblood of the business — one can only imagine the thousands of organizations and millions of web applications out there which are just as vulnerable (if not as vital), and which could possibly destroy the entire enterprise if compromised.
At most of the companies I’ve worked with over the past decade, web application development and support takes a back seat in terms of budgets and oversight compared to so-called “core” systems like SAP ERP. That’s because the footprint of each web application is typically small compared to “core” systems.
Of necessity, due to budget and staffing constraints at the Corporate IT level, business units have haphazardly built out and deployed a proliferation of web applications — often “on the cheap” — to address specific and sundry tactical business needs.
“Kid’s Day” at Equifax’s Argentine offices. Were the kids in command there, one is tempted to wonder …
I strongly suspect the Equifax portal for managing credit report disputes in Argentina — surely a backwater business unit within the greater Equifax organization — was one of those.
If I were a CIO or Chief Security Officer right now, I’d either have my head in the sand, or I’d be facing a choice. I could start identifying and combing through the dozens or hundreds of web applications currently running in my enterprise (each likely to be architecturally and operationally different from the others) to find and patch all the vulnerabilities. Or I could throw them all out, replacing them with a highly secure and centrally-maintainable web application platform — several of which have been developed, field-tested, and are readily available for use.
__________________________
So, there you have it from someone who’s “in the arena” of risk management every day. To all the CEOs, CIOs and CROs out there, here’s your wakeup call: Equifax is the tip of the spear. It’s no longer a question of “if,” but “when” your company is going to be attacked.
And when that attack happens, what’s the likelihood you’ll be able to repel it?
… Or maybe it’ll be the perfect excuse to make an unforeseen “early retirement decision” and call it a day.
__________________________
Update (9/25/17): And just like clockwork, another major corporation ‘fesses up to a major data breach — Deloitte — equally problematic for its customers.
Today I was talking with one of my company’s longtime clients about how much of a challenge it is to attract the attention of people in target marketing campaigns.
Her view is that it’s become progressively more difficult over the past dozen years or so.
Empirical research bears this out, too. Using data from a variety of sources including Twitter, Google+, Pinterest, Facebook and Google, Statistic Brain Research Institute‘s Attention Span Statistics show that the average attention span for an “event” on one of these platforms was 8.25 seconds in 2015.
Compare that to 15 years earlier, when the average attention span for similar events was 12.0 seconds.
That’s a reduction in attention span time of nearly one-third.
Considering Internet browsing statistics more specifically, an analysis of ~60,000 web page views found these behaviors:
Percent of page views that lasted more than 10 minutes: ~4%
% of page views that lasted fewer than 4 seconds: ~17%
% of words read on web pages that contain ~100 words or less: ~49%
% of words read on an average web page (around ~600 words): ~28%
The same study discovered what surely must be an important reason why attention spans have been contracting. How’s this tidy statistic: The average number of times per hour that an office worker checks his or her e-mail inbox is … 30 times.
Stats like the ones above help explain why my client – and so many others just like her – are finding it harder than ever to attract and engage their prospects.
Fortunately, factors like good content and good design can help surmount these difficulties. It’s just that marketers have to try harder than ever to achieve a level of engagement that used to come so easily.
More results from the Statistic Brain Research Institute study can be found here.
It seems almost unbelievable that the first e-mail was sent nearly 50 years ago. That makes e-mail older than the majority of the people who live in the United States.
But in another sense, e-mail seems timeless. That’s underscored in the results from Adobe’s latest Consumer E-Mail Survey Report, released this past month.
One of the key findings from that survey is that ~85% of the respondents see their use of e-mail increasing or staying the same over the next two years.
Even many Gen Z respondents – people in their 20s – see their use of e-mail in similar terms; ~41% of them predict that their use of e-mail at work will increase, and ~30% see the same happening in their personal e-mail use.
In the work environment, e-mail has solidified itself as the preferred method of communication for many of the activities of daily interaction. When compared against other methods of communication like phone, face-to-face interaction, instant messaging, video chat, file sharing and enterprise social networks, e-mail comes out on top in many instances:
Communicating status updates on a project: ~60% prefer e-mail, followed by phone (~16%)
Delivering feedback: ~52% prefer e-mail, followed by phone (~30%)
Getting a brief question answered: ~35% prefer e-mail, followed by face-to-face (~25%)
And yet … there are a number of tasks where a face-to-face conversation is more preferred as a communications method:
Suggesting a new approach or idea
Asking for help on a big project
Alerting your manager or boss of an important issue
But without a doubt, “quitting your job” is where more than three-fourths of respondents consider a face-to-face communication as the most appropriate method, compared to just 11% who consider e-mail to be appropriate for communicating that kind of news.
These characteristics serve to illustrate that e-mail’s big power is in its efficiency and effectiveness for facilitating more “transactional” communications. But for topics and tasks that require more social finesse – like asking for help, pitching a new idea, or discussing problems – face-to-face interaction still rules the day.
This explains e-mail’s ubiquity and its staying power. It’s quite elegant, really; tt does what it needs to do – communicating quickly and efficiency without unnecessary complications.
E-mail enables both send and receive to communicate on their respective timelines, without disruption.
It provides an archival record of communication (just ask Wikileaks).
It’s fully integrated into people’s work flows.
This last point helps explain why so many “alternative” communication methods fail to catch on in a major way. The next time you hear of some start-up enterprise promising to abolish the inbox, take it with a big grain of salt.
History and logic would suggest that something, someday would overtake e-mail and make it obsolete. After all, in the 50 years since e-mail has been with us, we’ve see all sorts of other communications tools lose their luster – think VCRs, FAX machines, tape decks, QR codes, and information on CD-ROM.
But e-mail may be the exception. It’s pretty amazing how something that’s changed so little over the decades is still such an integral part of our communications.
More findings from the 2017 Adobe survey are summarized here.
Over the past decade or so, consumers have been faced with basically two options regarding unwanted e-mail that comes into their often-groaning inboxes. And neither one seems particularly effective.
One option is to unsubscribe to unwanted e-mails. But many experts caution against doing this, claiming that it risks getting even more spam e-mail instead of stopping the delivery of unwanted mail. Or it could be even worse, in that clicking on the unsubscribe box might risk something even more nefarious happening on their computer.
On the other hand, ignoring junk e-mail or sending it to the spam folder doesn’t seem to be a very effective response, either. Both Google and Microsoft are famously ineffective in determining which e-mails actually constitute “spam.” It isn’t uncommon that e-mail replies to the personal who originated the discussion get sent to the spam folder.
How can that be? Google and Microsoft might not even know the answer (and even if they did, they’re not saying a whole lot about how those determinations are made).
Even more irritating – at least for me personally – are finding that far too many e-mails from colleagues in my own company are being sent to spam – and the e-mails in question don’t even contain attachments.
How are consumers handling the crossed signals being telegraphed about how to handle spam e-mail? A recent survey conducted by digital marketing firm Adestra has found that nearly three-fourths of consumers are using the unsubscribe button – and that figure has increased from two-thirds of respondents in the 2016 survey.
What this result tells us is that the unsubscribe button may be working more times than not. If that means that the unwanted e-mails stop arriving, then that’s a small victory for the consumer.
[To access the a summary report of Adestra’s 2017 field research, click here.]
What’s been your personal experience with employing “ignore” versus “unsubscribe” strategies? Please share your thoughts with other readers.
I’ve blogged before about the most expensive keywords in search engine marketing. Back in 2009, it was “mesothelioma.”
Of course, that was eight years and a lifetime ago in the world of cyberspace. In the meantime, asbestos poisoning has become a much less lucrative target of ambulance-chasing attorneys looking for multi-million dollar court settlements.
Today, we have a different set of “super-competitive” keyword terms vying for the notoriety of being the “most expensive” ones out there. And while none of them are flirting with the $100 per-click pricing that mesothelioma once commanded, the pricing is still pretty stratospheric.
According to recent research conducted by online advertising software services provider WordStream, the most expensive keyword categories in Google AdWords today are these:
“Business services”: $58.64 average cost-per-click
“Bail bonds”: $58.48
“Casino”: $55.48
“Lawyer”: $54.86
“Asset management”: $49.86
Generally, the reasons behind these terms and other terms being so expensive is the dynamic of the “immediacy” of the needs or challenges people are looking to solve.
Indeed, other terms that have high-end pricing include such ones as “plumber,” “termites,” and “emergency room near me.”
Amusingly, one of the most expensive keywords on Google AdWords is … “Google” itself. That term ranks 25th on the list of the most expensive keywords.
[To see the complete listing of the 25 most expensive keywords found in WordStream’s research, click here.]
WordStream also conducted some interesting ancillary research during the same study. It analyzed the best-performing ads copy/content associated with the most expensive key words to determine which words were the most successful in driving clickthroughs.
Running this textual analysis found that the most lucrative calls-to-action included ad copy that contained the following terms:
Build
Buy
Click
Discover
Get
Learn
Show
Sign up
Try
Are there keyword terms in your own business category or industry that you feel are way overpriced in relation to their value they deliver for the promotional dollar? If so, which ones?
How many times have you noticed location data on Google Maps and other online mapping services that are out-of-date or just plain wrong? I encounter it quite often.
It hits close to home, too. While most of my company’s clients don’t usually have reason to visit our company’s office (because they’re from out of state or otherwise situated pretty far away from our location in Chestertown, MD), for the longest while Google Maps’s pin for our company pointed viewers to … a stretch of weeds in an empty lot.
It turns out, the situation isn’t uncommon. Recently, the Wawa gas-and-food chain hired an outside firm to verify its location data on Google, Facebook and Foursquare. What Wawa found was that some 2,000 address entries had been created by users, including duplicate entries and ones with incorrect information.
Unlike a company like mine which doesn’t rely on foot traffic for business, for a company like Wawa, that’s the lifeblood of its operations. As such, Wawa is a high-volume advertiser with numerous campaigns and promotions going at once — including ones on crowdsourced driving and traffic apps like Google’s Waze.
With so much misleading location data swirling around, the last thing a company needs to see is a scathing review appearing on social media because someone was left staring at a patch of weeds in an empty lot instead being able to redeem a new digital coupon for a gourmet cookie or whatever.
Problems with incorrect mapping don’t happen just because of user-generated bad data, either. As in my own company’s case, the address information can be completely accurate – and yet somehow the map pin associated with it is misplaced.
Companies such as MomentFeed and Ignite Technologies have been established whose purpose is to identify and clean up bad map data such as this. It can’t be a one-and-done effort, either; most companies find that it’s yet another task that needs continuing attention – much like e-mail database list hygiene activities.
Perhaps the worst online map data clanger I’ve read about was a retail store whose pin location placed it 800 miles east of the New Jersey coastline in the middle of the Atlantic Ocean. What’s the most spectacular mapping fail you’ve come across personally?
Recently, the American Customer Satisfaction Index reported that the perceived quality of Google and other search platforms is on a downward trajectory. In particular, Google’s satisfaction score has declined two percentage points to 82 out of a possible high score of 100, according to the ACS Index.
Related to this trend, search advertising ROI is also declining. According to a report published recently by Analytic Partners, the return on investment from paid search dropped by more than 25% between 2010 and 2016.
In all likelihood, a falling ROI can be linked to lower satisfaction with search results. But let’s look at things a little more closely.
First of all, Google’s customer satisfaction score of 82 is actually better than the 77 score it had received as recently as 2015. In any case, attaining a score of 82 out of 100 isn’t too shabby in such customer satisfaction surveys.
Moreover, Google has been in the business of search for a solid two decades now – an eternity in the world of the Internet. Google has always had a laser-focus on optimizing the quality of its search results, seeing as how search is the biggest “golden egg” revenue-generating product the company has (by far).
Obviously, Google hasn’t been out there with a static product. Far from it: Google’s search algorithms have been steadily evolving to the degree that search results stand head-and-shoulder above where they were even five years ago. Back then, search queries typically resulted in generic results that weren’t nearly as well-matched to the actual intent of the searcher.
That sort of improvement is no accident.
But one thing has changed pretty dramatically – the types of devices consumers are using to conduct their searches. Just a few years back, chances are someone would be using a desktop or laptop computer where viewing SERPs containing 20 results was perfectly acceptable – and even desired for quick comparison purposes.
Today, a user is far more likely to be initiating a search query from a smartphone. In that environment, searchers don’t want 20 plausible results — they want one really good one.
You could say that “back then” it was a browsing environment, whereas today it’s a task environment, which creates a different mental framework within which people receive and view the results.
So, what we really have is a product – search – that has become increasingly better over the years, but the ground has shifted in terms of customer expectations.
Simply put, people are increasingly intolerant of results that are even a little off-base from the contextual intent of their search. And then it becomes easy to “blame the messenger” for coming up short – even if that messenger is actually doing a much better job than in the past.
It’s like so much else in one’s life and career: The reward for success is … a bar that’s set even higher.
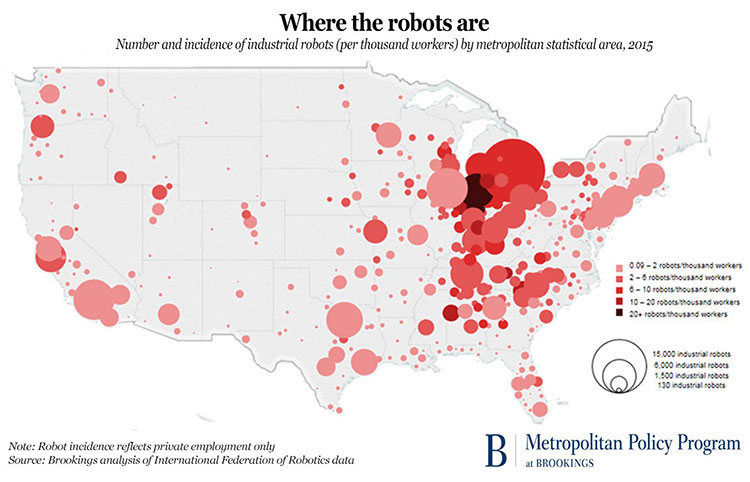
The Brookings Institution has just published a fascinating map that tells us a good deal about what is happening with American manufacturing today.
Headlined “Where the Robots Are,” the map graphically illustrates that as of 2015, nearly one-third of America’s 233,000+ industrial robots are being put to use in just three states:
Michigan: ~12% of all industrial robots working in the United States
Ohio: ~9%
Indiana: ~8%
It isn’t surprising that these three states correlate with the historic heart of the automotive industry in America.
Not coincidentally, those same states also registered a massive lurch towards the political part of the candidate in the 2016 U.S. presidential election who spoke most vociferously about the loss of American manufacturing jobs.
The Brookings map, which plots industrial robot density per 1,000 workers, shows that robots are being used throughout the country, but that the Great Lakes Region is home to the highest density of them.
Toledo, OH has the honor of being the “Top 100” metro area with the highest distribution of industrial robots: nine per 1,000 workers. To make it to the top of the list, Toledo’s robot volume jumped from around 700 units in 2010 to nearly 2,400 in 2015, representing an average increase of nearly 30% each year.
For the record, here are the Top 10 metropolitan markets among the 100 largest, ranked in terms of their industrial robot exposure. They’re mid-continent markets all:
Toledo, OH: 9.0 industrial robots per 1,000 workers
Detroit, MI: 8.5
Grand Rapids, MI: 6.3
Louisville, KY: 5.1
Nashville, TN: 4.8
Youngstown-Warren, OH: 4.5
Jackson, MS: 4.3
Greenville, SC: 4.2
Ogden, UT: 4.2
Knoxville, TN: 3.7
In terms of where industrial robots are very low to practically non-existent within the largest American metropolitan markets, look to the coasts:
Ft. Myers, FL: 0.2 industrial robots per 1,000 workers
Honolulu, HI: 0.2
Las Vegas, NV: 0.2
Washington, DC: 0.3
Jacksonville, FL: 0.4
Miami, FL: 0.4
Richmond, VA: 0.4
New Orleans, LA: 0.5
New York, NY: 0.5
Orlando, FL: 0.5
When one consider that the automotive industry is the biggest user of industrial robots – the International Federation of Robotics estimates that the industry accounts for nearly 40% of all industrial robots in use worldwide – it’s obvious how the Midwest region could end up being the epicenter of robotic manufacturing activity in the United States.
It should come as no surprise, either, that investments in robots are continuing to grow. The Boston Consulting Group has concluded that a robot typically costs only about one-third as much to “employ” as a human worker who is doing the same job tasks.
In another decade or so, the cost disparity will likely be much greater.
On the other hand, two MIT economists maintain that the impact of industrial robots on the volume of available jobs isn’t nearly as dire as many people might think. According to Daron Acemoglu and Pascual Restrepo:
“Indicators of automation (non-robot IT investment) are positively correlated or neutral with regard to employment. So even if robots displace some jobs in a given commuting zone, other automation (which presumably dwarfs robot automation in the scale of investment) creates many more jobs.”
What do you think? Are Messrs. Acemoglu and Restrepo on point here – or are they off by miles? Please share your thoughts with other readers.

 Even with the end-of-year holidays coming up, for many families, the biggest vacation time of the year is now over.