Native Advertising, Sponsored Content and “Truthiness”

There are just a few slight problems with sponsored content:  Readers consider it less trustworthy … and value it less.

Lack of trust in sponsored content
It’s really not that interesting — and I don’t trust you, anyway.

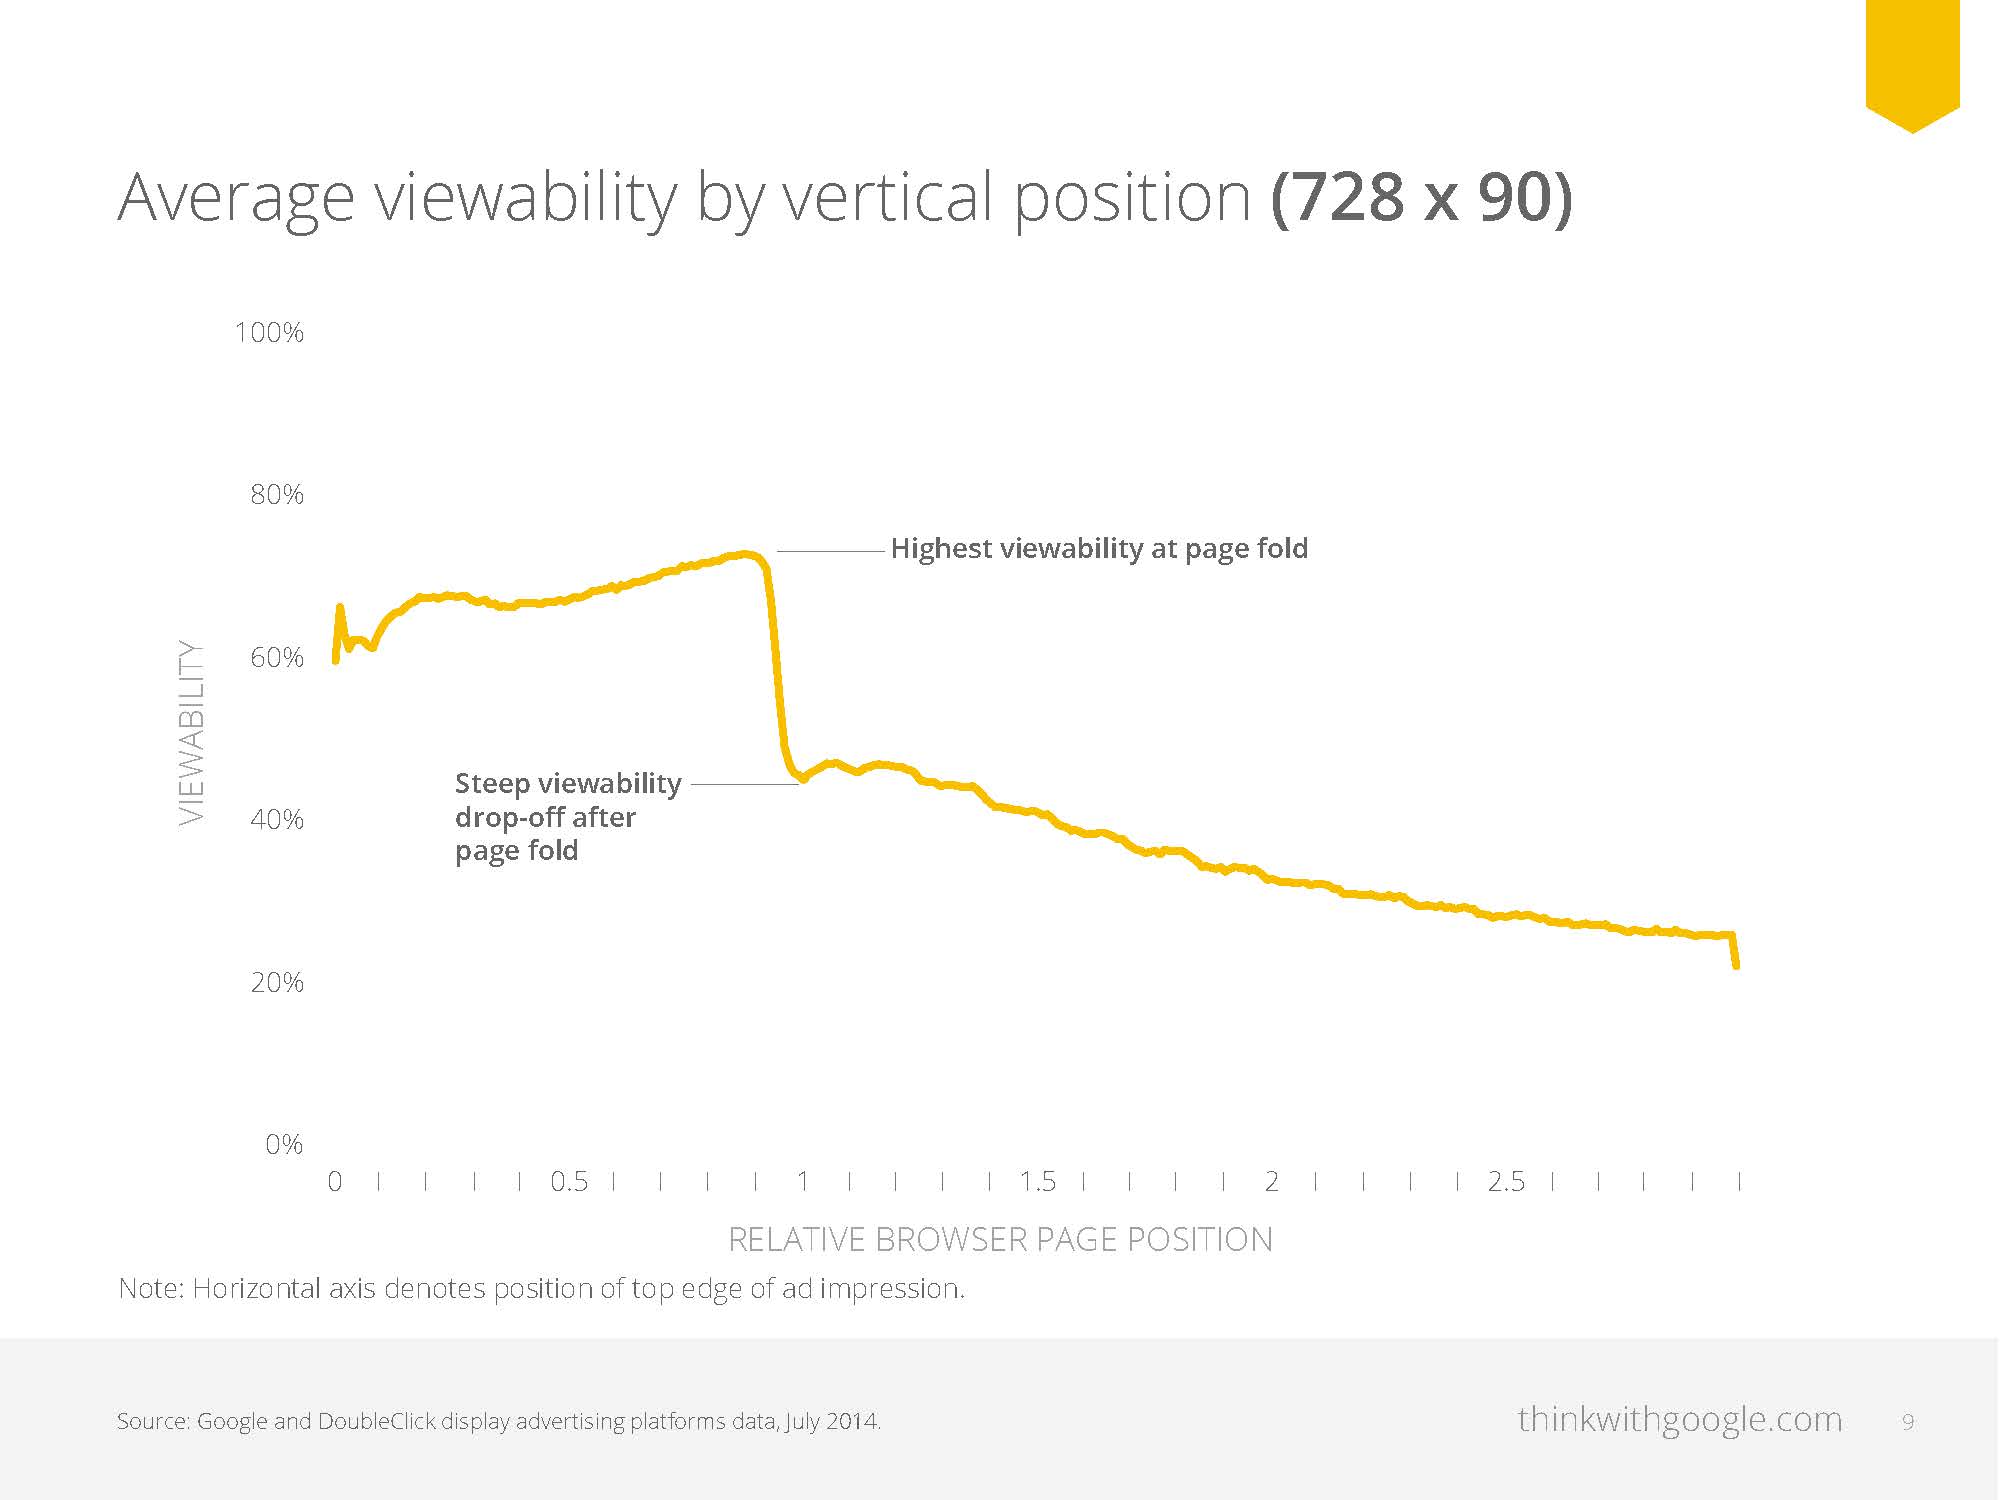
Here’s a behavioral statistic that should be a little disconcerting to marketers:  Only about one in four readers scroll down on sponsored content (native advertising) on publisher websites.

Compare that to ~70% of those same readers who scroll down on other types of news content.

That’s what the chief executive officer of Chartbeat, a developer and purveyor of real-time web analytics software for media publishers, has contended, leading others to try to probe these attitudes further and try to find out more about the dynamics that are at work.

One such effort is online field research conducted this past summer by Contently, a freelance writing services clearinghouse.  It discovered that the difference in engagement levels relates to “trust.”

Generally speaking, readers trust sponsored content a whole lot less than they do “normal” content.

More specifically, here’s what Contently’s research, which targeted ~550 U.S. adults ages 18 to 65, found in terms of trust attitudes:

  • I generally don’t trust sponsored content: ~54%
  • I trust the content only if I trust the brand already: ~22%
  • I trust the content only if I trust the publication: ~19%
  • I generally trust sponsored content:  ~5%

It gets even murkier when we consider that not all readers agree on the same definition of “sponsored content.”

While the largest proportion of people consider “sponsored content” on a news website to be an article that an advertiser paid to be created as well as had input into its content, it was only a plurality of respondents:

  •  A sponsor paid and influenced the article: ~48%
  • A news site wrote it, but a sponsor paid money for it to run: ~20%
  • A sponsor paid for its name to appear next to news content: ~18%
  • A sponsor wrote the article:  ~13%

And here’s a real kick in the gut:  More people in the Contently survey would rather be served “bad ol’ banner ads” than encounter sponsored news and other posts:

  • Would rather see banner ads:  ~57% of respondents
  • Prefer sponsored posts because banner ads are annoying: ~26%
  • Prefer sponsored posts because they’re more interesting than banner ads: ~18%

The findings aren’t much different based on the age or education levels of respondents, either.

If anything, more highly educated people (those with graduate degrees) are most likely to prefer banner ads over sponsored posts.  The reason boils down to concern over the issue of deception:  A large majority of respondents reported that they have ever “felt deceived” upon realizing an article was actually sponsored by an advertiser.

Considering the disapproving numbers collected in the survey, it’s not surprising that Contently also found that respondents are far prone to click on a piece of sponsored content compared to other content:

  • Less likely to click on sponsored content: ~66%
  • More likely: ~1%
  • Equally likely: ~33%

credible sourceLastly, publishers should take note that their credibility is being diminished in the eyes of many, based on the practice of publishing native advertising.  The Contently survey found that nearly 60% expressed the view that publishers lose credibility when they run such sponsored content.

Of course, native advertising and sponsored content isn’t going to go away.  It’s too wrapped up in today’s business models for successful publishing and successful brand engagement.

But it’s clear that publishers, advertisers and the brands they represent have a bigger hurdle to clear in order for their content to be considered worthy of their readers’ attention and engagement.

American are a giving people … but so are many others.

Giving during the holidaysComing off of Thanksgiving Day and heading into the remaining holidays of the year, with their emphasis on “giving,” it’s tempting for we Americans to think of ourselves as a generous people.

Which we are.  The latest comparative analysis proves the point.

In fact, America is tied with one other country as the most generous in the world.

And that other country is … wait for it … Myanmar.

That is correct:  the United States and Myanmar (Burma) each scored a 64% generosity rating in the recently published World Giving Index.  The two nations were followed closely by Canada, Ireland, New Zealand and Australia.

The World Giving Index is actually an aggregated figure, calculated based on three kinds of giving:

  • Volunteering of time
  • Donating money
  • Helping a stranger

World Giving IndexData was collected in field research carried out across more than 140 countries via Gallup’s World View World Poll, then compiled by international research firm CAF-America for creating the World Giving Index based interview questions that measured the behaviors of people during the 30-day period prior to interviewing.

A sampling of adults in each of the countries was interviewed, with the percentages of people participating in each of the three behavioral attributes collected.  The scores were amalgamated to determine the overall index score per country.

How did the United States achieve its first-place tie?  It ranked #1 among all surveyed countries in helping a stranger (a participation score of 79%) … #5 in volunteering of time (a score of 44%) … and #9 in donating money (a score of 68%).

Myanmar’s route to the shared top spot was different:  It ranked #1 for donating money (a participation score of 91%) … #2 for volunteering time (a score of 51%), but only #49 for helping a stranger (a score of 49%).

2014 World Giving Index Heat Map by CAF
This 2014 World Giving Index “heat map” shows which nations are the most generous. (Gallup survey data amalgamated by CAF.)

For the record, here’s how the Top 10 countries fared in terms of their overall World Giving Index scores:

  • #1 (tie) USA:  64% World Giving Index score
  • #1 (tie) Myanmar:  64%
  • #3 (tie) Canada:  60%
  • #3 (tie) Ireland:  60%
  • #5 New Zealand:  58%
  • #6 Australia:  56%
  • #7 (tie) Malaysia:  55%
  • #7 (tie) United Kingdom:  55%
  • #9 (tie) Sri Lanka:  54%
  • #9 (tie) Trinidad & Tobago:  54%

Looking at the Top 10 list – and also at where the other countries surveyed fell further down the roster – it appears that living in a prosperous economy doesn’t necessarily translate into being more charitable.

If that were the case, we’d see the G20 economies making up the top tier — which they don’t.

“Aspiring” economies also don’t show up particularly well, either.  The so-called BRIC nations (Brazil, Russia, India and China) are nowhere to be found in the Top 10 ranking.

The MINT nations (Mexico, Indonesia, Nigeria and Turkey) are no-shows, too.

Myanmar poses a very interesting case.  It’s 91% rating of people giving money reflects a practice of charitable giving (daana) that is a centerpiece tenets of religious observance amongst the Theravada Buddhists that thrive in the country.

And in the United States, charitable giving participation rates have grown significantly in the years since the Great Recession, so that today about two-thirds of adults reported donating money within 30 days of when they were interviewed.

For more details on the comparative study and the world rankings, click here.

It’s Official: Cyber Monday 2014 was the Biggest e-Commerce Day in U.S. History

Cyber Monday ShoppingIn the days following Black Friday this year, we heard reports that consumer purchase volumes at stores were down more than 10% compared to 2013.

A number of explanations for the decline were given, among them the notion that Black Friday sales are less of a draw this year, since merchandise sales now begin before Thanksgiving and tend to run the entire month of December.

But some observers speculated as to whether soft Black Friday revenue figures presage an equally soft holiday shopping season overall.

Well … now that we have sales figures from Cyber Monday (the Monday following Black Friday weekend), I think it’s safe to say that any concerns about a tepid holiday buying season are unfounded.

Custora E-Commerce Pulse, a customer relationship management firm which tracked more than 100 million online shoppers and over $40 billion in e-commerce revenue over the full Thanksgiving Holiday weekend, has just reported that Cyber Monday e-commerce revenues were up over 15% compared with Cyber Monday 2013.

That makes Cyber Monday 2014 the single biggest day in U.S. online shopping ever in history.

Other days of the Thanksgiving weekend also showed robust gains in online shopping:  Black Friday online sales were up ~21% over 2013, and online shopping on Thanksgiving Day itself were up nearly 18% over Thanksgiving Day in 2013.

The strong growth was fueled by mobile shopping, e-mail marketing, plus online product searches on Google and other search engines.

In particular, mobile shopping accounted for ~22% of orders on Cyber Monday, significantly higher than the ~16% of orders recorded last year.

On Black Friday itself, mobile shopping accounted for around 30% of all orders — yet another dramatic increase over 2013 when mobile shopping account for just shy of 23% of orders.

This year’s Cyber Monday stats put the lie to the notion that e-mail marketing is losing its luster.  In fact, e-mail marketing drove nearly one in four online shopping orders, outstripping natural search (at ~19% of all orders) and paid search (~16% of orders).

Much ado about (practically) nothing: Social media and Cyber Monday.

And guess which channels weren’t a meaningful part of the holiday shopping experience this year?

If you guessed social media … you’re absolutely correct.

Taken together, Facebook, Twitter, Pinterest and Instagram accounted for only about 1.5% of online e-commerce orders on Cyber Monday.  (For the weekend as a whole, it was only slightly better at ~1.7%.)

This year’s statistics just add more confirmation of several truisms about online consumer marketing:

  • Targeted e-mail still works the best.
  • Online search is important.
  • Social media is like Lucy and the football.

Google Comes Clean on Ad Viewability (or Non-Viewability?)

clear view or no clear viewThere have been quite a few reports in recent times pointing to the lack of viewability of online display advertising, and I’ve blogged about this topic before.

And now, we have the $55-billion “advertising vacuum-cleaner company” Google itself admitting as much.

It comes in a study that Google has just released.  The report presents findings from its analysis of display ad programs using its “active view” technology (like DoubleClick) to determine which factors are affecting the viewability of ads.

The results aren’t pretty; more on that below.

But first … why is Google doing this?

I suspect it’s because more advertisers are now insisting on paying only for their ads that have been actually viewed, as compared to those simply served.

Now, to what Google is reporting.  It turns out that fewer than half of all ad impressions served on Google’s display platforms are ever seen, because they’re served outside of the viewer’s browser window.

That is correct:  A huge chunk of Google’s billions in ad revenues that it collects come from ads that no one ever saw.

What digital advertising platforms love to remind us is that their programs are superior to “bad old television and radio advertising” because of their sophisticated targeting capabilities and their superior measurement metrics.

That may be.  But how is it all that different for TV viewers to miss an ad because they took a kitchen or bathroom break, compared to people who never even had the opportunity to see an ad that was “served” in a dead zone?

The next question is, “What can advertisers do to help minimize the incidence of phantom online advertising?”

Helpfully, Google provides some clues in its report.  For instance, the highest viewability for ads is immediately above the “fold” – in other words, at the point where the viewer must begin to scroll down to see the rest of the page.

Surprisingly, viewability right above the fold is slightly higher than at the very top of the page.  But it’s massively less so just below that magic spot.  Google pressented five charts in its report to illustrate this drop-off phenomenon; the one reproduced below shows viewability of vertical position ads sized 728 x 90 pixels:

Average viewability by vertical position on online ads


Less surprising, perhaps, is the fact that vertical ads have higher viewability than horizontal or block ads, for the simple reason that they stay on the page longer:

Most viewable online display ad sizes


By publishing this data, Google purports to want to help their advertisers understand high- and low-value inventory better so they can target their campaigns more appropriately and effectively.

Google is also encouraging publishers to strive for delivering viewability rates in excess of 50% by offering ad inventory that will perform more effectively in its respective positions.

My only question is … why has it taken Google so long to set these standards and to publicize them in the first instance?

Sure, Google’s only the middleman between publishers and their viewers.  But it’s a pivotally important one.

Americans Still Love Their Libraries

local libraryI’m trying to remember the last time I visited our local library in our town.  It was more than a year ago … and it was to attend a community meeting, not to check out a book or use the reference materials.

For me at least, access to the Internet at work, at home and on mobile devices has made the library pretty much irrelevant to my daily life.

It wasn’t always that way.

There was a time — not so many years ago — when I went to the library on a weekly basis.  I even traveled to other cities to do business-oriented research in larger libraries that were the designated repositories of U.S. Census Bureau, Department of Commerce and other government publications.

So based on my personal evolution, I was a bit surprised to read the results of a recent Harris Poll that surveyed ~2,300 Americans aged 18 or older on the topic of libraries and their role in people’s lives.

Harris found that ~64% of the respondents it surveyed have a library card — a statistic that is higher than I thought it would be.

[Granted, that library card figure has declined from the ~68% level that was reported by respondents in a similar survey conducted by Harris in 2008.]

The Harris research also found that women are more likely to use the local library than men.  Related to this, more than 70% of women in the survey possess a library card, compared to only ~57% of men.

Children may be a factor in how strong a relationship adults have with their local library, since adults who have children are significantly more likely to patronize the library — and more often as well.

For those who have library cards, nearly 80% reported that they’ve used the library at least once in the past year.  Indeed, more than one-third use the library on a monthly basis or more frequently.

Most library-related activity appears to be for traditional uses:

  • Borrowing books: ~56% identify as the “top reason” for going to the library
  • Borrowing DVDs/videos: ~24%
  • Consuming digital content: ~15%
  • Attending kids/community programs: ~5%

A Community and Education Resource …

library meeting roomRegardless of their own personal library usage patterns, more than nine in ten respondents in the Harris survey consider libraries to be a valuable education resource for their local community.

Nearly as many consider the library to be an important community center and meeting space.

Based on the Harris results, the role of libraries may be evolving more slowly than I would have thought.  And they still play a central role in the nourishment of their communities.

What about you?  How are you using (or not using) your local library these days?  Please share your experiences with other readers here.

Company and brand positioning statements: Some laudable … some lousy … many just lame.

Positioning: The Battle for your Mind Al RiesAbout 15 years ago a book was published titled Positioning:  The Battle for Your Mind, authored by Al Ries and Jack Trout.

Although the examples cited by the writers are a little outdated by now, the book remains an important contribution to the literature on the subject of brand positioning and what it takes for a company to build, strengthen and protect it.

Unfortunately, too few companies are paying heed to some of the basic tenets of proper positioning.

Indeed, based on the way many businesses approach their positioning — and the typical positioning statements one encounters — it seems less like a battle for someone’s mind and an exercise in mind-numbing irrelevance, instead.

Here’s a positioning statement I came across recently, from a firm my own industry (MarComm).  I’m shielding the name of the company to be charitable.  But tell me if this isn’t just dreadful:

“[Company X] is a creative marketing communications firm that delivers fresh ideas and authentic solutions that drive measurable business results. 

Our strategic, problem-solving approach generates marketing and communications programs that increase brand awareness, improve sales productivity, increase marketing response, drive revenues and support business goals. 

We plan and implement creative solutions that leverage our clear insight, strategic business skills, team building, proven process, distinctive design and measurement methodology.

… and so on.  (It continues for another two paragraphs.)

The big problem is that there’s little being said that’s either informative or differentiating.

Worse yet, enveloping a wholly indistinctive positioning statement with a bunch of forgettable adjectives, mealy-mouthed platitudes and other “weasel words” just makes things worse.

To my view, when it comes to company positioning, directness and simplicity is always the better route.

For starters, go for facts.  If a company offers what many others also do, that’s no indictment of the business.  It’s fruitless to try to communicate “uniqueness” where there is none, because people won’t be fooled for long anyway.

brand positioningCut the “marketing buzz-speak,” too.  People hear those overused terms as mere noise.  And noise is irritating.

If there is demonstrated singular competence in one or more areas, it’s OK to tout that, of course.  But throttle back on the hype and leave it to the audience to draw its own conclusions.

Speaking personally, when I read a company’s positioning statement, I’m looking for the quintessential “elevator speech” that covers the “Five Ws” as succinctly as possible.

And spare the marketing fluff, please.

More than anything, going beyond “just the facts” is insulting to the readers’ intelligence.  If they want to learn more, they’ll do it on their own terms, thank you very much.

Do you know of any company positioning statements that are particularly effective?  If so, please share them here.  (On the other hand, if the ones you know are dreadful, perhaps keep those ones to yourself!)

A Bombshell Forrester Finding? Brands are Wasting Time and Money on Facebook and Twitter

Forrester logo

This past week, marketing research firm Forrester published a new analytical report titled “Social Relationship Strategies that Work.”

The bottom-line conclusion of this report is that brand marketers are generally wasting their time and money focusing on social platforms that don’t provide either the extensive reach or the proper context for valuable interactions with customers and prospects.

In particular, Forrester’s research has determined that Facebook and Twitter posts from top brands are reaching only about 2% of their followers.

Engagement is far worse than even that:  A miniscule 0.07% of followers are actually interacting with those posts.

Much has been made of Facebook’s recent decision to reduce free-traffic posts on newsfeeds in favor of promoted (paid) posts.  But Forrester’s figures suggest that the lack of engagement on social platforms is about far more than just the reduction in non-promoted posts.

Nate Elliott Forrester
Nate Elliott

Nate Elliott, a Forrester vice president and principal analyst, believes that brand managers need to make major changes in how they’re going about marketing in the social sphere.  He notes:

“It’s clear that Facebook and Twitter don’t offer the relationships that marketing leaders crave.  Yet most brands still use these sites as the centerpiece of their social efforts, thereby wasting significant financial, technological and human resources on social networks that don’t deliver value.”

With Twitter and Facebook being such spectacular duds when it comes to social platforms, what does Forrester recommend that brand marketers do instead?

One option is to develop proprietary “branded communities” where fans can hang out in zones where brands can be their own traffic cops, instead of relying on a giant social platform to do the work (or not do the work) for them.

e-mailEven better is to return to greater reliance on an old standby tactic: e-mail marketing.

If this seems like “back to the future,” Forrester’s Elliott reminds us how e-mail can work quite elegantly as the centerpiece of a brand’s social marketing effort:

“Your e-mails get delivered more than 90% of the time, while your Facebook posts get delivered 2% of the time — and no one’s looking over your shoulder telling you what you can and can’t say in your e-mails.  If you have to choose between adding a subscriber to your e-mail list and gaining a new Facebook fan, go for e-mail every time.”

I can’t say that I disagree with Nate Elliott’s position.

Now it’s time to hear from the rest of you marketing professionals.  How successful have you been in building engagement on social platforms like Twitter, Facebook and LinkedIn?  Have your efforts in social paid off as well as in your e-mail marketing initiatives?  Let us know.

Misusing Marketing Research: There’s a Saying for That

How to Lie with Statistics by Darrell Huff (1954)
How to Lie with Statistics, Darrell Huff’s business classic, first published in 1954.

Personally, I have respect for marketing research as a discipline.  I think most business decisions are better when they’re backed by the power of marketing research.

Still, I recognize that research can also be used in misleading or otherwise improper ways.

Even worse, research results can be contorted to justify business decisions that have been predetermined.  All too often, “How can we produce results that justify our position?” is the impetus behind a research initiative.

It’s that “dirty little secret” of research that was brought to light decades ago in Darrell Huff’s business classic, How to Lie with Statistics.  First published in 1954, this book been published in countless editions and remains in print even today, 60 years later.

Quirk's Marketing Research ReviewRecently, Dan Quirk of Quirk’s Marketing Research Review, the American research industry’s leading practicum publication, asked subscribers to share their favorite research-related quotes — ones that point to the folly that can be part of the discipline at times.

Some of the reader contributions are great — and they certainly point to the downsides of the research field.  Consider these bon mots:

“Science is built of facts the way a house is built of bricks … but an accumulation of facts is no more science than a pile of bricks is a house.”  (attributed to Henri Poincaré)

“Don’t let the facts get in the way of the truth.”

“When research walks on the field, judgment does not walk off.”  (attributed to Richard Kampe)

“Don’t theorize before one has data:  One begins to twist facts to suit theories, instead of theories to suit facts.”  (attributed to Sir Arthur Conan Doyle)

“Precise forecasts masquerade as accurate ones.”  (attributed to Nate Silver)

“If you torture a data set long enough … it will confess.”

“There are three kinds of lies: lies, damned lies, and statistics.”  (attributed to Mark Twain)

“Statistics can be misleading; the average human has one breast and one testicle.”

“A little nonsense now and then is relished by the wisest men. (attributed to Roald Dahl)

And this one, which ties everything up in a neat little bow:  “No research is better than bad research.”

If you have other memorable research quotes to add to the list, please share them with other readers here.  It’ll be good for a chuckle at least!

America’s Smallest Businesses Get Hands-On with Digital Marketing

DIYAs more MarComm activities increasingly migrate to the web and to social media platforms, small businesses are increasingly taking a DIY approach in their marketing programs.

That’s the major takeaway from a survey of nearly 2,600 small business owners conducted by Insight By Design for Webs, a subsidiary of Vistaprint.

For purposes of the study, small businesses were defined as those having 10 or fewer employees.  The results of the field survey, which was conducted in the spring of 2014, were published in Vistaprint’s 2014 Digital Usage Study.

vistaprint-logoTwo-thirds of the small business respondents reported that they are actively using digital products to market their businesses.  Of those who have websites for their business, nearly 60% of them created their own websites using DIY tools.

An even larger proportion — 80% — act as their own webmasters.

Small businesses consider customer acquisition and generating new customer leads as the most important reasons for maintaining a web presence.

In the social media realm, Facebook is the most popular platform for promoting small businesses — so said nearly 90% of the survey respondents who are active in social media marketing.

Facebook is viewed as not only a vehicle for building brand awareness and acquiring new customers, but also for building a network of followers and engaging with them over time.

The survey’s respondents reported that all of the other major social platforms lag far behind Facebook in importance:

  • Facebook: ~88% consider it to be a highly important social media channel for their business
  • LinkedIn: ~39%
  • Twitter: ~31%
  • Google+: ~22%
  • Pinterest: ~20%
  • YouTube: ~17%

In line with its perceived importance as a marketing channel, about two-thirds of businesses that have Facebook business profiles are also engaged with paid advertising campaigns on the social platform — or are considering doing so.

No question, small businesses have concluded that social media marketing is the best way for them to create brand awareness and expand their reach in a very low-cost yet effective manner.  So don’t look for any slowdown in the adoption of social strategies going forward.

The Quiet Revolution in Automotive Advertising

New Car ShowroomA new milestone is set to be reached in 2014.  For the first time, digital advertising will represent over half of all ad spending in the U.S. automotive sector.

That means that TV, radio, outdoor, newspaper and other print advertising, taken together, will represent only a minority of the roughly $36 billion advertising industry, the second largest advertising category in the United States (behind general merchandise stores).

This is great news for all of us who have suffered through high-decibel radio advertising, TV ads with sophomoric production values, and “carnival barking” poster-like print ads that have been so ubiquitous in the automotive category for so many decades.

A just-released report from media research company Borrell Associates, titled 2014-2015 Automotive Advertising Outlook, notes the following key factors that have influenced the “drive towards digital” in the automotive advertising category:

•     Over the past decade, the number of franchise auto dealers has dropped by ~3,500 (18%), even as the number of new vehicles sold per dealer has grown by ~18%. Fewer-and-larger dealerships reduce marketplace clutter and the clamor for audience attention.

•     Also contributing to reduced clutter, six major car brands have disappeared from the market over the past 10 years: Hummer, Mercury, Plymouth, Pontiac, Oldsmobile and Saturn.

•    The per-vehicle cost of advertising for a new car has declined ~20%.  No it’s only about $500.

•     More than 90% of auto purchases begin with consumer online research. This change in behavior has transformed auto dealerships from acting like showrooms to being more like fulfillment centers.

•     As their “media channel,” dealerships are able to use the Internet to offer special customer deals in the form of rebates, incentives and loyalty programs. These marketing schemes now amount to ~$2,400 per vehicle sold — dwarfing the amount spent on advertising.

Automotive print advertising is declining -- thankfully.
The end of an era? Thankfully, yes.

Thanks to these major trends and developments, we’re now spared the volume and intensity of intrusive automotive advertising that was so common before.

Instead, car dealerships are ready and waiting for us when we’re in the market to purchase a new automobile by using online ads, search engine marketing, social media and other digital platforms to be easily accessible and available when we go online.

According to Borrell, nearly $300 per vehicle will be spent on online advertising this year, whereas just a little over $200 will be spent on traditional advertising.

Five years ago, online ad spending was about one third the amount of traditional advertising.

The information-rich web is also changing another aspect of the car buying experience:  It’s making the job of automotive sales easier rather than more difficult.

Here’s proof:  Only a few years ago, more than half of all car shoppers would end up not buying a vehicle.  Today, that proportion has now dropped to just 25%.

When customers come into the showroom today, they’re better informed, they know what they want to purchase, and they’re up on various the options and pricing deals.  In short, they’re ready to buy.

Fewer intrusive ads … better educated consumers … less stress on sales personnel … satisfied buyers.  It seems like a win-win for everyone, doesn’t it?