… and it means “Keep It Short, Stupid” as much as it does “Keep It Simple, Stupid.”
Regardless of the era, most successful copywriters and ad specialists have always known that short copy is generally better-read than long.
And now, as smaller screens essentially take over the digital world, the days of copious copy flowing across a generous preview pane area are gone.
More fundamentally, people don’t have the screen size – let along the patience – to wade through long copy. These days, the “sweet spot” in copy runs between 50 and 150 words.
Speaking of which … when it comes to e-mail subject lines, the ideal length keeps getting shorter and shorter. Research performed by SendGrid suggests that it’s now down to an average length of about seven words for the subject line.
And the subject lines that get the best engagement levels are a mere three or four words.
So it’s KISS on steroids: keeping it short as well as simple.
Note: The article copy above comes in at under 150 words …!
With each passing day, we see more evidence that Twitter has become the social media platform that’s in the biggest trouble today.
The news is replete with articles about how some people are signing off from Twitter, having “had it” with the politicization of the platform. (To be fair, that’s a knock on Facebook as well these days.)
Then there are reports of how Twitter has stumbled in its efforts to monetize the platform, with advertising strategies that have failed to generate the kind of growth to match the company’s optimistic forecasts. That bit of bad news has hurt Twitter’s share price pretty significantly.
And now, courtesy of a new analysis published by researchers at Indiana University and the University of Southern California, comes word that Twitter is delivering misleading analytics on audience “true engagement” with tweets. The information is contained in a peer-reviewed article titled Online Human-Bot Interactions: Detection, Estimation and Characterization.
That sort of news can’t be good for a platform that is struggling to elevate its user base in the face of growing competition.
But it’s even more troubling for marketers who rely on Twitter’s engagement data to determine the effectiveness of their campaigns. How can they evaluate social media marketing performance if the engagement data is artificially inflated?
Fifteen percent of all accounts may seem like a rather small proportion, but in the case of Twitter that represents nearly 50 million accounts.
To add insult to injury, the report notes that even the 15% figure is likely too low, because more sophisticated and complex bots could have appeared as a “humans” in the researchers’ analytical model, even if they aren’t.
There’s actually an upside to social media bots – examples being automatic alerts of natural disasters or customer service responses. But there’s also growing evidence of nefarious applications abounding.
Here’s one that’s unsurprising even if irritating: bots that emulate human behavior to manufacture “faux” grassroots political support. But what about the delivery of dangerous or inciting propaganda thanks to bot “armies”? That’s more alarming.
The latest Twitter-bot news is more confirmation of the deep challenges faced by this particular social media platform. What’s next, I wonder?
In the world of business-to-business marketing, all that really matters is producing a constant flow of quality sales leads. According to Clickback CEO Kyle Tkachuk, three-fourths of B-to-B marketers cite their most significant objective as lead generation. Pretty much everything else pales in significance.
This is why content marketing is such an important aspect of commercial marketing campaigns. Customers in the commercial world are always on the lookout for information and insights to help them solve the variety of challenges they face on the manufacturing line, in their product development, quality assurance, customer service and any number of other critical functions.
Suppliers and brands that offer a steady diet of valuable and actionable information are often the ones that end up on a customer’s “short-list” of suppliers when the need to make a purchase finally rolls around.
Thus, the role of content marketers continues to grow – along with the pressures on them to deliver high-quality, targeted leads to their sales forces.
The problem is … a large number of content marketers aren’t all that confident about the effectiveness of their campaigns.
It’s a key takeaway finding from a survey conducted for content marketing software provider SnapApp by research firm Demand Gen. The survey was conducted during the summer and fall of 2016 and published recently in SnapApp’s Campaign Confidence Gap report.
The survey revealed that more than 80% of the content marketers queried reported being just “somewhat” or “not very” confident regarding the effectiveness of their campaigns.
Among the concerns voiced by these content marketers is that the B-to-B audience is becoming less enamored of white papers and other static, lead-gated PDF documents to generate leads.
And yet, those are precisely the vehicles that continue to be used most often used to deliver informational content.
According to the survey respondents, B-to-B customers not only expect to be given content that is relevant, they’re also less tolerant of resources that fail to speak to their specific areas of interest.
For this reason, one-third of the content managers surveyed reported that they are struggling to come up with effective calls-to-action that capture attention, interest and action instead of being just “noise.”
The inevitable conclusion is that traditional B-to-B marketing strategies and similar “seller-centric” tactics have become stale for buyers.
Some content marketers are attempting to move beyond these conventional approaches and embrace more “content-enabled” campaigns that can address interest points based on a customer’s specific need and facilitate engagement accordingly.
Where such tactics have been attempted, content marketers report somewhat improved results, including more open-rate activity and an in increase in clickthrough rates.
However, the degree of improvement doesn’t appear to be all that impressive. Only about half of the survey respondents reported experiencing improved open rates. Also, two-thirds reported experiencing an increase in clickthrough rates – but only by 5% or less.
Those aren’t exactly eye-popping improvements.
But here’s the thing: Engagement levels with traditional “static” content marketing vehicles are likely to actually decline … so if content-enabled campaigns can arrest the drop-off and even notch improvements in audience engagement, that’s at least something.
Among the tactics content marketers consider for their creating more robust content-enabled campaigns are:
Video
Surveys
Interactive infographics
ROI calculators
Assessments/audits
The hope is that these and other tools will increase customer engagement, allow customers to “self-quality,” and generate better-quality leads that are a few steps closer to an actual sale.
If all goes well, these content-enabled campaigns will also collect data that helps sales personnel accelerate the entire process.
One of the nice things about the proliferation on online surveys in recent years is that, over time, we’ve come to understand survey response dynamics much better.
Of course, predicting response rates with flawless precision is impossible due to the individual attributes of each individual survey, the sample composition and so forth. But thanks to a 2015 compilation of “bottom-line” information by content marketing specialist Andrea Fryrear, the following points are good ones for marketing personnel undertaking market survey work.
Surveys aimed at “internal audiences” outperform external ones.
Targeting an internal audience such as a company’s own employee base is likely going to generate higher response rates (in the neighborhood of 35% to 40%, give or take). For surveys of an external audience, it’s more like 10% or perhaps even lower.
The reason is simple: Surveys aimed at internal audiences are likely very-well targeted, whereas with an external audience, often it’s difficult to reach only the right type of respondents. At least some of them will turn out to be poor targets.
Additional motivating factors.
Other factors that can influence survey response rates include:
Customer loyalty – People who feel a connection with the brand conducting a survey tend to be more likely to participate.
Brand recognition – Surveys that focus on well-known brands will typically outperform ones from an unknown source or dealing with unfamiliar brands.
Perceived benefit – The “WIIFM” factor. For example, response rates can soar even higher if the respondent population is motivated by serious incentives. I recall getting more than a 60% response rate on a mail survey and an external sample because the monetary incentive was a $2 bill.
Demographics – The reality is that certain segments of the population are more likely to respond to surveys than others. Think everything from age and gender to ethnicity and geographic location.
Survey distribution – Certain audiences are used to interacting on social media … others online … still others offline. Chances are, you already know which type of research targets those are within your target markets, and it should influence your choice of survey delivery.
Survey length can make or break your response and completion rates.
To achieve the highest response rates, ideally surveys should take five minutes or less to complete. Ten minutes or less is probably OK, too. But anything longer than that will likely have deleterious effect on your response rate.
How many questions does this mean? On average, respondents can complete five closed-ended questions in a minutes’ time … but only two open-ended ones.
Survey reminders? Yes.
Particularly with online surveys, it’s a good idea to send reminder notices to those who haven’t completed surveys as you get closer to the cut-off date. Sending two or three reminders is a good rule of thumb … and try sending them at different times of the day or different days of the week to that you can reach as many different prospective respondents as possible.
Learning from the experience of the thousands of surveys administered every month should make it easier for marketers to ensure their next survey will generate successful results instead of flame out. There’s really no reason for failure considering the wealth of “experiential information” that’s out there.
When business results look disappointing, one can certainly sympathize with the efforts of company management to explain it away in the most innocuous of terms.
This may be what’s behind Twitter CEO Jack Dorsey’s description of his company’s 2016 performance as “transformative” – whatever that means.
Falling short of industry analysts’ forecasts yet again, Twitter experienced a revenue increase of only about 1% year-over-year during 2016.
Monthly active users didn’t look much better either, with the total number barely budging.
While I have no actual proof, one explanation of tepid active user growth may be that Twitter became the de facto “place for politics” in the 2016 U.S. Presidential election — which didn’t actually end in November and continues apace even today.
Simply put, for many people, politics isn’t their cup of tea — certainly not on a 24/7/365 diet, ad nauseum.
Quite telling, too, was the fact that advertising revenue showed an absolute decline during the 4th Quarter, dropping below $640 million for the period.
Even more disturbing for investors, the company’s explanation about the steps Twitter is taking to address its performance shortfalls smacks of vacuousness, to wit this statement from CEO Dorsey:
“While revenue growth continues to lag audience growth, we are applying the same focused approach that drove audience growth to our revenue product portfolio, focusing on our strengths and the real-time nature of our service.”
“This will take time, but we’re moving fast to show results,” Dorsey continued, rather unconvincingly.
One bright spot in the otherwise disappointing company results is that revenues from international operations – about 39% of total overall revenues – climbed ~12% during the year, as compared to a ~5% revenue drop domestically.
Overall however, industry watchers are predicting more in the way of bad rather than good news in 2017. Principal analyst Debra Aho Williamson at digital media market research firm eMarketer put it this way:
“Twitter is losing traction fast. It is starting to shed once-promising products such as Vine, and [to] sell off parts of its business such as its Fabric app development platform. At the same time, some surveys indicate that Twitter is becoming less integral to advertisers’ spending plans. That doesn’t bode well for future ad revenue growth.”
With a prognosis like that, can the next big drop in Twitter’s share price be far behind?
America’s department store chains – and anchor stores at countless shopping malls across the country – are reporting another rounds of disappointing sales and profit figures following the 2016 holiday season.
It underscores what we’ve been seeing all over the country – dead or dying malls.
In fact, retail industry analyst Jan Rogers Kniffen predicts that about one-third of malls in the United States will shut their doors in the coming years.
That’s about 400 of the ~1,100 enclosed malls.
Equally startling, of the ~700 that remain, all but around 250 are expected to continue to struggle.
The problem is multi-faceted. At an estimated 48 sq. ft. of retail space for every man, woman and child in America, that’s a footprint that gotten too big.
“On an apples-to-apples basis, we have twice as much per-capita retail space than any other place in the world,” Kniffen says, adding that the United States is “the most over-stored” country anywhere.
The oversupply of retail space is challenged by changing customer tastes, too. Online shopping is a huge problem for malls, as is the rising popularity of off-price stores in lieu of the department stores like Macy’s and Penneys that have served as important anchors for mall properties all over the country.
Now we hear reports that Macy’s is planning to close numerous store locations during 2017, joining Sears and Penneys which have been doing the same thing over the past several years.
Mall of America (Bloomington, MN): Expansion Rendering
Entertainment – Even in the age of “interactive everything,” consumers – particularly younger ones – continue to seek out gathering places and “experiences.” It’s one reason why some shopping malls have had to deal with large numbers of young people flooding their spaces – not always with pleasant results. Malls seeking out tenants that provide entertainment hubs — such as theme parks and gaming parlors, edutainment, and even virtual-reality content and immersive experiences — will be able to draw customers from a wider geographic area who crave social interaction.
Food and drink – “Food is the new fashion,” some people like to say. Successful malls are getting in on that action, incorporating popular dining options along with unique ones as a way of becoming destination locations.
Retail – Still a core aspect of malls, but with new twists, such as creating retail centers that are also learning zones that bring together consumers, retailers and entertainment. McKinsey uses the example of a sporting goods store that also includes a fitness studio, or offline showrooms for online retail players. More reconfigurable spaces that can be used for pop-up stores, special product launches and seasonal offerings are also options with potential.
Transportation – Getting to and from mall properties with ease is growing in importance, and where some creative thinking might go a way towards making some malls more attractive than others.
Technology – The more that malls can create a “seamless chain” between online and on-site shopping, the better their chances are for staying relevant in the new retail environment. McKinsey posits a number of initiatives, such as creating “virtu-real” formats that provide consumers with a more interactive retail experience through the use of touchscreen navigation portals, virtual fitting rooms, allowing smartphones for e-checkouts, and click-and-collect services to help blend the offline and online shopping experience.
In sum, for shopping malls it means fundamentally rethinking their role — and then adapting their strengths to those of the virtual/interactive world.
If we check back in another five years or so, we should have a pretty good idea which tactics have been successful – and which mall properties, too.
Hopefully, the shopping mall closest to your home won’t look like the one at the top of this article.
In today’s world of marketing, it’s been obvious for some time that the pace of technological change is dramatically shortening the life cycle of marketing techniques.
Consider online search. Twenty-five years ago it was hardly a blip on the radar screen. Picking up momentum, paid search soon began to rival traditional forms of advertising, as companies took advantage of promo programs offered by Google and others that aligned neatly with consumers when they were on the hunt for products, services and solutions..
Google has attracted billions upon billions of dollars in search advertising revenue, becoming one of the biggest corporations in the world, even as entire industries have grown up around optimizing companies’ website presence and relevance so as to rank highly in search query results.
And now, thanks to continuing technology evolution and the emergence of the Internet of Things, the next generation of search is now upon us – and it’s looking likely to make keyboards and touchscreens increasingly irrelevant within a few short years.
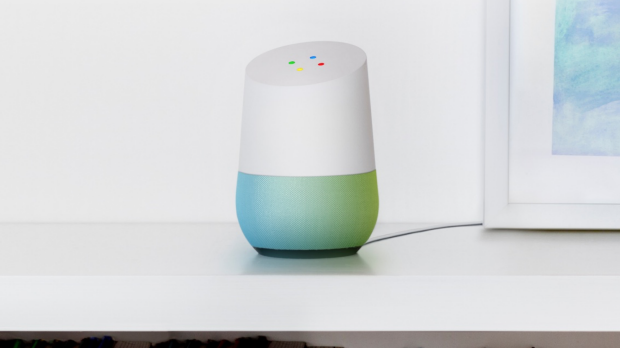
Searches without screens are possible thanks to technology like Google Assistant, Amazon Echo/Alexa, and software development kits from providers like Soundhound and Microsoft.
It’s happening already, actually. In web search, Amazon Echo answers voice queries, while the Bing knowledge and action graph allows Microsoft to provide answers to queries rather than a set of answer possibilities in the form of links as has been the case up to now.
Gartner envisions voice interactions overtaking typing in search queries because it is so much easier, faster and more intuitive for consumers. By eliminating the need for people to use eyes and hands for search and browsing, voice interactions improve the utility of web sessions even while multitasking takes on ever-increasing degrees of shared activity (walking, driving, socializing, exercising and the like).
Related to this, Gartner also predicts that one in five brands will have abandoned offering mobile apps by 2019. Already, many companies have found disappointing levels of adoption, engagement and ROI pertaining to the mobile apps they’ve introduced, and the prognosis is no better going forward; the online consumer is already moving on.
Gartner’s predictions go even further. It envisions ever-higher levels of what it calls “just-in-time knowledge” – essentially trading out searching for knowledge by simply getting answers to voice queries.
Speaking personally, this prediction concerns me a little. I think that some people may not fully grasp the implications of what Gartner is forecasting.
To me, “just-in-time knowledge” sounds uncomfortably close to being “ill-educated” (as opposed to “uneducated”). Sometimes, knowing a little bit about something is more dangerous than knowing nothing at all. Bad decisions often come from possessing a bit of knowledge — but with precious little “context” surrounding it.
With “just-in-time knowledge,” think of how many people could now fall into that kind of trap.
One of the neat aspects of online shopping is the ability to learn about consumer behaviors almost in real-time. No waiting around for published reports that are released months after the fact.
Moreover, we can know quite a bit more than simply gross sales figures, including traffic stats.
In fact, we already have extensive information available about consumer online shopping activities in the 2016 holiday season, thanks to data released by firms such as Connexity’s Hitwise division, which measures consumer behaviors across desktop, tablet and smartphone devices.
From Hitwise, we know that its Top 500 retail websites received more than 335 million visits on Thanksgiving Day alone. That averages out to just under 14 million visits per hour … but the time period of 8 pm to 11 pm had more than 50% greater traffic compared to the hourly average for the day.
Amazon.com was among the retailers receiving extensive traffic volume from 8 pm onward – in its case ~25% of its total traffic on Thanksgiving came in those final four hours of the day.
One supposes that after the “big meal,” the “big game” and the “big cleanup,” consumers decided cap off the day by plunking down at their computers or smartphones for some heavy-duty online shopping.
Hitwise found that Black Friday online shopping dynamics were different, with the top retail sites being busiest in the late morning hours, when site visits were around half again larger than Black Friday’s daily hourly average.
As for Cyber Monday, Hitwise found that consumer online shopping dynamics weren’t very much different from any other typical Monday – except that the overall volume (nearly 330 million visits) was substantially higher than the typical Monday volume of ~200 million visits. That, and a slightly greater-than-average share of online shopping happening in the early morning hours of 6, 7 and 8 am.
As for the persistent belief that Cyber Monday has more people shopping online during their time in the office, Hitwise is not seeing that phenomenon any longer.
Again, not very surprising in that more consumers have 24/7 access to digital devices in 2016 than they did ten or even just five years ago.
The Hitwise report for 2016 includes extensive findings not just on hourly shopping patterns, but also on product searches and key traffic drivers for the major online shopping websites. More data can be found on the Connexity/Hitwise website.
Most people in business know at least one or two people who publish a blog. Chances are, they know people who blog on non-business topics as well.
Have you ever wondered what are the common practices followed by these bloggers? Speaking as someone who has published blog posts since 2009, I certainly have.
Now the “wondering” is over, because Chicago-based web design firm Orbit Media Studies has just published its 2016 Blogger Research Study, which presents the results of surveying ~1,050 bloggers about how they go about their blogging business.
Here are some of the most interesting highlights from the study:
Where do bloggers write their articles?
According to Orbit’s findings, the vast majority of bloggers are creating their content at home or at their home office:
At home/home office: ~81% of respondents cited
At the office: ~32%
Coffee shops or other foodservice establishments: ~19%
Co-working spaces: ~4%
Other locations: ~7% (primarily on trains or planes, or at a library)
What is the length of a typical blog post?
From the Orbit research findings, it’s pretty clear that the most popular blog post length is 500 to 1,000 words. (This one is, for instance.) Anything longer than that quickly migrates into the “feature story” mode:
Less than 500 words: ~21% of respondents cited
500 – 1,000 words: ~61%
1,000 – 1,500 words: ~13%
1,500 – 2,000 words: ~4%
More than 2,000 words: ~1%
Do bloggers use editors, or act as their own editor?
There’s little differentiation in behaviors here; the vast majority of bloggers report that they edit their own work. An even greater ~91% of the survey respondents either edit their own work or use an ad hoc review process. Bottom line, most blog posts have never been seen by anyone other than the author before going live:
Edit own work: ~73% of respondents
Show it to one or two people: ~30%
Use a formal editor: ~12%
Use more than one editor: ~3%
How long does it take to write the typical blog post?
The responses ranged widely, but the most common length of time is between one and two hours:
Less than 1 hour: ~17% of respondents cited
1-2 hours: ~37%
2-3 hours: ~20%
3-4 hours: 13%
More than 4 hours: ~13%
Are bloggers writing for other people besides themselves?
Generally speaking, bloggers are writing for their own publication, but there are many instances where bloggers are writing for clients as well.
75% – 100% of blogger’s posts written for clients: ~9% of respondents cited
50% – 75%: ~6%
25% – 50%: ~9%
5% – 25%: ~13%
1% – 5%: ~18%
0%: ~47%
How are bloggers driving traffic to their posts?
Two words: social media. Direct e-mail marketing is also a common technique, as is search engine optimization:
Social media marketing: ~94% of respondents cited
Search engine optimization: ~51%
E-mail marketing: ~35%
Influencer outreach: ~15%
Paid services (SEM/social media advertising): ~5%
The high SEO figure is hardly surprising, considering that bloggers are, by definition, focused on writing inherently interesting, newsworthy content.
More details from the Orbit survey can be accessed here.
The headlines last week were near-breathless, announcing that North American clickthrough rates for web banner advertising are rising!
And that’s true on the face of it: According to a new analysis by advertising management company Sizmek based on billions of online ad impressions, the average engagement (clickthrough) rate on a standard banner ad has actually increased.
It’s risen all the way up to 0.14%.
It means that for a standard banner ad, for every 1,000 times it’s served, 1.4 engagements happen.
Here’s what that also means: Don’t bank your business success on online display advertising.
Of course, there are more ways to advertise online than by using standard banner ads. So-called “rich media” ads – ones that incorporate animation and/or sound – perform substantially better.
But it’s all relative, because “substantially better” in this case means that in North America, achieving an average of 2.1 engagements for every 1,000 times a rich media ad is served.
The situation is even worse than these figures imply, actually. When one considers the incidences when viewers accidentally click through on an ad thanks to an errant mouse or a fat finger, even “one out of a thousand” for engagement isn’t really correct.
The Sizmek analysis found that banner ads in certain industries perform better than those in others. Among the “winners” (if one could characterize it that way) are electronic products, apparel, and other retail advertising.
At the bottom? Automotive, jobs and careers and, ironically, tech and internet advertising.
A glimmer of hope in this continuing saga of hopeless news is in-stream video which, according to the Sizmek study, is generating far higher engagement levels of 1.5% or greater, depending on the degree of interactivity.
But I can’t help but wonder: As the novelty of these newer ad innovations inevitably wears off, won’t we see the same phenomenon occurring over time wherein audiences will become as “blind” to these ads as they are to the standard banner ad today?
As the years roll by and the effectiveness of online banner advertising continues to underwhelm in overwhelming ways, the “drive towards zero” seems to be the relentless theme. I seriously doubt we’re going to see a reversal of that.

 Regardless of the era, most successful copywriters and ad specialists have always known that short copy is generally better-read than long.