In the U.S. Postal Service’s own words: “Letters are going away.”

Actually, the pronouncement isn’t really all that earth-shattering.

USPS Mail DeliveryBut the fact that “letters are going away” has been stated by a spokesperson for the United States Postal Service speaks volumes.

The comment came after a not-for-profit interest group calling itself the “Taxpayers Protection Alliance” released a video that admonishes the USPS to “stick to delivering our letters.”

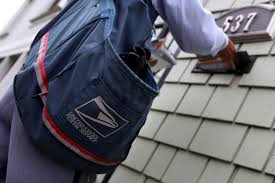
In the cartoon video, a girl is mailing a holiday card to her grandmother while complaining that it’s getting harder and harder to send First Class mail.

TPA videoReferring to the package delivery and grocery delivery services that the USPS now offers, the cartoon character pleads for the USPS “stop cutting mail services in favor of these other costly things and stick to what we really need them to do:  deliver our letters.”

The Postal Service’s response can be summed up in two words:  “Dream on.”

In fact, here’s what a USPS spokesperson stated to Target Marketing magazine about single-piece First Class mail, which includes personal correspondence and bill payments:

“[It] historically has funded the organization, since we do not receive tax dollars.  Package volume is growing exponentially … The mail mix is changing and the Postal Service welcomes that change.”

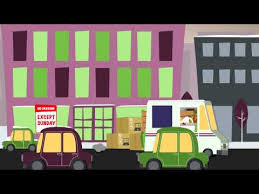
Indeed, First Class mail volume — and particularly single-piece First Class mail — has been declining rapidly, as can be seen in the USPS’s annual volume figures shown below:

First Class Mail Volume Trends
First Class Mail Volume Trends: 2005 – 2014. (Source: U.S. Postal Service)

By comparison, package delivery has grown by nearly 20% over the past five years.

Target Marketing and others have done a bit of digging to learn more about the “Taxpayers Protection Alliance” … and they’ve discovered that the group is particularly perturbed about the USPS getting into the grocery products delivery business.

“Expanding services into the private market is not only wrong because it undercuts private competitors,” the TPA organization’s president David Williams complains, “but because it is coming at the expense of its government-granted monopoly – mail delivery.”

TPA logoAll of which makes it intriguing to speculate who is actually behind the “Taxpayers Protection Alliance” and what particular agenda they may have.  Hint:  private companies that offer grocery delivery services, perhaps?

But the bigger news is this:  The USPS is no longer even pretending to claim that First Class mail is a central part of its business model looking to the future.  And that’s a huge change from only a couple of years ago.

Americans and the economy as 2015 begins: Caution continues.

As we’ve closed out the year 2014, more than a few people – from politicians to business leaders and business journalists – have sought to reassure us that the American economy is not only on the right track, it’s back in a big way.

Bronx CheerBut evidently, word hasn’t trickled down to “John Q. Public.”  Or if it has, it’s been greeted by a gigantic Bronx Cheer.

We have the latest evidence of this in management consulting firm McKinsey & Company’s most recent annual Consumer Sentiment Survey, which was conducted in September 2014 with results released last month.

The bottom-line on consumer sentiment is that despite the recent spate of decent economic news and higher employment figures, people are still reluctant to increase spending, and thriftiness remains the order of the day.

While people don’t think things are deteriorating … they don’t think they’re becoming much better, either.

So … treading water is about all.

It’s not too difficult to figure out why sentiment continues to be so skittish.  After all, median household income for Americans, adjusted for inflation, actually declined in recent years and hasn’t rebounded.

With people still feeling the earnings squeeze, it’s only natural that McKinsey’s findings show consumer sentiment still in the doldrums, with only ~23% feeling optimistic about America’s economy.

Consider these further findings from the research:

  • About 40% of respondents report that they are living “paycheck to paycheck”
  • Around 39% are at least somewhat worried about losing their job
  • Approximately 34% feel they have decreased ability to make ends meet financially

Not surprisingly, respondents with lower family incomes (under $75,000 per year) have higher concerns, and roughly 40% of those households report cutting back or delaying purchases as a result.

[Even among people living in households earning $150,000+ per year, one in five say that they’ve cut back or delayed purchases because of financial uncertainty.]

Activities we commonly associate with recessionary eras continue to be practiced by consumers.  According to McKinsey’s research, those practices include:

  • Looking for ways to save money (comparison shopping, coupon use, etc.): ~55 of respondents report doing so
  • Purchasing more products online to save money: ~48%
  • Cutting spending over the past year: ~40%
  • Doing more shopping at “dollar stores”: ~34%
  • No longer preferring/buying more expensive product brands over private-label substitutes: ~33%

Where things really look different “on the ground” than in the economists’ forecasts is what the public is saying about their future behaviors:  McKinsey logoMcKinsey believes that consumers and their attitudes have been permanently changed by the years of austerity.

The strongest indication of this?  Nearly 40% of the survey respondents say that they’ll likely never go back to their pre-recession approaches to buying and spending.

As McKinsey concludes in its report:  Cautious is the new normal … and it’s unlikely to change anytime soon.

More details on McKinsey’s survey findings can be viewed here.

Native Advertising, Sponsored Content and “Truthiness”

There are just a few slight problems with sponsored content:  Readers consider it less trustworthy … and value it less.

Lack of trust in sponsored content
It’s really not that interesting — and I don’t trust you, anyway.

Here’s a behavioral statistic that should be a little disconcerting to marketers:  Only about one in four readers scroll down on sponsored content (native advertising) on publisher websites.

Compare that to ~70% of those same readers who scroll down on other types of news content.

That’s what the chief executive officer of Chartbeat, a developer and purveyor of real-time web analytics software for media publishers, has contended, leading others to try to probe these attitudes further and try to find out more about the dynamics that are at work.

One such effort is online field research conducted this past summer by Contently, a freelance writing services clearinghouse.  It discovered that the difference in engagement levels relates to “trust.”

Generally speaking, readers trust sponsored content a whole lot less than they do “normal” content.

More specifically, here’s what Contently’s research, which targeted ~550 U.S. adults ages 18 to 65, found in terms of trust attitudes:

  • I generally don’t trust sponsored content: ~54%
  • I trust the content only if I trust the brand already: ~22%
  • I trust the content only if I trust the publication: ~19%
  • I generally trust sponsored content:  ~5%

It gets even murkier when we consider that not all readers agree on the same definition of “sponsored content.”

While the largest proportion of people consider “sponsored content” on a news website to be an article that an advertiser paid to be created as well as had input into its content, it was only a plurality of respondents:

  •  A sponsor paid and influenced the article: ~48%
  • A news site wrote it, but a sponsor paid money for it to run: ~20%
  • A sponsor paid for its name to appear next to news content: ~18%
  • A sponsor wrote the article:  ~13%

And here’s a real kick in the gut:  More people in the Contently survey would rather be served “bad ol’ banner ads” than encounter sponsored news and other posts:

  • Would rather see banner ads:  ~57% of respondents
  • Prefer sponsored posts because banner ads are annoying: ~26%
  • Prefer sponsored posts because they’re more interesting than banner ads: ~18%

The findings aren’t much different based on the age or education levels of respondents, either.

If anything, more highly educated people (those with graduate degrees) are most likely to prefer banner ads over sponsored posts.  The reason boils down to concern over the issue of deception:  A large majority of respondents reported that they have ever “felt deceived” upon realizing an article was actually sponsored by an advertiser.

Considering the disapproving numbers collected in the survey, it’s not surprising that Contently also found that respondents are far prone to click on a piece of sponsored content compared to other content:

  • Less likely to click on sponsored content: ~66%
  • More likely: ~1%
  • Equally likely: ~33%

credible sourceLastly, publishers should take note that their credibility is being diminished in the eyes of many, based on the practice of publishing native advertising.  The Contently survey found that nearly 60% expressed the view that publishers lose credibility when they run such sponsored content.

Of course, native advertising and sponsored content isn’t going to go away.  It’s too wrapped up in today’s business models for successful publishing and successful brand engagement.

But it’s clear that publishers, advertisers and the brands they represent have a bigger hurdle to clear in order for their content to be considered worthy of their readers’ attention and engagement.

American are a giving people … but so are many others.

Giving during the holidaysComing off of Thanksgiving Day and heading into the remaining holidays of the year, with their emphasis on “giving,” it’s tempting for we Americans to think of ourselves as a generous people.

Which we are.  The latest comparative analysis proves the point.

In fact, America is tied with one other country as the most generous in the world.

And that other country is … wait for it … Myanmar.

That is correct:  the United States and Myanmar (Burma) each scored a 64% generosity rating in the recently published World Giving Index.  The two nations were followed closely by Canada, Ireland, New Zealand and Australia.

The World Giving Index is actually an aggregated figure, calculated based on three kinds of giving:

  • Volunteering of time
  • Donating money
  • Helping a stranger

World Giving IndexData was collected in field research carried out across more than 140 countries via Gallup’s World View World Poll, then compiled by international research firm CAF-America for creating the World Giving Index based interview questions that measured the behaviors of people during the 30-day period prior to interviewing.

A sampling of adults in each of the countries was interviewed, with the percentages of people participating in each of the three behavioral attributes collected.  The scores were amalgamated to determine the overall index score per country.

How did the United States achieve its first-place tie?  It ranked #1 among all surveyed countries in helping a stranger (a participation score of 79%) … #5 in volunteering of time (a score of 44%) … and #9 in donating money (a score of 68%).

Myanmar’s route to the shared top spot was different:  It ranked #1 for donating money (a participation score of 91%) … #2 for volunteering time (a score of 51%), but only #49 for helping a stranger (a score of 49%).

2014 World Giving Index Heat Map by CAF
This 2014 World Giving Index “heat map” shows which nations are the most generous. (Gallup survey data amalgamated by CAF.)

For the record, here’s how the Top 10 countries fared in terms of their overall World Giving Index scores:

  • #1 (tie) USA:  64% World Giving Index score
  • #1 (tie) Myanmar:  64%
  • #3 (tie) Canada:  60%
  • #3 (tie) Ireland:  60%
  • #5 New Zealand:  58%
  • #6 Australia:  56%
  • #7 (tie) Malaysia:  55%
  • #7 (tie) United Kingdom:  55%
  • #9 (tie) Sri Lanka:  54%
  • #9 (tie) Trinidad & Tobago:  54%

Looking at the Top 10 list – and also at where the other countries surveyed fell further down the roster – it appears that living in a prosperous economy doesn’t necessarily translate into being more charitable.

If that were the case, we’d see the G20 economies making up the top tier — which they don’t.

“Aspiring” economies also don’t show up particularly well, either.  The so-called BRIC nations (Brazil, Russia, India and China) are nowhere to be found in the Top 10 ranking.

The MINT nations (Mexico, Indonesia, Nigeria and Turkey) are no-shows, too.

Myanmar poses a very interesting case.  It’s 91% rating of people giving money reflects a practice of charitable giving (daana) that is a centerpiece tenets of religious observance amongst the Theravada Buddhists that thrive in the country.

And in the United States, charitable giving participation rates have grown significantly in the years since the Great Recession, so that today about two-thirds of adults reported donating money within 30 days of when they were interviewed.

For more details on the comparative study and the world rankings, click here.

Americans Still Love Their Libraries

local libraryI’m trying to remember the last time I visited our local library in our town.  It was more than a year ago … and it was to attend a community meeting, not to check out a book or use the reference materials.

For me at least, access to the Internet at work, at home and on mobile devices has made the library pretty much irrelevant to my daily life.

It wasn’t always that way.

There was a time — not so many years ago — when I went to the library on a weekly basis.  I even traveled to other cities to do business-oriented research in larger libraries that were the designated repositories of U.S. Census Bureau, Department of Commerce and other government publications.

So based on my personal evolution, I was a bit surprised to read the results of a recent Harris Poll that surveyed ~2,300 Americans aged 18 or older on the topic of libraries and their role in people’s lives.

Harris found that ~64% of the respondents it surveyed have a library card — a statistic that is higher than I thought it would be.

[Granted, that library card figure has declined from the ~68% level that was reported by respondents in a similar survey conducted by Harris in 2008.]

The Harris research also found that women are more likely to use the local library than men.  Related to this, more than 70% of women in the survey possess a library card, compared to only ~57% of men.

Children may be a factor in how strong a relationship adults have with their local library, since adults who have children are significantly more likely to patronize the library — and more often as well.

For those who have library cards, nearly 80% reported that they’ve used the library at least once in the past year.  Indeed, more than one-third use the library on a monthly basis or more frequently.

Most library-related activity appears to be for traditional uses:

  • Borrowing books: ~56% identify as the “top reason” for going to the library
  • Borrowing DVDs/videos: ~24%
  • Consuming digital content: ~15%
  • Attending kids/community programs: ~5%

A Community and Education Resource …

library meeting roomRegardless of their own personal library usage patterns, more than nine in ten respondents in the Harris survey consider libraries to be a valuable education resource for their local community.

Nearly as many consider the library to be an important community center and meeting space.

Based on the Harris results, the role of libraries may be evolving more slowly than I would have thought.  And they still play a central role in the nourishment of their communities.

What about you?  How are you using (or not using) your local library these days?  Please share your experiences with other readers here.

Tom Goodwin Sounds Off: Five Big Myths about Advertising Today

Tom Goodwin
Tom Goodwin

It’s so common to hear weighty pronouncements about the changing world of advertising and how the ground is shifting under the discipline.

It seems that we get one of these “new horizons” commentaries about every other week or so.

That’s why it’s refreshing to hear a few countervailing voices among the breathless babble. These are the voices of reason that move past the hyperbole and provide some sober grounding.

One such person is former advertising industry exec Jeremy Bullmore. His recent commentary on the “big data” craze is a good case in point — and well-worth reading.

Another industry specialist whose comments are always worth noting is Tom Goodwin, head of Tomorrow Innovation, a digital marketing consultancy. He’s identified five big myths about today’s advertising environment which need “calling out,” as he puts it.

What are Goodwin’s myths? They’re shown below, along with Goodwin’s “quasi-contrarian” views about them.

“TV is dead.

Nope. More people are watching television than ever before — and that’s looking at just the mature USA and UK markets.  Goodwin contends that TV advertising has never been more valuable — and most commercials are viewed rather than skipped over.  But they’re viewed on many kinds of devices, of course.

Goodwin’s take: “TV is here to stay … [but] the notion of ‘television’ generates false boundaries to what’s possible with video advertising when [people] consume video in so many new ways.”

“Consumers want conversations with brands.” 

Ignore ButtonNo they don’t, Goodwin contends: “The conversations I most often see are those of disgruntled customers, given the microphone to complain that Twitter provides. It strikes me overwhelmingly, with remarkably few exceptions, that for most brands, people want an outcome or resolution or perhaps information — and not a conversation.”

“Brands must create good content.” 

Goodwin acknowledges that content delivered by brands needs to be inherently valuable. But it’s more complicated than just that:  “Branded content is not meritocratic — you can’t say any one piece of content is ‘better’ than another. Perhaps the best real test of content is when it’s served, how, and who it reaches and the value it provides.”

“Advertising is about storytelling.”

Goodwin contends that advertising people are buying their own hype with this whopper. “Let’s not delude ourselves that advertising is not about selling stuff,” he emphasizes.

“Advertising dollars should correlate with consumers’ time spent with media.”

Goodwin claims that advertising industry players feel a compulsion to “be where the people are,” under the assumption that people will engage with advertising in similar ways whether they’re online or offline, on a mobile device or a desktop, and so on.

Because of this thinking, media spend projections looking into the future “bear no resemblance” to what’s working or not working — or how it’s even possible to spend that much money advertising in the channels like mobile.

How have these myths of Goodwin’s taken hold in the first place? Is it because talking about them seems so much more interesting and important than contending that advertising is continuing on a more familiar trajectory?

Goodwin thinks this may be part of it. Certainly, he acknowledges that times are changing dramatically in advertising — as they have been for some time.  But he makes a plea for more wisdom and nuance:

“While nobody gets famous (or a promotion) saying things are complex or largely unchanged … it’s closer to the truth.”

Personally, having spent a quarter century years in the marketing communications field, I feel that Tom Goodwin has raised some very interesting and valid points.

Where do you come down on them?  Do you agree or disagree with the five “myths” Goodwin has identified in modern advertising?  Leave a comment and share your thoughts for the benefit of other readers.

Harris Poll: What Americans say they want in news coverage.

When it comes to the news, Americans say they’re tired of so much attention on celebrity gossip and scandal stories … but are they really?

news mediaExperience has shown that healthy foods on the menu at fast food establishments test well in consumer attitudinal surveys — only to bomb big time when actually introduced.

It seems as though many people answer the way they think they’re “supposed” to respond, even though they’ll never actually opt for the apple slices in lieu of the order of fries.

I wonder if the same dynamics are at work in a recent Harris Poll, which queried ~2,500 Americans age 18 or over about their preferences for news topics.  The online survey was conducted in August 2014, with the results released this past week.

For starters, three-fourths of the respondents felt that celebrity gossip and scandal stories receive too much coverage.

Indeed, many believe that entertainment news in general receives too much attention in the news:

  • Celebrity gossip and scandal stories: ~76% claim too much attention is paid in the news
  • Entertainment news in general: ~49%
  • Professional spectator sports: ~44%
  • Politics and elections: ~33%

And which topics do people feel aren’t covered sufficiently in the news? It’s everything that’s “good for you”:

  • Education topics: ~47% believe too little attention is paid in the news
  • Local/national humanitarian issues: ~47%
  • Science topics: ~45%
  • Government corruption and scandals: ~44%
  • Corporate corruption and white collar crime: ~42%
  • Global humanitarian issues: ~33%
  • Health topics: ~30%

I suspect that the “actual reality” is different from how the survey participants responded. If news organizations weren’t seeing keen interest generated by their celebrity, entertainment and sports stories, they would stop producing them.  Simple as that.

Harris Poll logoYou can view more findings from the Harris survey, including data tabulations, here. Among the interesting findings is the degree of trust people have for various different news media:  network TV news, local TV news, local newspapers, national newspapers, online news sources.

Hint: trust levels are nearly where they should be …

What are your thoughts about news topics? Which ones are getting proper coverage versus too much?  Please share your observations with other readers here.

Does Social Media Buzz Actually Win Elections?

social media politicsWes Green, one of the faithful readers of the Nones Notes Blog, posed a question as part of a comment on my recent post about the disconnect Gallup has observed between social media marketing promise and reality.

Wes’ question asked to what degree social media activity actually decides U.S. elections.

In other words, is social media “buzz” enabling campaigns to win elections that would have been won by a different candidate otherwise?

If you look at the sheer volume of YouTube posts, Facebook pages and sharing of breaking news on Twitter that’s being pushed out there by political campaigns, surely they must think that these social platforms are having an impact.

But what about a more scientific look into it?  I searched around for answers and found one such analysis.

Shortly before NM Incite, a social media intelligence joint venture of Nielsen and McKinsey, was shut down in 2013, it had looked at precisely these dynamics through the prism of the U.S. federal election campaigns of 2010 and 2012.

Here are two important pieces of data NM Incite uncovered:

  • Observation #1: In three out of four election campaigns, the candidate who was the most frequently mentioned on social media was the one who ultimately won the election.
  • Observation #2: The share of online “buzz” for each winning candidate was higher than the share of votes the winner actually won.

These two observations raise the next question: Is there a “causal” relation between social media presence and positive results on election night?  These findings don’t tell us that.

Instead, it may be that winning candidates are doing a better job at more than merely social media to win their races.  Their campaigns are just better organized and more adept at hitting on all cylinders.

Here’s one other finding from NM Incite’s evaluation that suggests that social may be an ornamentation and not the tree:  States with higher levels of voter turnout tend to be the ones with lower levels of online buzz about their candidates.

So there’s little evidence to suggest that social media buzz is generating higher voter participation.

I’d say we need more research on this topic. It’s a rapidly changing environment, no doubt.  An analysis that dates back to 2010 and 2012 is like a lifetime in online political campaigning.  Has anyone come across any newer research?

Gallup puts the Kibosh on Social Media’s Marketing Hype

“Social media are not the powerful and persuasive marketing force many companies hoped they would be.”Gallup, Inc. 

social media verdictThat’s one of several key conclusions from a report issued this past summer by research firm Gallup, Inc. The report examined the influence of social media on consumer purchase decision-making.

The Gallup findings are based on web and mail polling it conducted with ~18,000 American consumers during 2013.

When asked about the influence of social media on buyer behaviors, ~62% of the respondents reported that social media has “no influence at all” on their purchasing decisions.

By contrast, ~30% stated that social media has “some influence,” while only ~5% reported that social media has “a great deal of influence” over their purchasing decisions.

Compare these middling results with the fact that U.S. companies spent well over $5 billion on social media advertising in 2013, and the two figures seem out of proportion.

Actually, the disconnect between “people and products” on social media shouldn’t be too surprising, in that ~94% of the Gallup respondents reported that the reason they go on social media platforms is to connect with friends and family members.

The percentage of people who use social media to follow trends and/or to find reviews or other information on products is far lower: ~29% according to the Gallup survey.

But it’s the magnitude of the difference that may be surprising.

And here’s another thing: In its report, Gallup states that “consumers are highly adept at tuning out brand-related Facebook and Twitter content.”

It’s yet another data point supporting the growing realization that social media has failed to live up to its early marketing hype. So it should come as little surprise that more companies have been refining their strategies to stress quality over quantity when it comes to both fan acquisition and to published content.

More findings from the Gallup report can be viewed here.

Google Glass: Far-sighted … or fuzzy?

Google Glass fashionI’ve been blogging about Google Glass forever, it seems — or at least as far back as 2009 when the early conception of the product, then known as “Google Goggles,” was in its preliminary stage of development.

The Google Glass product was “soft-launched” in 2012, but it’s only become available to the broader consumer marketplace since the spring of this year — at about $1,500 a pair.

So … how has Google Glass done so far?

“Underwhelming” might be one way of putting it.

As it turns out, there are a number of key factors that are hindering consumer acceptance of this new piece of electronic gadgetry. Consider these points:

  • Substandard quality of images and video compared to a ~$200 smartphone:  oversaturated colors, lack of depth and dimension and all.
  • Battery life in normal use that is far less than promised: only about three hours instead of a full day.
  • Although somewhat streamlined compared to the beta versions of the product, it remains a somewhat “clunky” wearable device — or as Forbes magazine puts it, a “fashion failure.”
  • The general “creep-out factor” of constant surveillance remains a psychological barrier to many consumers.

Indeed, the jokes haven’t abated about the kind of people who make up the cadre of Google Glass “early adopters.”

“Glassholes” is one of the not-so-nice monikers they’re being called.

Going forward, Google Glass faces even more competition in the “wearables” category as computer power migrates into watches, jewelry and clothing in addition to eyeglasses. Even as these concepts become more mainstream, I suspect that Google Glass will continue to lag behind other products which seem to be harnessing the “high-tech-meets-high-fashion” concept more effectively.

We saw clear evidence of that this past week with the introduction of the Apple Watch.

Whereas Google has taken a “brute force” approach in the technological aspects of Google Glass (with design playing second fiddle), Apple has taken its technological innovation and packaged it in a way that resonates with the marketplace at a more visceral level.

If you glance quickly at someone wearing Apple’s watch, you’d be hard-pressed to think it’s anything much different from an analog version.  If Google hopes to have the same kind of success that Apple is poised to have, it needs to start thinking along those lines, too.

But one wonders if Google is “hard-wired” that way …