What’s happening with the Apple Watch these days?

Not all that much, it turns out.

Apple Watch LineWhen is the last time you heard about a product introduction where initial sales were off by 90% barely three months after coming on the market?

If you’re thinking the Blackberry 10 … you’re wrong.

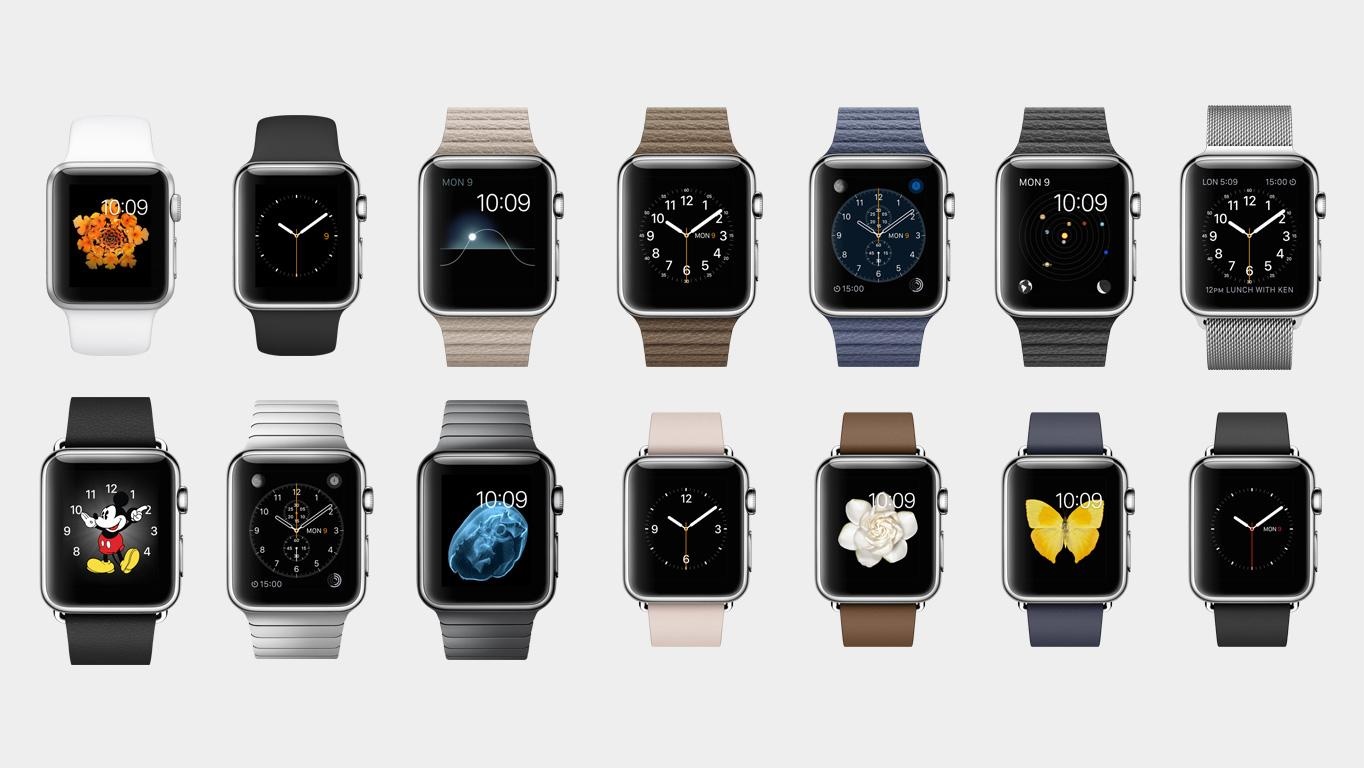
It’s the Apple Watch. Its introduction in April was made with a big amount of fanfare, promoted before and after the launch by PR, TV and online advertising, and even outdoor billboards.

But the hard truth is that aside from the tech community, few people are buying the Apple Watch.

According to Slide Intelligence, weekly Apple Watch sales have plummeted from around 200,000 per day at launch to fewer than 20,000 per day now. Moreover, most sales have been of the least expensive Sport model ($349).

Even worse, of those who have purchased an Apple Watch, fewer than four in ten would recommend the device to others.

You know there’s a problem when a new product engenders ridicule such as this brief, highly dismissive video review.

It may be too soon to write off the Apple Watch introduction as an abject failure. But I know one thing: The market’s (lack of) receptivity so far can’t be what Apple execs were hoping for.

It must be quite a comedown for a company that experienced the dizzying popularity of the iPod, iPhone and iPad right out of the box — and where those product sales continued to climb at an increasing rate for months or years after their debut.

google-glass-fashionSome people are comparing the Apple Watch introduction to what happened to Google Glass – likewise the victim of tepid sales to the point where Google quietly removed the product from the market after making a go of it for about two years.

Actually, I’m not quite sure the comparison is completely apt.

For starters, Google Glass didn’t come on the market backed by a ginormous PR and advertising campaign. In fact, it wasn’t really presented as a full-blown product – but more like a project with a beta test component.

Also, it was never made available in wide release; some people I know who wanted to “kick the tires” with Google Glass had difficulty finding out how they could do so.

But besides the very different rollout strategies, another factor might explain a more fundamental difference – and which has hugely negative potential impact on the Apple Watch.

Whereas Google Glass offered its wearers some truly new functionality, what does the Apple Watch deliver besides being merely a miniature version of an iPhone?

When something is less user-friendly (too miniature for many) … doesn’t offer any new functionality over alternative products … and is pretty expensive to boot, is it any wonder that the Apple Watch’s debut has had all the pizzazz of a cold mashed potato sandwich?

Speaking personally, I don’t consider a multipurpose device about an inch square in size as a “must-have” gadget, and I’m pretty sure others would agree with me.

Technology writer and CRM specialist Gene Marks cautions that the Apple Watch’s future isn’t likely to be much brighter than its less-than-impressive performance to date because of this fundamental liability: “The Apple Watch is not making people or companies quicker, better or wiser,” he contends.

In the world of technology and gadgets, that’s not recipe for success. Just ask Blackberry.

Now … let’s hear from Apple Watch users.  What’s your take?

Copywriting by computer: Wave of the future? … or wild-ass pipe dream?

persado logoIn recent years, computers have upended many a job category.  And they include quite a few positions involving “language” – from foreign language translators to medical transcriptionists.

And now, it looks like copywriting itself may be the next domino to fall.

Earlier this year, The Wall Street Journal published a story about Persado, a company which has developed a software algorithm that enables it to write copy without the human element.

David Atlas, the company’s chief marketing officer, refers to it as “algorithmic copywriting.”  The process creates sentences with a maximum length of 600 characters that are used for e-mail subject lines and other short persuasive copy.

Persado builds the copy by sending thousands of different e-mail subject lines to the e-databases of its clients, which include large retailers and financial services firms such as Overstock.com, AMEX and Neiman Marcus.  Response rates are measured and used to refine the subject lines to narrow them down to just the most effective.

Company PR spokesperson Kirsten McKenna explains the Persado edge further:

“Typical A/B testing will send out only a few messages – then go with the one that gives the best response.  Persado can send out thousands of permutations of the same message to determine which would be the most successful.”

Alex Vratskides
“We have never lost to a human.” — Alex Vratskides of Persado

Comparing Persado’s machine-generated results with traditional copywriting, “We have never lost to a human,” Alex Vratskides, the company’s president, claimed to The Wall Street Journal.

Those results would suggest that Persado is doing things right.  And here’s another positive indicator of success:  The company raised over $20 million in venture capital earlier this year.

The bigger question is whether Persado will be able to scale its simple and short-sentence copywriting into persuasive copy for longer-form marketing materials such as sales letters and brochures – which would make it an even bigger threat and seriously threaten to upend the traditional copywriting field.

For the answer to that question, I’d never want to take issue with the views of veteran copywriter Bob Bly, whose perspectives I respect a great deal.  In writing on this topic, he states:

Bob Bly
Bob Bly

“I do think that either already or very soon, software will equal or surpass the performance of human writers in both simple content and short copy.  We have to prepare for the eventuality that computers may someday beat human direct response copywriters in long-form copy, just as Deep Blue beat Kasparov in chess and Watson clobbered Ken Jennings in Jeopardy.  Ouch.”

What do you think?  Is computer copywriting the wave of the future?  Let’s hear your own perspectives.

What’s driving innovation in consumer packaged goods these days?

Consumer packaged goodsWith the steady rise in the number (and variety) of consumer packaged goods offerings, one might wonder if the factors that drive CPG innovation are the same today as they’ve been in the past.

There’s no dearth of research to help give us clues to the answer.  In the first half of this year alone, major CPG research results have been published by the likes of Accenture, Deloitte, Forrester, IRI and Kantar – and that just covers the first half of the alphabet!

The broad takeaway from these reports is that there are six major trends driving innovation in the industry.  Three of them are just as important as they’ve ever been, and three additional ones are becoming more significant as time goes on.

The three “classic” trends that drive CPG innovation as much as ever are convenience, value, and specialization.

They’re fundamental, they’re significant, and they haven’t lost their importance based on what’s happening in the larger marketplace or the economy:

Convenience is a major driver because consumers are always looking to get what they need faster and with less effort than before.  If a product saves time and delivers multi-benefit solutions, consumers will respond.

Value is always perennially important.  When the perceived value of a product goes down because of price pressures or a lack of differentiating benefits, brand loyalty is adversely affected.

Specialization – Product formulation and packaging can affect the way consumers feel about products.  The more that can be provided in the way of a “just-for-me” solution as opposed to “one-size-fits all,” the better.

If they concentrate on these three trends, most CPG brands do pretty well.  But there are three additional trends that appear to be gaining momentum.  Add them to the repertoire, and an additional competitive edge can be established:

Portability – As consumers’ lives have become more mobile than ever, a premium is placed on brand that can deliver on-the-go offerings.

Environmental Impact – It’s been a long time coming, but this trend finally appears to be reaching some semblance of critical mass. More consumers are considering environmental factors — not just as attributes for products that are “nice to possess,” but actually necessary for making a responsible choice. It’s more than the product itself; it’s also sourcing, manufacturing, distribution and disposal.

Health Impact – The days of CPG products being big on convenience but bad on health are numbered. Thanks to better education and more out-of-pocket medical-related cost responsibilities, health awareness among consumers has never been higher. It may not be translating yet into improved health metrics like lower obesity rates, but there’s pretty clear evidence that more people understand health risks and are taking more responsibility for their own personal health and that of their family members.  Products that can credibly claim to “healthy” benefits stand to gain in the competitive landscape.

Do you feel that there are other trends besides these six that that are influencing the development of consumer packaged goods today?  Perhaps ones associated with cultural diversity … or something else?  If so, please share your thoughts with other readers here.

On the march: Ad blocking tools continue their rise in popularity.

What Adblock PromisesI’ve blogged before about the rise of online ad blocking tools and their growing popularity with consumers.

One example:  AdTrap – a device that intercepts online ads before they reach any devices that access a person’s Internet connection.

AdTrap’s motto is simple and powerful:  “The Internet is yours again.”

In the months and years since I first blogged about it, ad blocking has only become more popular – so much so that it’s no longer just a mild irritant to advertisers and publishers, but rather a commercial threat that has a significant impact on publishers’ financial bottom lines.

It’s hardly surprising.  Most people want to run as far away from advertising as they can.  For years, we’ve taken trips to the kitchen or bathroom during TV commercial breaks.  We’ve TiVo’d ads out of existence.

And the participation levels in online ad blocking bear this out now as well.  According to data from PageFair, a company that measures publishers’ ad blocking rates and provides alternative non-intrusive advertising options, the number of ad blocker tool users reached nearly 145 million people in 2014.

That’s more than five times the 21 million users of ad blocker tools we had in 2010.

Growth continues apace:  Adblock Plus, which is the biggest of the ad blocking tools, reports more than 2.3 million downloads each week, on average.

Where are people blocking online ads?  In all sorts of areas.  But the most frequent incidence of ad blocking is on gaming sites, where blocking rates are in excess of 50%.

But blocking is happening on other online sites, too, including entertainment, fashion and lifestyle sites – albeit at about half the degree as on gaming sites.

[Tellingly, ad blocking is happening on technology sites, too, where about a quarter of the ads are being blocked.]

One of the more interesting nuggets of information reported by PageFair is the difference in ad blocking rates by country.  What we see is that Americans lag well-behind a number of other countries:

  • Argentina: ~34 of online ads are blocked
  • Poland: ~34% are blocked
  • Sweden: ~33%
  • Finland: ~32%
  • Germany: ~30%
  • United States: ~15%

Germany, in particular, has been the scene of several fervent legal skirmishes in recent years.  There, the publisher of the news magazine Die Zeit sued the parent company of AdBlock, claiming that the ad blocking tool is “illegal and anti-competitive.”  (The suit went nowhere, incidentally.)

Some observers speculate that the higher incidence of ad blocking in certain countries may be tied to those nations’ sociological profiles.  “I personally suspect that in some of these countries, citizens are more concerned about their personal privacy – perhaps for historical reasons,” Sean Blanchfield, PageFair’s CEO, has remarked.

One might wonder if, in the age of Edward Snowden and the Patriot Act (now superseded by new legislation ironically called the “USA Freedom Act”), Americans’ ad blocking practices might now be poised to align more closely with Europeans’.

I imagine we’ll know more about that degree of convergence within a year or two.

Data breaches: Target is just the tip of the iceberg.

Target data breachI’m sure we aren’t the only family who’s had to suffer through the aftershocks of Target’s infamous Great Thanksgiving Weekend Data Breach that occurred in late 2013.

According to news reports, as many as 40 million Target credit cards were exposed to fraud by the data breach.  And as it turns out, the initial reports of nefarious doings were just the beginning.

Even after being given a new credit card number, my family has had to endure seemingly endless rounds of “collateral damage” for more than a year since, as Target’s very skittish credit card unit staff members have placed card-holds at the drop of a hat … initiated phone calls to us at all hours of the day … and asked for confirmations (and reconfirmations) of merchandise charges.

Often, these unwelcome communications have occurred on out-of-town trips or whenever someone in the family has attempted to make an innocuous online purchase from a vendor based overseas.

It’s been altogether rather icky — in addition to being a royal pain in the you-know-where.

But our experience has hardly been unique.  Consider these scary figures when it comes to data breaches that are happening with businesses:

  • On average, it takes nearly 100 days to detect a data breach at financial firms. 
  • It takes nearly 200 days to do so at retail establishments.

Those unwelcome stats come to us courtesy of a multi-country survey of ~1,500 IT professionals in the retail and financial sectors.  The study was conducted by the Ponemon Institute on behalf of network security and software firm Arbor Networks.

The next piece of unsettling news is that, even with the long “dwell” times of these data breaches, the IT professionals surveyed aren’t optimistic at all that the situation will improve over the coming year.  (Nearly 60% of those working in the financial sector aren’t optimistic, as do a whopping ~70% in retail.)

It’s doubly concerning because companies in these sectors are such obvious targets for hack attacks.  The reason is simple:  The amount and degree of customer data stored by companies in these sectors is highly valuable on the black market — thereby commanding high prices.

It makes it all the more lucrative for unscrupulous people to make relentless attempts to hack into the systems and extract whatever data they can.  IT respondents at ~83% of the financial companies reported that they suffer more than 50 such attacks in a given month, as do respondents at ~44% of the retail firms.

The impact on companies isn’t trivial, either.  Another study released jointly just last week by Ponemon and IBM, based on an evaluation of ~350 companies worldwide, finds that the average data breach costs nearly $160 for each lost or stolen record.  And that’s up over 6% from a year ago.  (The Target breach cost substantially more on a per-record basis, incidentally.  And for healthcare organizations, the average cost is well over $350 per record.)

dbWhat can be done to stem the endless flood of data breach attacks?  The respondents to this survey put the most faith in technology that monitors networks and traffic to stop or at least minimize these so-called advanced persistent threats (APTs).  More companies have been implementing formalized incident response procedures, too.

As Dr. Larry Ponemon, chairman of the Ponemon Institute has stated, “The time to detect an advanced threat is far too long; attackers are getting in and staying long enough that the damage caused is often irreparable.”

Clearly, more investment in security tools and operations would be advisable.

Anyone else care to weigh in with opinions?

Google and the multi-billion dollar pay-per-click money tree.

moneyIt’s no secret that Google has been trying to diversify its revenue stream away from clickthrough advertising, which historically has accounted for the overwhelming majority of its income.

How else to explain Google’s shopping spree over the past decade, scooping up a veritable smorgasbord of industry players like these:

  • AdMob (mobile)
  • Adometry (attribution)
  • Channel Intelligence (product feeds)
  • DoubleClick (display)
  • Invite Media (programmatic creative and media buying)
  • Teracent (programmatic creative and media buying)
  • YouTube (video)
  • Wildfire (social)

So the next question is, “How much have these acquisitions and investments done to diversify Google’s sources of revenue?”

The answer:  Hardly anything.

Consider this statistic:  In 2011, nearly all of Google’s revenue came from online pay-per-click advertising, as reported by SEO firm WordStream.

Now let’s look at 2014 figures:  WordStream reports that the percentage of Google revenues from pay-per-click advertising is actually higher than in 2011, at 97%.

So much for the “diversifying effects of diversity.”

Within PPC advertising, a number of keyword terms are continuing to haul in the big bucks for Google.  A few years back, the priciest keyword term of all was mesothelioma, at more than $100 a click.

Mesothelioma continues to attract a lot of ad dollars, but it’s no longer commanding $100 a pop as it once did.  In fact, it’s no longer on the Top 10 most expensive keywords list.

That list looks like this now (in descending order of bid pricing, starting at over $50 per click and dropping to “only” around $45 for the #10 keyword):

  • Insurance
  • Loans
  • Mortgage
  • Attorney
  • Credit
  • Lawyer
  • Donate
  • Degree
  • Hosting
  • Claim

In developing the ranking, WordStream determined which keywords reside in the stratosphere by compiling data from its own large keyword dataset and the Google Keyword Tool (over a 90-day period) to determine the 10,000 most expensive keywords.

These were then organized into categories like “credit” and “insurance” by weighting the number of keywords in each category, estimating the monthly search volume as well as the average cost-per-click for each keyword.

Notice the preponderance of financial and legal terms – both of them key to sectors that attract and manage a ton of money.

The word degree is right up there, too, underscoring how important the educational complex has become to the ad business.

It must be pretty unappealing to be active in these industries and have to pony up such big dollars to participate in the pay-per-click advertising space.  But how else do we think Google racks up annual advertising revenues that are north of $32 billion?

How does the market sort out which keywords are worthy of commanding $40 or $50 per click?  Essentially, it boils down to this:  Invariably, the most expensive niches paying for the most costly keywords are ones with very high lifetime customer value – where the customer pay-off is high.

Think about it:  The amount of money an insurance company gets from an individual signing up for coverage makes the high cost-per-click rates – even at $50 a pop — worth it.

Business observers point to long-range trends that may make search engine marketing increasingly irrelevant as the growth of multichannel, multi-device marketing picks up steam.

But don’t hold your breath; Google will likely be earning billions off of pay-per-click advertising for years to come.

Is Mobile Fraud Getting Set to Balloon?

mobileMobile commerce is the latest big development in e-commerce.  So it’s not surprising that nearly all companies engaged in e-commerce expect their mobile sales revenues to grow significantly over the next three to five years.

In fact, a new survey of ~250 such organizations conducted by IT services firm J. Gold Associates, Inc. finds that half of them anticipate their mobile revenue growth to be between 10% and 50% over the next three years.

Another 30% of the companies surveyed expect even bigger growth:  between 50% and 100% over the period.

So … how could there be any sort of negative aspect to this news?

One word:  Fraud.

Fraud in e-commerce is already with us, of course.  For mobile purchases made now, a third of the organizations surveyed by Gold Associates reported that fraud losses account for about 5% of their total mobile-generated revenues.

For an unlucky 15% of respondents, fraud makes up around 10% of their mobile revenues.

And for an even more miserable 15%, the fraud losses are a whopping 25% of their total mobile revenues.

Risk management firm LexisNexis Risk Solutions has also been crunching the numbers on e-commerce fraud.  It’s found that mobile fraud grew at a 70% rate between 2013 and 2014.

That’s a disproportionately high rate, as it turns out, because mobile commerce makes up ~21% of all fraudulent transactions tracked by LexisNexis, even though mobile makes up only ~14% of all e-commerce transactions.

The propensity for fraud to happen in mobile commerce is likely related to the dynamics of mobile communications.  Unlike desktops, laptops and tablets, “throwaway” phone devices are a fact of life, as are the plethora of carriers — some of them distinctly less reputable than others.

fraudsterConsidering the growth trajectory of mobile e-commerce, doubtless there will be efforts to rein in the incidence of fraud – particularly via analyzing the composition and source of cellphone data.

Some of the data attributes that are and will continue to be the subject of real-time scrutiny include the following “red flags”:

>   A phone number being assigned to non-contracted carrier instead of a contracted one means the propensity for fraud is higher. 

>   Mobile traffic derived from subprime offers could be a fraud breeding-ground. 

>   Multiple cellphones (five or more) associated with the same physical address can be a strong indicator of throwaway phones and fraudulent activity. 

The question is whether this degree of monitoring will be sufficient to keep the incidence of mobile fraud from “exploding” – to use Gold Associates’ dramatic adjective.

I think the jury’s out on that one … but what do you think?

Online user reviews: People trust their own motives for posting … but not others’.

user reviewsOne of the most important uses of the web today is for people to seek out user reviews of products and services before they buy.

Research shows that people place a high value on these user reviews, and they are more likely to influence purchase decisions than brand advertising and other forms of promotion.

The famous 90-9-1 rule — of every 100 people, 1 creates content, 9 respond to created content and 90 simply are just lurkers — may no longer be accurate.  But even if the rule still holds, that still means quite a few people are engaging in the practice of posting customer reviews and comments.

For most people who post reviews, their reasons for doing so are positive, if the results from a recent YouGov survey of U.S. consumers are any guide.  The research was conducted in November 2014 among American respondents age 18 or older.

When asked why they post consumer reviews online, the survey respondents cited the following reasons:

  • To help other people make better purchase decisions: ~62% cited as a reason why they post
  • It’s polite to leave feedback: ~35% of respondents cited
  • It’s a way to share a positive experience: ~27%
  • To make sure good vendors get more business: ~25%
  • To warn others about a bad experience: ~13%
  • To expose bad vendors: ~12%

Interestingly, the older the age of reviewers, the more likely it is that they upload reviews for the reasons listed above:  Respondents age 55 or older cited all but one of the six reasons in greater percentages than the average for all age groups.

What about the flip side of the equation?  Do those who post feel that others are posting reviews for the same reason?

thumbs up and downThat’s where the picture gets a bit murkier.  It appears that those who post do so for positive reasons … but they don’t necessarily think others are posting for similarly positive purposes.

In fact, about two-thirds of the survey respondents felt that some reviews are written by people who haven’t actually purchased the product or service.

A large portion — 80% — think that businesses write positive online review about themselves.

And nearly 70% believe that businesses post negative feedback about competitors’ products.

So it’s interesting:  People see themselves participating in online ratings and reviews for the right reasons, yet they suspect that other posters may not be playing fairly — or maybe even gaming the system.

It’s an indication that while user reviews are welcomed in practice, there are also nagging doubts about the veracity of what people are reading.

Still, surveys find that many consumers cast those doubts to the side, and continue to read user reviews and be influenced by them.

Couponing Practices: Tradition Trumps Technology

couponingWith big changes happening every day in the way that consumers are interacting with brands and products, a big question is how quickly they’re changing their habits when it comes to the use of coupons.

Perhaps surprisingly, the results of a new 2014 Simmons National Consumer Study conducted by Experian show that “traditional” couponing activities remain far and away the most prevalent consumer activity.

First of all, the proportion of U.S. households that uses coupons of any sort is right around three-fourths (~74% according to the recent Simmons survey).

And we all know the single biggest reason why people use coupons:  to save money.  That rationale dwarfed any other among the survey respondents:

  • I use coupons to save money: ~64% of respondents mentioned
  • I use coupons to try new products: ~23%
  • Coupons incent me to try new stores: ~7%

But then the data points begin to deviate from where marketers may think their consumers’ minds are at (or where they might wish them to be).

Consider how many of the following popular couponing practices are distinctly “old school”:

  • I use coupons from in-store/on-shelf coupon machines: ~55% of respondents cited
  • I take advantage of rebates on products: ~50%
  • I use free-standing inserts from newspapers: ~46%
  • I use on-package coupons: ~37%

coupons on smartphoneCompare that to the far-lower engagement levels with “new school” couponing practices:

  • I use coupons delivered by Internet or e-mail: ~30% of respondents cited
  • I use my smartphone to redeem coupons at the store: ~17%
  • I have used a smartphone coupon app in the last 30 days: ~9%

These results show that if companies decide to embrace coupons as part of their marketing effort, they’ll need to pay as much attention (if not more) to traditional couponing methods than to newer practices.

Old habits die hard … at least in this arena.

The key to environmentally friendly products’ desirability? Deemphasize the green.

Selling green productsIt turns out that one key to the success of marketing so-called “green” products is actually to deemphasize the environmental messaging — at least when targeting consumers in the United States.

According to a number of surveys conducted by branding and marketing communications firm Landor, American consumers value possessing “green” attributes the least valuable of a series of brand attributes studied.

This despite years of social engineers and marketers of environmentally friendly brands attempting to “educate” consumers on environmental consciousness and the importance of sustainability.

At this point, it’s probably better for products to promote themselves based on other attributes besides “green” attributes … or at least to stop leading with that argument.

Instead, what are the values that resonate the most with American consumers?  According to Ted Page, a principal at content marketing firm Captains of Industry, there are three in particular — none of them having much to do with environmental issues — at least on the face of it:

  • Freedom
  • Independence
  • Saving money

But for green products, it’s possible to tie everything up in a nice bow by being able to lay claim all three of these attributes as brand attributes while not compromising the environment, either.

Nest Learning ThermostatAn example of this message strategy in action is the Nest Learning Thermostat, which promises saving energy in the context of achieving increased home efficiency, automated temperature management and lower energy bills.  The “green positioning” is nice — but it’s the other product attributes that really hit pay-dirt.

Tesla logoAnother example is Tesla electric automobiles.  Tesla is promoting the performance of its high-torque electric engine as superior to other sports cars manufactured by BMW, Lexus and Audi.

The fact that Tesla’s high-performance engine happens to be emissions-free is just icing on the cake.

Thanks in part to this messaging platform, sales of the Tesla Model S auto now outstrip those of the Mercedes S-Class, Lexus LS, BMW 7-Series, Porsche Panorama and the Audi AB.

One has to wonder if this would had happened had Tesla chose to lead with “green” messaging instead.

It would be nice to think so, but … probably not.