Holiday Sales: “Many Happy Returns”

retHere’s an interesting statistic coming out of the holiday season this year: Nearly one in four consumers has returned at least one of the gifts they received.

For gifts purchased online, returns are an even bigger part of the equation – as in one third of all online gift purchases being returned.

It’s part of a trend that’s growing at a pretty swift pace. In 2014, a total of $285 billion worth of merchandise was returned in the U.S., a 6% increase over the previous year and more than double the growth rate of retail sales as a whole.

Industry observers are expecting higher figures again for 2015 once the stats are fully tallied.

Which holiday gift items tend to be returned most often? In a survey of ~500 U.S. consumers conducted between December 28 and 31, 2015 by mobile app shopping circular developer Retale, the following gift categories were cited most frequently by respondents:

  • Jewelry: ~32%
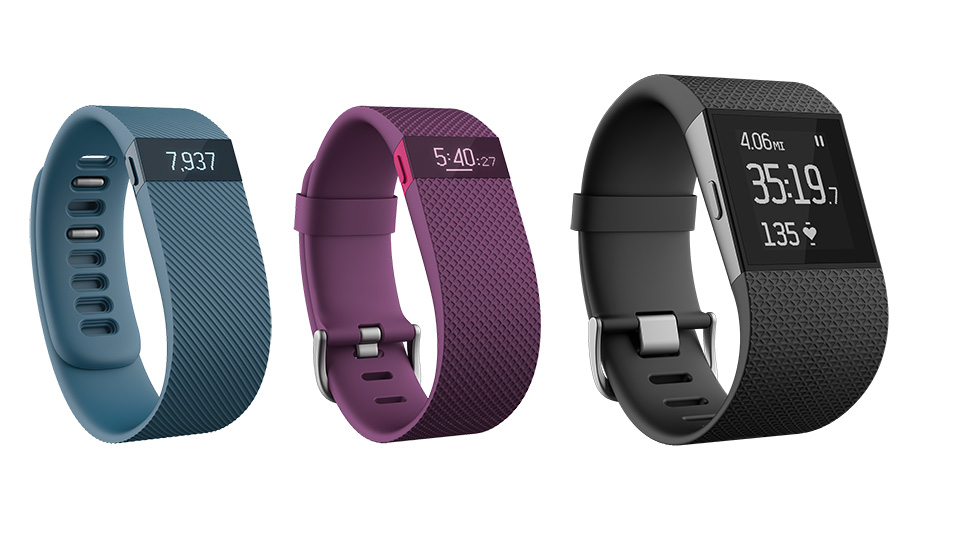
  • Electronic products: ~29%
  • Gift cards: ~27%
  • Clothes/apparel: ~26%
  • Home décor/home improvement items: ~23%

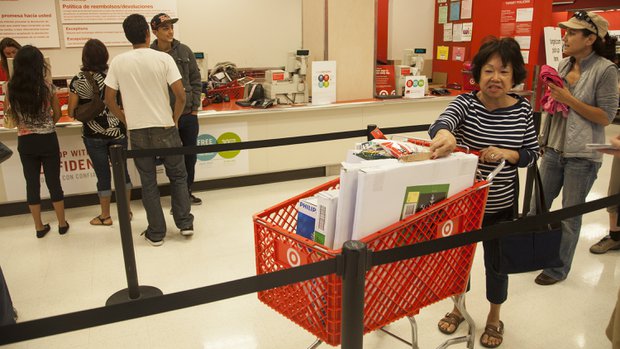
Consumers may have gravitated to online shopping big-time this past holiday season, but as for the gift return “experience,” it’s pretty clear that consumers continue to prefer making a return at the store (~64%) rather than online (~12%).

Evidently, the “hassle factor” of shipping merchandise back to the seller – not to mention the cost of return shipping if that isn’t offered free of charge – is more onerous than getting in the car and driving to the store outlet.

As for the mountains of merchandise that retailers are having to deal with, it’s caused the growth of an entirely new business niche: reverse logistics firms.

These companies input information on each returned item and determine the most lucrative way for the retailer to dispose of it – which can include sending it to a wholesaler, selling it to a liquidator for scrap, or sending it to a distribution center to be repaired and resold.  Online “refurbished products” stores on Amazon and eBay enable retailers realize up to 70% of an item’s worth by selling those items directly to value-conscious consumers, compared to recouping only 20% or 30% in the past.

It’s part of the action –> reaction aspects of retail that pretty much define this industry.

Customer Satisfaction: Going in the Wrong Direction?

The new American Customer Satisfaction Index report points to disappointing trends over the past year.

acsiAnother year has gone by — and with it the unsettling revelation that companies may be more talk than action when it comes to improving their customer satisfaction levels with customers.

The latest evidence of this comes from newly released ASCI (American Customer Satisfaction Index) figures. The data were compiled from results reported by ACSI in 2015 based on surveys conducted from Q4 2014 though Q3 2015.

What the ACSI report shows is that customer satisfaction is trending in the wrong direction. Of the 43 industries tracked by ASCI, only five of them registered an overall improvement in customer satisfaction score, while the other 38 declined or stayed the same.

The ASCI index includes more than 325 measures, with some companies represented in multiple industries where they hold substantial market share. Each company’s rating is based on a total possible high-score of 100.

Here’s the unpleasant bottom-line finding: In nearly 60% of the cases where year-over-year comparisons were possible, customer satisfaction scores have declined over the past year.

Where are the biggest problem areas? Perhaps not surprisingly, four of the five companies that experienced the largest declines in customer satisfaction were in the communications sector:   Comcast, AT&T, Cox Communications and Time Warner Cable.

ccComcast experienced a particularly bad result, with its ASCI score dropping ~10 percentage points to 54, tied for second-lowest among all companies included on the index. Cox Communications’ rating declined ~9 points to 58, and Time Warner Cable showed a similar percentage decline all the way down to a 51 score – the lowest rating recorded among all the companies on the index.

On the other hand, there were some bright spots in the latest ASCI report — and a lot of it has to do with Internet-based sectors.

Indeed, three of the five industries which charted overall improvements in customer satisfaction ratings are Internet-based, including Internet retail (up ~5 percentage points to an index of 81, the highest total achieved by any of the industries categories).

Other industries that exhibited an improvement in customer satisfaction ratings over the past were online travel services (which improved by ~1.5 percentage points to a composites score of 78) and social media (up ~4 percentage points to 78).

Two other industries that notched improved composite scores were household appliances – doing quite well with an ~81 score — and passenger air travel which, while still mired in a low index of 71, actually is during a tad better than in earlier years.

Even though the overall trends in customer satisfaction haven’t been in the right direction, more than 70 companies managed to achieve ACSI scores of 80 or better in the most recent evaluation, which has to be considered a very positive outcome. Most of these firms are manufacturers rather than service companies – which also continues a trend observed in prior-year surveys.

Additional results and detailed findings can be viewed here. Do any of the company findings surprise you?

Consumer E-Mail Marketing: Too Much of a Good Thing?

igAdvertisers often complain about the drawbacks of online display advertising — and it’s not hard to figure out why.

Online display ad viewability, which is defined by the Media Rating Council as at least 50% of an ad’s pixels being in-view for at least one continuous second, is running under 45% these days — meaning that fewer than half of online display ads meet the definition of being viewable.

That’s actually a lower percentage than before; viewability charted closer to 50% in 2014, according to the global media valuation platform Integral Ad Science.

Because of these middling viewability rates, many advertisers look to e-mail marketing as the panacea. Not only is e-mail marketing inexpensive, the rational goes, it’s also more likely to attract and engage recipients.

But here too, the evidence is that there is mediocre visibility, too. And in this case, it’s actual willful ignorance.

According to the results of a study conducted earlier this year by business technology research firm Technology Advice, ~40% of the ~1,300 U.S. adults surveyed reported that they completely ignore marketing-oriented e-mails.

Of the ~60% who reported that they do open marketing e-mails, only a little over 15% do so on a regular basis.

Here’s a breakdown of the underwhelming stats that were gathered by Technology Advice:

  • ~58% of recipients read from 0 to 25% of marketing-oriented e-mails sent to them
  • ~21% read 25% to 50% of the marketing e-mail sent to them
  • ~13% read 50% to 75% of them
  • Just ~8% read 75% to 100% of them

In an attempt to “juice” these figures, marketers are experimenting with robust personalization in e-mails that become evident even before anyone opens them (e.g., personalization showing in the subject line), along with offering clearly marked discounts and other promo attractions.

In this regard, consumers do expect businesses to provide “value” in exchange for their attention, which explains by ~40% of the survey’s respondents are responding to discounts and similar promotional offers above all other types of e-communiqués.

But with such modest levels of people interacting with any marketing-oriented e-mails at all, there’s a question as to how whether these ploys to improvement engagement are just nibbling around the edges.

Because the reality is, there’s a big portion of the market that’s become jaded about e-mail.

Another approach seems counter-intuitive but just might be working better: reducing the frequency of e-mail solicitations from advertisers.  That theory is supported by the Technology Advice research, which found that nearly 45% of respondents feel that businesses would improve their marketing effectiveness by actually sending them less frequent e-mails.

A case of “less is more”? Probably so.

What’s in a name? When it comes to senior living communities – plenty.

BrooksideFor those of us “of a certain age,” it seems hard to believe that within five years, most of the Baby Boomer generation will be of retirement age.

… This also means that millions of people will be thinking about downsizing, right-sizing, or whatever the applicable term may be.

All sorts of considerations come into play when making such a decision; climate, social, cultural and recreation opportunities, plus proximity to relatives are some of the most common.

But when the dust settles, most people will actually end up “aging in place.”

That’s one key finding from a recent survey of ~4,000 American Baby Boomer households that was conducted by the Demand Institute Housing & Community.

Not only do nearly two-thirds of the respondents plan to stay in their current homes, the majority of them feel that their homes are well-suited for aging – even if they’re multi-story, don’t offer accessibility features, or aren’t particularly low-maintenance structures.

But the survey suggests another interesting dynamic that may also be at work:  the notion that senior living communities are primarily places for people who have serious health issues or who can’t take care of themselves on their own.

Let’s face it.  Baby Boomers don’t consider themselves part of that cohort at all, which they equate with people who are substantially more elderly than themselves.

When you think about it, so many of the terms used to describe senior living facilities convey exactly the wrong thing to Baby Boomers.  The names may well be accurate descriptions of the properties in question, but they fairly scream “geriatrics.”

community

I’ve run across quite a few descriptors.  A good number of them reside in the same wheelhouse – which is to say, distinctly unattractive.  Meanwhile, other alternative names are often too narrowly descriptive as well, because one important aspect of senior living is to access to continuing care if and when that becomes necessary.

Either way, those charged with marketing these properties clearly prefer the word “community” over the word “center” or “home.”  But you can be the judge of how successful these names really are:

  • 55+ communities
  • Active adult communities
  • Age-restricted communities
  • Continuing care retirement communities
  • Elder cohousing communities
  • Independent living communities
  • Leisure communities
  • Mature living communities
  • Senior housing communities
  • Senior living communities

The bottom line on this is pretty fundamental:  Few people – regardless of how old they are – wish to be reminded of the limitations of life on a downward curve.  It’s just not compatible with the positive attributes that are so much a part of human nature.  Anything we can do to avoid being reminded of our mortality, we’ll do.

Obviously, that reluctance to face the reality of aging is of concern to property developers in the housing industry as well.  One of the actions coming out of field research such as the Diamond study is a new initiative to establish an alternative “umbrella descriptor” that works across the entire spectrum of senior living facilities.

It will be interesting to see where that exercise will end up.  As for me, I’m guessing it’ll still telegraph “geriatric.”  But perhaps we’ll end up being surprised.

Who Trusts the Media?

Americans give a big thumbs-down when it comes to having “trust and confidence” in mass media – TV, radio and newspapers.

MediaAre Americans’ attitudes about the press becoming more negative over time? If the latest survey figures on media trust are any guide, the answer is a pretty stark “yes.”

According to a recent Gallup field survey of ~1,025 American citizens aged 18 or over, trust and confidence in the mass media in the United States has reached a new low.

Today, just ~40% of respondents report that they have “a great deal” or “a fair amount” of confidence that newspapers, TV and radio report the news “fully, accurately and fairly.”

What’s more, trust levels have been on a downward trajectory ever since the late 1990s, when Gallup began surveying Americans’ attitudes on an annual basis.

Here’s what the trend looks like in the “off-election” years:

  • 1999: ~55% have “a great deal” or “a fair amount” of trust in mass media (TV/radio/newspapers)
  • 2003: ~54%
  • 2005: ~50%
  • 2007: ~47%
  • 2009: ~46%
  • 2011: ~44%
  • 2013: ~44%
  • 2015: ~40%

Moreover, the notion that young people might be more inclined to trust the media isn’t borne out in the Gallup survey results. The trust of Americans age 18-49 has dropped from 53% in 2005 to only 36% now.

Contrast this with older Americans (age 50 or older): 45% of them reported that they had trust and confidence in mass media in 2005, and today that trust level is … still 45%:

Media trust by age

Giving further credence to the oft-stated claim that American mass media are slanted towards one political party, ~55% of self-identified Democrats express trust in the media, compared to just 32% of Republicans and 33% of independents.

Gallup can’t resist editorializing a bit about its most recent media trust figures:

“Americans’ trust level in the media has drifted downward over the past decade, but some of the loss in trust may have been self-inflicted, as major venerable news organizations have been caught making serious mistakes in the past several years.”

Additional information on the Gallup survey can be accessed here.

“Immigration Nation”: Pew Research Projects U.S. Population Demographics into the Future

immigrantsI’ve blogged before about the immigration issue and its potential impact on the U.S. economy and society.

Now the Pew Research Center has released a report that predicts the U.S. becoming a “no ethnic majority” nation within the next 35 years.

When one considers that the United States population was nearly 85% white Anglo in 1965 … and that percentage has dropped to about 62% now, it isn’t that hard to imagine Pew’s prediction coming true.

Here’s the trajectory Pew predicts over the coming ten-year periods:

  • 2015: ~62% estimated U.S. white Anglo population percentage
  • 2025: ~58% projected white Anglo population percentage
  • 2035: ~56% projected
  • 2045: ~51% projected
  • 2055: ~48% projected
  • 2065: ~46% projected

Perhaps what’s more intriguing is that Pew projects the largest future percentage gains will be among Asian-Americans rather than Latino or Black Americans. The Asian share of the American population is expected to double over the period:

  • 2015: ~6% estimated U.S. Asian population percentage
  • 2025: ~7% projected Asian population percentage
  • 2035: ~9% projected
  • 2045: ~10% projected
  • 2055: ~12% projected
  • 2065: ~14% projected

If these projections turn out to be accurate, the Asian population percentage is on tap to become the nation’s third highest group.

By contrast, the Hispanic population, while continuing to grow, looks as if it will level off at about 22% of the country’s population by 2045. For Black Americans, Pew projects the same dynamics at work, but at the 13% level.

citizenship ceremonyAccording to Pew’s analysis, the biggest driving force for the projected Asian population growth is immigration. By 2055, Pew expects that Asians will supplant Latinos as the largest single source of immigrants — and by 2065 the difference is expected to be substantial (38% Asian vs. 31% Latino immigrants).

Conducted in parallel with Pew’s projection analysis was an online opinion research survey of American adults (18 and over) it conducted in March and April of this year.

Among the attitudinal findings Pew uncovered were these:

  • “Immigrants in the U.S. are making society better”: ~45% of respondents agree … ~37% disagree
  • “I would like to see a reduction in immigration”: ~50% agree
  • “I would like to see the immigration system changed or completely revamped”: ~80% agree

Again, no great surprises in these figures — although if one paid attention only to news accounts in the “popular media,” one might find it surprising to learn that a plurality of Americans actually consider immigration a net positive for American society …

Additional findings from the Pew survey as well as its demographic projections can be found here.

Surprising statistic? One-third of American adults still aren’t on social media.

social mediaFor the many people who use social media on a daily basis, it may seem inconceivable that there are a substantial number of other Americans who aren’t on social media at all.

But that’s the case. The Pew Research Center has been tracking social media usage on an annual basis over the past decade or so, and it finds that about one-third of Americans still aren’t using any social networking sites.

To be sure, today’s ~65% participation rate is about ten times higher than the paltry ~7% participation rate Pew found the first time it surveyed Americans about their social media usage back in 2005.

According to Pew’s field research findings, here’s how the percentage of social media involvement has risen in selected years in the decade since. (The figures measure the percentage of Americans age 18 or over who use at least one social networking site.)

  • 2006: ~11% using at least one social networking site
  • 2008: ~25%
  • 2010: ~46%
  • 2012: ~55%
  • 2015: ~65%

In more recent years, the highest growth in social media participation rates has been among older Americans (over the age of 65), ~35% of whom are using social media today compared to just 11% five years ago.

That still pales in comparison to younger Americans (age 18-29), ~90% of whom use social media platforms.

While it’s a common perception that women are more avid users of social media than men, Pew’s research shows that the participation rate is actually not that far apart. Statistically it isn’t significant, in fact: a ~68% social media participation rate for women versus ~62% for men.

pew-research-centerSimilarly, there are more similarities than differences among the various racial and ethnic groups that Pew surveys — and the same dynamics are at work when it comes to differing education levels, too.

Regional differences in social media practice continue to persist, however, with rural residents less likely to use social media than suburban residents by a ten-point margin (58% versus 68%). City dwellers fall in between.

More details on Pew’s most recent field research on the topic of social media participation can be accessed here. See if you notice any surprising findings among them.

Where Outside Suppliers of Business Services Fall Down on the Job …

Quirk's Corporate Research ReportQuirk’s Marketing Research Review is a periodical I’ve enjoyed reading for three decades or more.  Unlike the articles that appear in other research-related publications that are more “scholarly” and theoretical,  I find the articles in Quirk’s to be chockfull of insights, while at the same time being “efficiently practical” and easy to digest.

Recently, the magazine published findings from its second annual Quirk’s Corporate Research Report, designed to give corporate researchers an in-depth look into their world.

As part of the research-gathering process for the report, Quirk’s conducted a field survey covering budgets, outsourcing, research techniques in use and under consideration, how research findings are reported inside organizations and, last but not least, the experiences researchers have had when working with outside vendors.

When asked by Quirk’s to state what are the main problem areas when research vendors have come up short on a project, these eight factors were cited by respondents most often:

  • The vendor over-promised and under-delivered: ~56% of respondents mentioned
  • The project was handled by low-level staff: ~51%
  • Vendor failed to take time to understand the client’s business: ~50%
  • Vendor had poor communications: ~39%
  • Vendor failed to take time to understand the project’s needs: ~36%
  • Data integrity issues: ~35%
  • Vendor missed deadlines: ~35%
  • Tools/methodologies that the vendor suggested weren’t right for the project: ~14%

Notice how the most pervasive issues have less to do with the inherent quality of the research product being delivered, and more to do with how the vendor interfaces with and communicates with the companies they support.

The above behaviors represent challenges associated with conducting research projects. But I contend that they apply equally well to providers of other types of business and corporate services, whether they’re ERP or IT projects, website development projects, CRM implementation, SEM/SEO programs, media campaigns, PR initiatives … even IPOs, capital campaigns and the like.

Which of these shortcomings do you find to be most prevalent in your dealings with outside service providers — and what have you done about them? Please share any insights you may have with other readers here.

Is the Apple Watch already proving the naysayers wrong?

Apple WatchI’ve blogged recently about the market reception to the Apple Watch, which seemed to be somewhat less “ecstatic” compared with previous Apple product introductions — at least in the first few weeks after its unveiling.

Now we have several months behind us — as well as some field research that suggests that the Apple Watch is being very well-received by early adopters.

logoThe findings come courtesy of a research panel of 145 Apple Watch owners who were contacted in late July and early August 2015 by consumer market research company 451 Research. The research sample was drawn from the company’s ChangeWave network of ~25,000 business and technology professionals.

The overall satisfaction level with the Apple Watch among these respondents is ~83%, with ~54% stating that they are “very satisfied” with the product.

In terms of how well the watch is performing in relation to owners’ expectations, almost the same percentage (~79%) state that the Apple Watch is meeting them.

The three attributes of the Apple Watch that are most well-liked are these:

  • Notifications/alerts: ~49% mentioned
  • Health and fitness monitoring: ~41%
  • Design aesthetics of the product: ~30%

The three concerns about the Apple Watch mentioned most frequently are these:

  • Battery life is too short: ~37% mentioned
  • Tied to the iPhone: ~31%
  • Product is not waterproof: ~25%

The battery life issue really is one to “watch,” as it were:  Tracking surveys of Apple Watch owners reveal that more people are checking their battery status at least once per day than are checking their watch faces for the time (!).

Not surprisingly, the Apple Watch poses a competitive threat to more traditional digital watches, as more than four in five respondents report that the Apple Watch has replaced the traditional watches if they had worn one earlier.  (On the other hand, about one third of owners didn’t wear anything on their wrist at all before acquiring their Apple Watch.)

Fitness monitors: Odd man out?

The popularity of the Apple Watch’s health and fitness monitoring capabilities portends problems for competing monitors as well. Nearly half of the Apple Watch owners surveyed by 451 Research reported that they have previously planned on purchasing a monitor, but have since decided not to, thanks to the Apple Watch’s functionality.

As for whether the Apple Watch is becoming an indispensible part of the fabric of daily life with these users as compared to being more of a novelty gadget, the behavior is looking a lot more like the former:

  • Use daily for health and fitness monitoring: ~79% of respondents reported
  • Send and receive text messages daily: ~63%
  • Check weather information daily: ~52%

Perhaps the best indication of how satisfied these early adopters are with the Apple Watch is how they responded to the question, “Would you recommend the Apple Watch to a friend or colleague?”

The answer? More than four in five respondents (~83%) answered in the affirmative: ~55% reported “very likely” and ~28% reported “somewhat likely.”

If consumer response continues along the same lines in the upcoming months, it may well mean that the Apple Watch is on the path to gaining impressive adoption figures — and proving the naysayers wrong.

The real proof will be in the sales figures, of course.  But seeing these indications of early adopters being quite satisfied ith the product’s performance — and willing to recommend it to friends and colleagues — is a very good first step.

If you have begun using an Apple Watch, I’m sure other readers would be interested to know what appeals to you most about it — and what attributes might not be living up your expectations. Please share your experiences here.