Banner Ads Turn 20 This Year …

… But who really wants to celebrate?

paint the town red
Celebrating in the geriatric ward: The online banner ad turns 20.

It might come as a surprise to some, but the online banner ad is 20 years old this year.

In general, 20 years doesn’t seem very old, but in the online word, 20 years is ancient.

Simply put, banner ads represent the geriatric ward of online advertising.

In fact, there’s very little to love anymore about an advertising tool that once seemed so fresh and new … and now seems so tired and worn-out.

Furthermore, banner ads are a symbol of what’s wrong with online advertising.  They’re unwelcome.  They intrude on people’s web experience.  And they’re ignored by nearly everyone.

Old banner advertising
A whole lotta … nothing? Online banner ads in 2015.

But despite all of this, banner ads are as ubiquitous as ever.

Consider these stats as reported by Internet analytics company ComScore:

  • The number of display ads served in the United States approaches 6 trillion annually.
  • Fewer than 500 different advertisers alone are responsible for delivering 1 billion of these ads. 
  • The typical Internet user is served about 1,700 banner ads per month. (For 25 to 34 year-olds, it’s around 2,100 per month.) 
  • Approximately 30% of banner ad impressions are non-viewable.

paying no attention to advertising
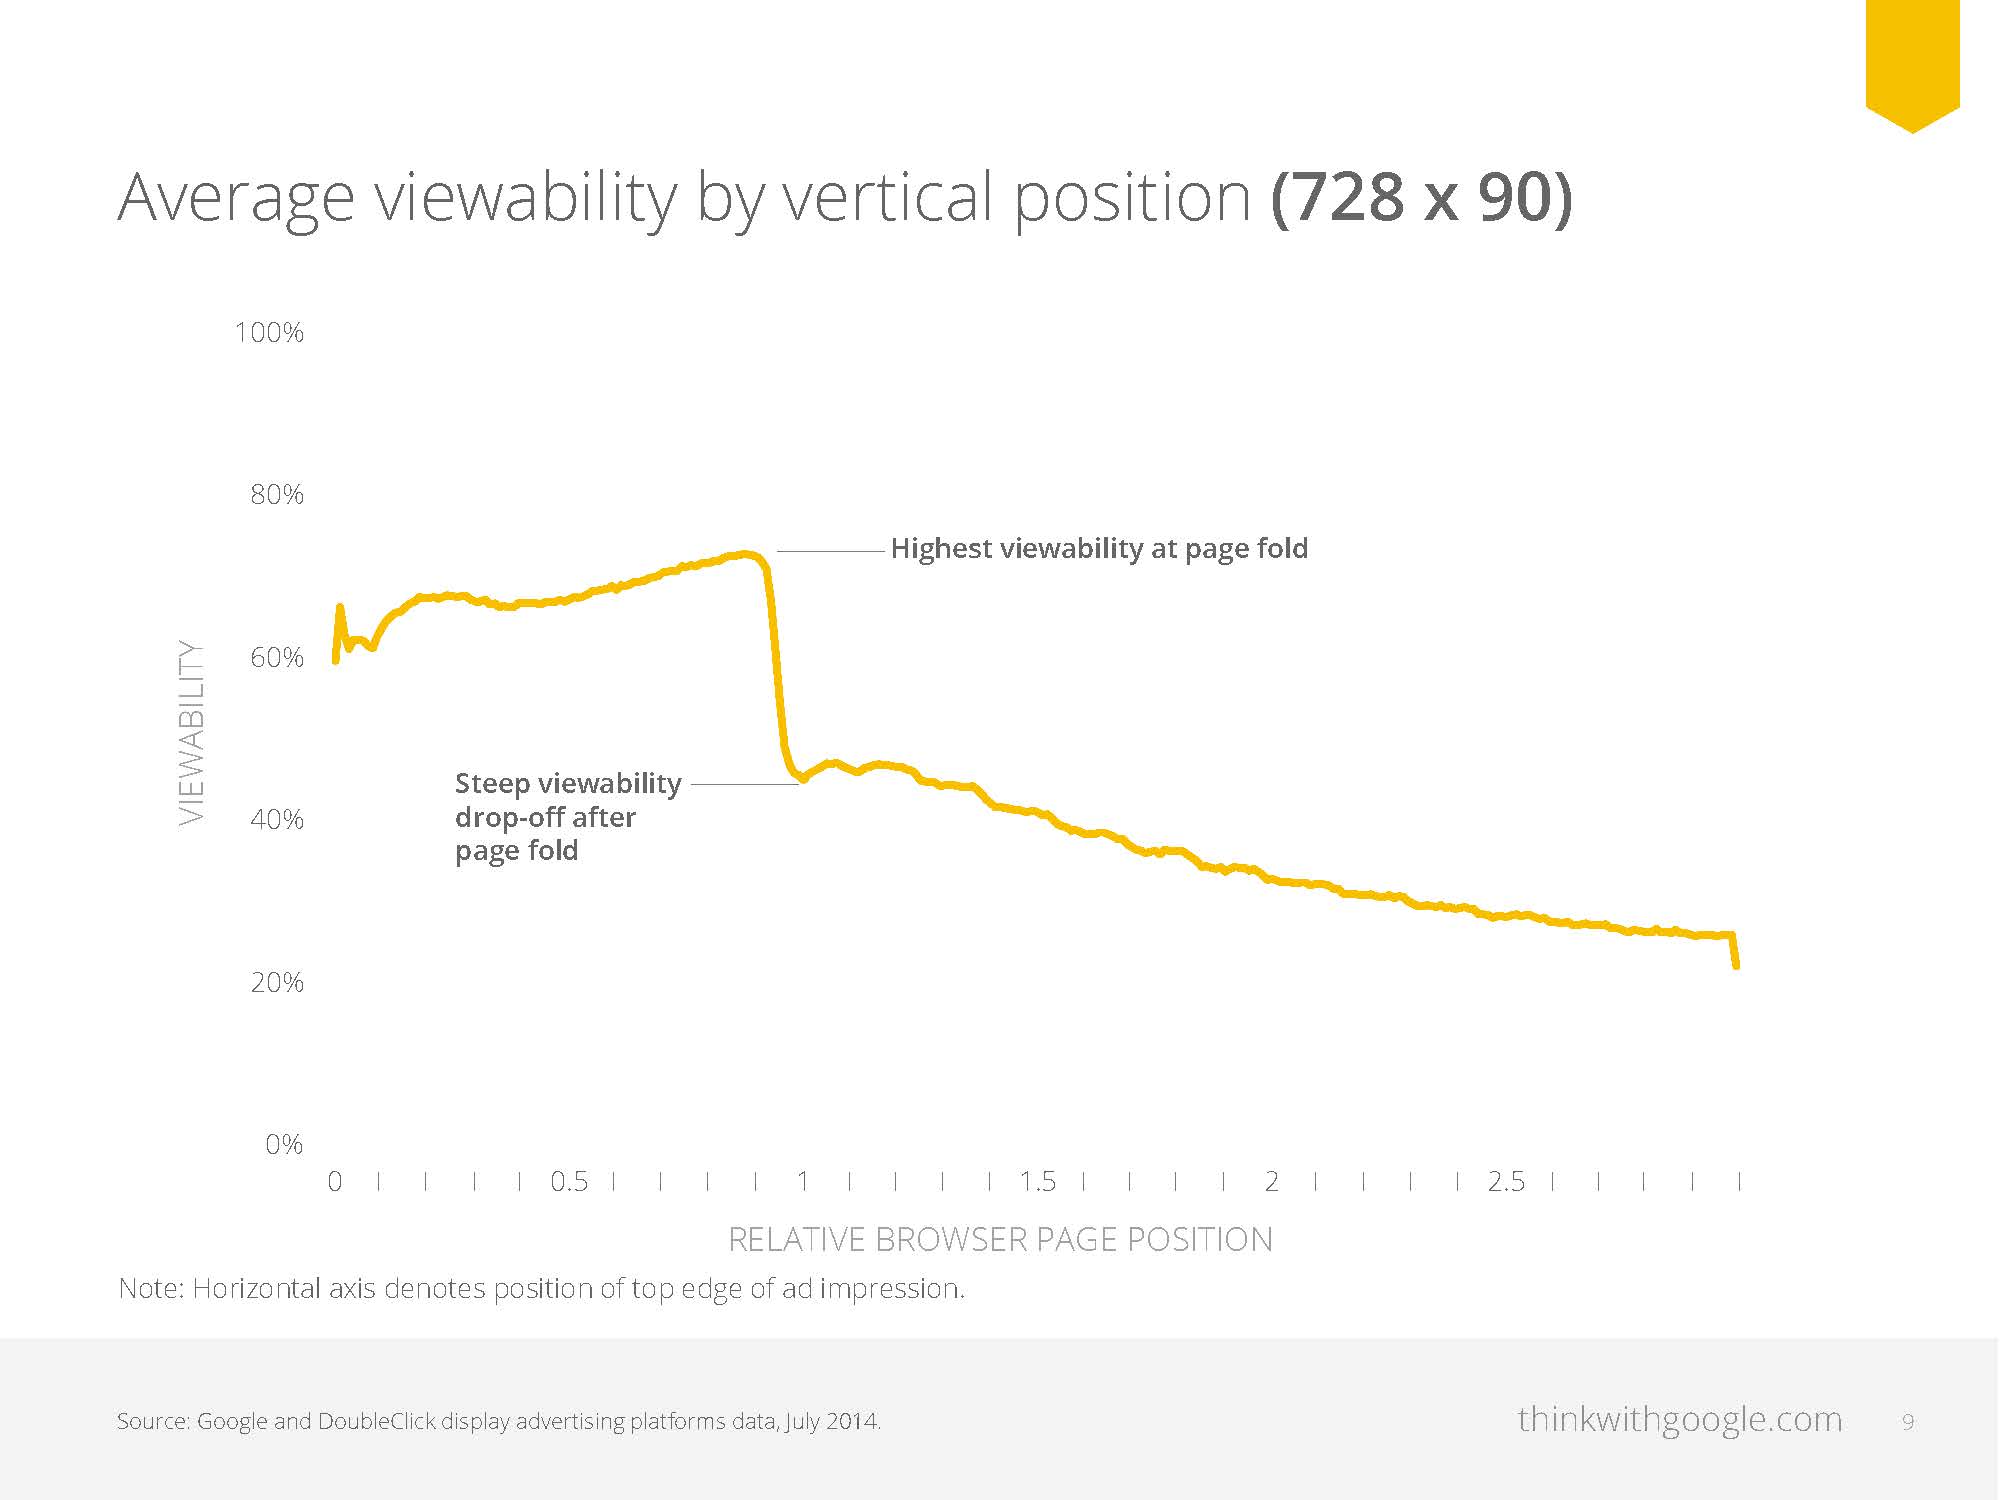
And when it comes to banner ad engagement, it’s more like … disengagement:

  • According to DoubleClick, Google’s ad serving services subisidary, banner ads have a click rate of .04% (4 out of every 10,000 served) for ads sized 468×60 pixels. 
  • According to GoldSpot Media, as many as 50% of clicks on mobile banner ads are accidental. 
  • According to ComScore, just 8% of Internet users are responsible for ~85% of the clicks on banner ads.

Come to think of it, “banner blindness” seems wholly appropriate for an advertising vehicle that’s as old as this one is in the web world.

The final ignominy is that people trust banner ads even less than they do TV ads:  15% vs. 29%, according to a survey conducted by market research company eMarketer.

Despite the drumbeat of negative news and bad statistics, banner advertising continues to be a bulwark of the online advertising system.

Publishers love them because they’re easy to produce and cost practically nothing to run.

Ad clients understand them better than other online promotional tactics, so they’re easier to sell either as premium content or as part of ad networks and exchanges.

There’s plenty of talk about native advertising, sponsored content and many other advertising tactics that seem a lot fresher and newer than banner ads.  But I suspect we’ll continue to be inundated with them for years to come.

What do you think?  Do you have a different prediction?  Please share your thoughts with other readers here.

Which are America’s Most Disliked Companies?

More than a few perennial “favorites” … plus a couple newcomers.

yuck factorI’ve blogged before about the companies Americans love to hate.  And now, 24/7 Wall St. has published this year’s list of America’s most disliked companies.  As the equity investment data aggregator and investment firm describes it:

“To be truly hated, a company must alienate a large number of people.  It may irritate consumers with bad customer service, upset employees by paying low wages and disappoint Wall Street with underwhelming returns.   

For a small number of companies, such failures are intertwined.  These companies managed to antagonize more than just one group and have become widely disliked.”

In developing its list each year, 24/7 Wall St. reviews various metrics on customer service, employee satisfaction and share price performance.

Only companies with large customer bases are evaluated, based on the premise that for a company to be widely disliked, it needs to be known to a large number of people to begin with.

Among the sources reviewed by 24/7 Wall St. are the following:

This year’s list of the most disliked companies includes the following:

logo#1  General Motors — More than 30 million recalls pertaining to vehicular problems that have been linked to more than 40 deaths brings this company to the top of the list … along with a lot of dissembling about the issue.

#2  Sony — The hacking of the company’s computers and the resulting chaos surrounding the (non)-release of the movie The Interview was just the latest in a string of bad news, including a string of financial losses and fruitless reorganization attempts that seem more like rearranging the deck chairs on the Titanic than a recipe for righting the ship.

#3  DISH Network — Super-poor customer service ratings along with ongoing fights with the Fox network, leading to the blackout of popular programs that have done nothing but rile the customer base even more.

#4  McDonald’s — Its menu has lost favor with consumers — particularly when compared to competitors’ offerings.  Negative press about low employee wages doesn’t help, either.

#5  Bank of America — BofA can never seem to score above the average for its industry.  In fact, it’s been the least popular big bank in the ACSI surveys for years.  Even worse, Zogby Analytics has BofA with the second lowest share of “poor” reviews of any business in its 2014 customer service survey.  On top of that, the bank continues to have major problems in the mortgage sector, with a slew of fines levied to clean up mortgage practices that ran afoul of the U.S. regulators

#6  Uber — No doubt, this app-based ride sharing service is wildly popular with many users, even as it’s the bane of the traditional taxi business in major American and European urban centers.  But few companies so popular have faced as much controversy at the same time.  Perhaps it’s a natural side effect of being a disrupter in the market, but it’s caused many enemies for Uber in the process.

#7  Sprint Corporation — “The great disappearing phone service” might be one way to describe this firm.  Sprint has lost nearly 2.5 million customers in just the past two years.  In fact, it’s had 11 straight quarters of net decline in subscribers.  The result is lost employee jobs (2,000 and counting), along with reduced customer service and industry competitiveness.  And the share price of Sprint stock has fallen by half in the past year.

#8  Spirit Airlines — Imagine this list of maladies in the airline industry:  flight delays, long customer lines, invasive security, lost baggage, hidden fees.  Now imagine them all wrapped up in one air carrier and you have Spirit Airlines.  Enough said.

#9  Wal-Mart — According to ACSI, few companies have lower customer ratings than Wal-Mart.  It’s low even in comparison with other big-box discount and department stores, as well as supermarkets.  Its own employees also rate the company low — and there are 1.4 million of them, so their opinions really matter.  Meanwhile, some consumers see Wal-Mart as hurting or destroying local businesses wherever it chooses to open a store in a new community.

#10  Comcast — Whether we’re talking about its television or Internet services, this company comes in with really horrific customer satisfaction ratings.  They’re “standout bad” in an industry that’s infamous for poor customer care.  It didn’t help when a phone recording of a Comcast customer service representative went viral — the rep who took up nearly half an hour refusing to help a customer cancel his service.

[Interestingly a few companies that were on 24/7 Wall St.’s list last year no longer appear — notably retailers JCPenney and Abercrombie & Fitch.  For Penney’s in particular, it seemed a slam-dunk prediction that it would remain on the list this time around, but the company is actually in the midst of a modest turnaround — and consumers and investors have noticed.]

There’s another interesting and perhaps ironic factor about America’s “least liked” companies.  It’s that four of them also appear on the list of the ten most-advertised brands in the United States.

That is correct:  Based on 2013 U.S.-measured media ad spending as calculated by AdAge, Chevrolet (General Motors), McDonald’s, Walmart Stores and Sprint rank in the Top Ten list of the most-advertised brands:

  • untitled#1 AT&T
  • #2 Verizon
  • #3 GEICO
  • #4 Chevrolet (General Motors)
  • #5 McDonald’s
  • #6 Toyota
  • #7 Ford
  • #8 Walmart Stores
  • #9 Sprint
  • #10 Macy’s

Evidently, “all that advertising” isn’t doing “all that much” to burnish these brands’ image!

Online user reviews: People trust their own motives for posting … but not others’.

user reviewsOne of the most important uses of the web today is for people to seek out user reviews of products and services before they buy.

Research shows that people place a high value on these user reviews, and they are more likely to influence purchase decisions than brand advertising and other forms of promotion.

The famous 90-9-1 rule — of every 100 people, 1 creates content, 9 respond to created content and 90 simply are just lurkers — may no longer be accurate.  But even if the rule still holds, that still means quite a few people are engaging in the practice of posting customer reviews and comments.

For most people who post reviews, their reasons for doing so are positive, if the results from a recent YouGov survey of U.S. consumers are any guide.  The research was conducted in November 2014 among American respondents age 18 or older.

When asked why they post consumer reviews online, the survey respondents cited the following reasons:

  • To help other people make better purchase decisions: ~62% cited as a reason why they post
  • It’s polite to leave feedback: ~35% of respondents cited
  • It’s a way to share a positive experience: ~27%
  • To make sure good vendors get more business: ~25%
  • To warn others about a bad experience: ~13%
  • To expose bad vendors: ~12%

Interestingly, the older the age of reviewers, the more likely it is that they upload reviews for the reasons listed above:  Respondents age 55 or older cited all but one of the six reasons in greater percentages than the average for all age groups.

What about the flip side of the equation?  Do those who post feel that others are posting reviews for the same reason?

thumbs up and downThat’s where the picture gets a bit murkier.  It appears that those who post do so for positive reasons … but they don’t necessarily think others are posting for similarly positive purposes.

In fact, about two-thirds of the survey respondents felt that some reviews are written by people who haven’t actually purchased the product or service.

A large portion — 80% — think that businesses write positive online review about themselves.

And nearly 70% believe that businesses post negative feedback about competitors’ products.

So it’s interesting:  People see themselves participating in online ratings and reviews for the right reasons, yet they suspect that other posters may not be playing fairly — or maybe even gaming the system.

It’s an indication that while user reviews are welcomed in practice, there are also nagging doubts about the veracity of what people are reading.

Still, surveys find that many consumers cast those doubts to the side, and continue to read user reviews and be influenced by them.

B-to-B Buyers: Who’s Engaging with What Content?

Different Types of ContentIn my work with manufacturing companies and other B-to-B firms, I’m often asked what type of informational content is the most worthwhile and valuable from a marketing standpoint and for attracting and converting customers.

The question is relevant for most companies because there are limits on marketing resources (both time and dollars), while the methods companies can use to communicate with their target audiences are far more extensive and varied than they were in the not-too-distant past.

The answer to the question about the best information content is always one of “degree” … because the most valuable piece of content for any single prospect or customer is the one that sparks him or her to buy.

And that one piece of critical content could be one of many things.

Helpfully, we now have a new survey that can help with a bit more quantification.  The research, which was conducted by content marketing firm Eccolo Media, surveyed technical buyers (engineers, managers and directors).

It’s a relatively small sample (fewer than 200 respondents), but the directional results are worth consideration.  I also think that the results can be applied to other B-to-B buyer types as well.

One finding that came as a bit of a surprise to me was that most buyers read just two to five pieces of content before making their decisions.

What kind of content do they consult most often?  Here’s what these respondents reported:

  • Product brochures and data sheets: ~57% consult this type of content
  • E-mail communiqués: ~52% consult
  • White papers: ~52%
  • Competitive vendor worksheets: ~42%
  • Case studies/success stories: ~42%
  • Technical guides: ~35%
  • Custom magazines/publications: ~35%
  • Video content: ~35%
  • Social media content: ~34%
  • Webinars: ~34% 

As for which of these types of content are considered the most worthwhile and influential to buyers, the ranking is somewhat different:

  • Product brochures and data sheets: ~39% rate as highly influential content (top five resources)
  • White papers: ~33%
  • Case studies/success stories: ~31%
  • Technical guides: ~23%
  • Competitive vendor worksheets: ~22%
  • Videos:  ~17%
  • E-mail communiqués: ~15% 
  • Social media content:  ~14%
  • Custom magazines/publications:  ~14%

The Eccolo Media report draws this conclusion from its research:

“Marketers have been good at producing large volumes of content, but not quality content and not the right type of content … The more content we produce, the more likely it is to fail.”

One thing the research clearlyshows is that companies need to spend more effort in collecting and publishing customer case examples and success stories, because those appear to have a disproportionately higher degree of influence over potential buyers — if only they are available to consult.

More broadly, the types of content that are of greater value to buyers tend to be the ones that require more time and effort to prepare.  The adage that “success is 20% inspiration and 80% perspiration” appears to apply to marketing content development as well.

More summary findings from Eccolo Media’s 2015 B2B Technology Content Survey Report can be accessed here.

What are your thoughts as to the relative merits of different types of content?  Whether you’re a B-to-B marketer or a B-to-B buyer, please share your thoughts with other readers here.

The 2015 Marketing Buzz-Meter Kicks into Gear

We’re only a few weeks into 2015, and already the marketing buzz-meter is operating at full force.

amplificationThe latest marketing buzz phrases are always interesting because, while they surely relate to trends and tactics that are taking on greater importance, they can also be short-hand references that “everyone” uses but “no one” really understands.

Consider one popular buzz-phrase example from 2014:  “Big Data.”

I don’t think I’ve heard the same definition of what “big data” is from any two people.  Yet it’s a term that was bandied about throughout the entire year.

No doubt, “big data” will continue to be a popular buzz phrase in 2015 as well.  But you can be sure it’ll be joined by a number of others.  As Natasha Smith, editor of Direct Marketing News magazine reports, get ready to hear many of mentions of these buzz terms as well this year:

Dark Social:

This references online content, information or traffic that’s hard to measure because it occurs in messaging apps, chat and e-mail communications.  Purportedly first coined by Atlantic magazine, it’s a term whose very name conjures up all sorts of mysterious and vaguely sinister connotations about behaviors that are at work below the surface – thereby making it an irresistible phrase for some people to use.

Viewability:

This term is becoming increasingly popular due to people’s concerns that much of what makes up “viewed” online content turns out to be hardly that.  For instance, there’s a difference between a simple video impression (merely an open) and a “viewable” one (opened and staying open for at least a few seconds).

More than likely, over the coming year the Interactive Advertising Bureau and other “great experts” will be debating over what actually constitutes a “viewable” impression.  All the while, you can be sure that marketers will be referencing the term with abandon.

Attention Metrics:

Dovetailing “viewability” is the idea that traditional online marketing metrics such as unique visitors, clickthroughs, and page views are too shallow in that they don’t really measure the true consumption of content.

Enter the buzz term “attention metrics.”  No doubt, marketers will be all over this one in 2015 as they focus more on the time and attention people are spending with content, not merely the fact that some form of engagement happened.

The Internet of Things:

This term started appearing on the radar screen in 2014 but is really coming into its own now.  It even has its own Wikipedia page entry.  While the commercialization of data-collecting devices such as wearable sensors and sensors embedded in appliances and other electronics is an undeniably significant development, this term has to be one of the most pretentious-sounding phrases ever coined.

… Which makes it an irresistible entry in the buzz-meter lexicon, of course.

Conscious Capitalism:

Rounding out the 2015 list – at least for now – is a buzz phrase that captures the essence of what every socially aware marketer wishes his or her company to be.  “Conscious capitalism” refers to companies and brands that are purportedly socially responsible and “in sync” with the needs of the community and the world.

This is considered important because so much survey research shows that people respond positively to companies that “do well by doing good.”

what's all the buzz aboutExpect many people to embrace this approach – and the accompanying buzz phrase – because it sounds so perfect.

[Never mind that things often come crashing down to earth if and when consumers are asked to pay more for the “socially responsible” products and services, or to make unpleasant or unexpected adjustments to their routine in the event.]

Do you have any other examples of marketing buzz terms that you think are poised for stardom (or notoriety) in 2015?  Please share your thoughts with other readers here.

Native Advertising, Sponsored Content and “Truthiness”

There are just a few slight problems with sponsored content:  Readers consider it less trustworthy … and value it less.

Lack of trust in sponsored content
It’s really not that interesting — and I don’t trust you, anyway.

Here’s a behavioral statistic that should be a little disconcerting to marketers:  Only about one in four readers scroll down on sponsored content (native advertising) on publisher websites.

Compare that to ~70% of those same readers who scroll down on other types of news content.

That’s what the chief executive officer of Chartbeat, a developer and purveyor of real-time web analytics software for media publishers, has contended, leading others to try to probe these attitudes further and try to find out more about the dynamics that are at work.

One such effort is online field research conducted this past summer by Contently, a freelance writing services clearinghouse.  It discovered that the difference in engagement levels relates to “trust.”

Generally speaking, readers trust sponsored content a whole lot less than they do “normal” content.

More specifically, here’s what Contently’s research, which targeted ~550 U.S. adults ages 18 to 65, found in terms of trust attitudes:

  • I generally don’t trust sponsored content: ~54%
  • I trust the content only if I trust the brand already: ~22%
  • I trust the content only if I trust the publication: ~19%
  • I generally trust sponsored content:  ~5%

It gets even murkier when we consider that not all readers agree on the same definition of “sponsored content.”

While the largest proportion of people consider “sponsored content” on a news website to be an article that an advertiser paid to be created as well as had input into its content, it was only a plurality of respondents:

  •  A sponsor paid and influenced the article: ~48%
  • A news site wrote it, but a sponsor paid money for it to run: ~20%
  • A sponsor paid for its name to appear next to news content: ~18%
  • A sponsor wrote the article:  ~13%

And here’s a real kick in the gut:  More people in the Contently survey would rather be served “bad ol’ banner ads” than encounter sponsored news and other posts:

  • Would rather see banner ads:  ~57% of respondents
  • Prefer sponsored posts because banner ads are annoying: ~26%
  • Prefer sponsored posts because they’re more interesting than banner ads: ~18%

The findings aren’t much different based on the age or education levels of respondents, either.

If anything, more highly educated people (those with graduate degrees) are most likely to prefer banner ads over sponsored posts.  The reason boils down to concern over the issue of deception:  A large majority of respondents reported that they have ever “felt deceived” upon realizing an article was actually sponsored by an advertiser.

Considering the disapproving numbers collected in the survey, it’s not surprising that Contently also found that respondents are far prone to click on a piece of sponsored content compared to other content:

  • Less likely to click on sponsored content: ~66%
  • More likely: ~1%
  • Equally likely: ~33%

credible sourceLastly, publishers should take note that their credibility is being diminished in the eyes of many, based on the practice of publishing native advertising.  The Contently survey found that nearly 60% expressed the view that publishers lose credibility when they run such sponsored content.

Of course, native advertising and sponsored content isn’t going to go away.  It’s too wrapped up in today’s business models for successful publishing and successful brand engagement.

But it’s clear that publishers, advertisers and the brands they represent have a bigger hurdle to clear in order for their content to be considered worthy of their readers’ attention and engagement.

It’s Official: Cyber Monday 2014 was the Biggest e-Commerce Day in U.S. History

Cyber Monday ShoppingIn the days following Black Friday this year, we heard reports that consumer purchase volumes at stores were down more than 10% compared to 2013.

A number of explanations for the decline were given, among them the notion that Black Friday sales are less of a draw this year, since merchandise sales now begin before Thanksgiving and tend to run the entire month of December.

But some observers speculated as to whether soft Black Friday revenue figures presage an equally soft holiday shopping season overall.

Well … now that we have sales figures from Cyber Monday (the Monday following Black Friday weekend), I think it’s safe to say that any concerns about a tepid holiday buying season are unfounded.

Custora E-Commerce Pulse, a customer relationship management firm which tracked more than 100 million online shoppers and over $40 billion in e-commerce revenue over the full Thanksgiving Holiday weekend, has just reported that Cyber Monday e-commerce revenues were up over 15% compared with Cyber Monday 2013.

That makes Cyber Monday 2014 the single biggest day in U.S. online shopping ever in history.

Other days of the Thanksgiving weekend also showed robust gains in online shopping:  Black Friday online sales were up ~21% over 2013, and online shopping on Thanksgiving Day itself were up nearly 18% over Thanksgiving Day in 2013.

The strong growth was fueled by mobile shopping, e-mail marketing, plus online product searches on Google and other search engines.

In particular, mobile shopping accounted for ~22% of orders on Cyber Monday, significantly higher than the ~16% of orders recorded last year.

On Black Friday itself, mobile shopping accounted for around 30% of all orders — yet another dramatic increase over 2013 when mobile shopping account for just shy of 23% of orders.

This year’s Cyber Monday stats put the lie to the notion that e-mail marketing is losing its luster.  In fact, e-mail marketing drove nearly one in four online shopping orders, outstripping natural search (at ~19% of all orders) and paid search (~16% of orders).

Much ado about (practically) nothing: Social media and Cyber Monday.

And guess which channels weren’t a meaningful part of the holiday shopping experience this year?

If you guessed social media … you’re absolutely correct.

Taken together, Facebook, Twitter, Pinterest and Instagram accounted for only about 1.5% of online e-commerce orders on Cyber Monday.  (For the weekend as a whole, it was only slightly better at ~1.7%.)

This year’s statistics just add more confirmation of several truisms about online consumer marketing:

  • Targeted e-mail still works the best.
  • Online search is important.
  • Social media is like Lucy and the football.

Google Comes Clean on Ad Viewability (or Non-Viewability?)

clear view or no clear viewThere have been quite a few reports in recent times pointing to the lack of viewability of online display advertising, and I’ve blogged about this topic before.

And now, we have the $55-billion “advertising vacuum-cleaner company” Google itself admitting as much.

It comes in a study that Google has just released.  The report presents findings from its analysis of display ad programs using its “active view” technology (like DoubleClick) to determine which factors are affecting the viewability of ads.

The results aren’t pretty; more on that below.

But first … why is Google doing this?

I suspect it’s because more advertisers are now insisting on paying only for their ads that have been actually viewed, as compared to those simply served.

Now, to what Google is reporting.  It turns out that fewer than half of all ad impressions served on Google’s display platforms are ever seen, because they’re served outside of the viewer’s browser window.

That is correct:  A huge chunk of Google’s billions in ad revenues that it collects come from ads that no one ever saw.

What digital advertising platforms love to remind us is that their programs are superior to “bad old television and radio advertising” because of their sophisticated targeting capabilities and their superior measurement metrics.

That may be.  But how is it all that different for TV viewers to miss an ad because they took a kitchen or bathroom break, compared to people who never even had the opportunity to see an ad that was “served” in a dead zone?

The next question is, “What can advertisers do to help minimize the incidence of phantom online advertising?”

Helpfully, Google provides some clues in its report.  For instance, the highest viewability for ads is immediately above the “fold” – in other words, at the point where the viewer must begin to scroll down to see the rest of the page.

Surprisingly, viewability right above the fold is slightly higher than at the very top of the page.  But it’s massively less so just below that magic spot.  Google pressented five charts in its report to illustrate this drop-off phenomenon; the one reproduced below shows viewability of vertical position ads sized 728 x 90 pixels:

Average viewability by vertical position on online ads


Less surprising, perhaps, is the fact that vertical ads have higher viewability than horizontal or block ads, for the simple reason that they stay on the page longer:

Most viewable online display ad sizes


By publishing this data, Google purports to want to help their advertisers understand high- and low-value inventory better so they can target their campaigns more appropriately and effectively.

Google is also encouraging publishers to strive for delivering viewability rates in excess of 50% by offering ad inventory that will perform more effectively in its respective positions.

My only question is … why has it taken Google so long to set these standards and to publicize them in the first instance?

Sure, Google’s only the middleman between publishers and their viewers.  But it’s a pivotally important one.

Company and brand positioning statements: Some laudable … some lousy … many just lame.

Positioning: The Battle for your Mind Al RiesAbout 15 years ago a book was published titled Positioning:  The Battle for Your Mind, authored by Al Ries and Jack Trout.

Although the examples cited by the writers are a little outdated by now, the book remains an important contribution to the literature on the subject of brand positioning and what it takes for a company to build, strengthen and protect it.

Unfortunately, too few companies are paying heed to some of the basic tenets of proper positioning.

Indeed, based on the way many businesses approach their positioning — and the typical positioning statements one encounters — it seems less like a battle for someone’s mind and an exercise in mind-numbing irrelevance, instead.

Here’s a positioning statement I came across recently, from a firm my own industry (MarComm).  I’m shielding the name of the company to be charitable.  But tell me if this isn’t just dreadful:

“[Company X] is a creative marketing communications firm that delivers fresh ideas and authentic solutions that drive measurable business results. 

Our strategic, problem-solving approach generates marketing and communications programs that increase brand awareness, improve sales productivity, increase marketing response, drive revenues and support business goals. 

We plan and implement creative solutions that leverage our clear insight, strategic business skills, team building, proven process, distinctive design and measurement methodology.

… and so on.  (It continues for another two paragraphs.)

The big problem is that there’s little being said that’s either informative or differentiating.

Worse yet, enveloping a wholly indistinctive positioning statement with a bunch of forgettable adjectives, mealy-mouthed platitudes and other “weasel words” just makes things worse.

To my view, when it comes to company positioning, directness and simplicity is always the better route.

For starters, go for facts.  If a company offers what many others also do, that’s no indictment of the business.  It’s fruitless to try to communicate “uniqueness” where there is none, because people won’t be fooled for long anyway.

brand positioningCut the “marketing buzz-speak,” too.  People hear those overused terms as mere noise.  And noise is irritating.

If there is demonstrated singular competence in one or more areas, it’s OK to tout that, of course.  But throttle back on the hype and leave it to the audience to draw its own conclusions.

Speaking personally, when I read a company’s positioning statement, I’m looking for the quintessential “elevator speech” that covers the “Five Ws” as succinctly as possible.

And spare the marketing fluff, please.

More than anything, going beyond “just the facts” is insulting to the readers’ intelligence.  If they want to learn more, they’ll do it on their own terms, thank you very much.

Do you know of any company positioning statements that are particularly effective?  If so, please share them here.  (On the other hand, if the ones you know are dreadful, perhaps keep those ones to yourself!)

A Bombshell Forrester Finding? Brands are Wasting Time and Money on Facebook and Twitter

Forrester logo

This past week, marketing research firm Forrester published a new analytical report titled “Social Relationship Strategies that Work.”

The bottom-line conclusion of this report is that brand marketers are generally wasting their time and money focusing on social platforms that don’t provide either the extensive reach or the proper context for valuable interactions with customers and prospects.

In particular, Forrester’s research has determined that Facebook and Twitter posts from top brands are reaching only about 2% of their followers.

Engagement is far worse than even that:  A miniscule 0.07% of followers are actually interacting with those posts.

Much has been made of Facebook’s recent decision to reduce free-traffic posts on newsfeeds in favor of promoted (paid) posts.  But Forrester’s figures suggest that the lack of engagement on social platforms is about far more than just the reduction in non-promoted posts.

Nate Elliott Forrester
Nate Elliott

Nate Elliott, a Forrester vice president and principal analyst, believes that brand managers need to make major changes in how they’re going about marketing in the social sphere.  He notes:

“It’s clear that Facebook and Twitter don’t offer the relationships that marketing leaders crave.  Yet most brands still use these sites as the centerpiece of their social efforts, thereby wasting significant financial, technological and human resources on social networks that don’t deliver value.”

With Twitter and Facebook being such spectacular duds when it comes to social platforms, what does Forrester recommend that brand marketers do instead?

One option is to develop proprietary “branded communities” where fans can hang out in zones where brands can be their own traffic cops, instead of relying on a giant social platform to do the work (or not do the work) for them.

e-mailEven better is to return to greater reliance on an old standby tactic: e-mail marketing.

If this seems like “back to the future,” Forrester’s Elliott reminds us how e-mail can work quite elegantly as the centerpiece of a brand’s social marketing effort:

“Your e-mails get delivered more than 90% of the time, while your Facebook posts get delivered 2% of the time — and no one’s looking over your shoulder telling you what you can and can’t say in your e-mails.  If you have to choose between adding a subscriber to your e-mail list and gaining a new Facebook fan, go for e-mail every time.”

I can’t say that I disagree with Nate Elliott’s position.

Now it’s time to hear from the rest of you marketing professionals.  How successful have you been in building engagement on social platforms like Twitter, Facebook and LinkedIn?  Have your efforts in social paid off as well as in your e-mail marketing initiatives?  Let us know.