The FTC Cracks Down on Native Advertising Abuse

But what difference will it make? Only time will tell …

FTIt had to happen: After years of publications uploading native advertising content that’s barely labeled as such, the Federal Trade Commission has handed down new guidelines that leave very little wiggle room in what constitutes proper labeling of paid advertising material.

Published under the title Enforcement Policy Statement on Deceptively Formatted Advertisements, the FTC’s new guidelines, which run more than 10 pages in length, make it more difficult than ever to “camouflage” advertising as “legitimate” news content.

What it boils down to is the stipulation that any sponsored content must be clearly labeled as advertising – using wording that the vast majority of readers will understand instantly.

Here’s how the FTC guidelines describe it:

“Terms likely to be understood include ‘Ad,’ ‘Advertisement,’ ‘Paid Advertisement,’ ‘Sponsored Advertising Content,’ or some variation thereof. Advertisers should not use terms such as ‘Promoted’ or “Promoted Stories,’ which in this context are, at best, ambiguous and potentially could mislead consumers that advertising content is endorsed by a publisher site.”

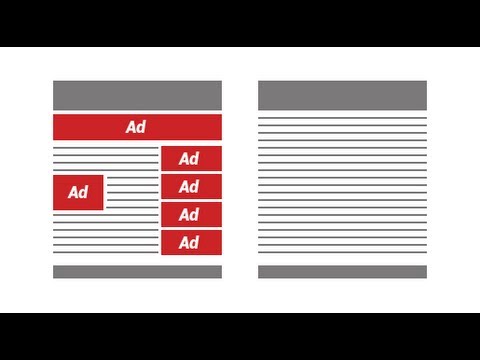
Another key provision is warning against advertising content mimicking the look and feel of surrounding editorial content – things like the layout characteristics, headline design treatment, the use of fonts and photography.

And here’s another kicker: the FTC lumps offending advertisers in the same pile as the people who create the materials, in that its policy statement doesn’t apply just to advertisers.  So ad agencies, MarComm companies and graphic designers, beware.

Quoting again from the FTC document:

“In appropriate circumstances the FTC has taken action against other parties who helped create deceptive advertising content – for example, ad agencies and operators of affiliate advertising networks. Everyone who participates directly or indirectly in creating or presenting native ads should make sure that ads don’t mislead consumers about their commercial nature. 

“Marketers who use native advertising have a particular interest in ensuring that anyone participating in the promotion of their products is familiar with the basic truth-in-advertising principle that an ad should be identifiable as an ad to consumers.”

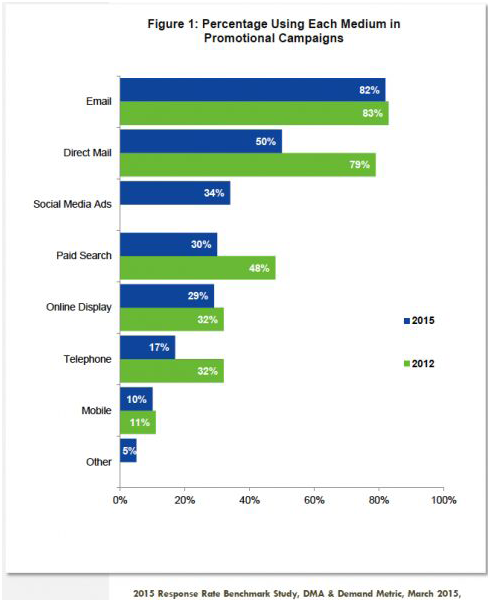
Of course, these new guidelines are only going to make it harder for advertisers – and publishers – to be able to utilize advertising techniques that have, up to now, been far more effective than online display advertising.

iab-logoPredictably, we’re hearing mealy-mouthed statements from the industry in response. A spokesperson for the Interactive Advertising Bureau had this to say:

“While guidance serves great benefit to the industry, it must also be technically feasible, creatively relevant, and not stifle innovation. To that end, we have reservations about some elements of the Commission’s guidance.”

What bothers the Interactive Advertising Bureau in particular is the “plain language” provisions in the FTC’s guidelines, which IAB considers “overly descriptive.”

Translation: there’s concern that publishers can no longer label advertising using such euphemisms as “partner content” or “promoted post.”

Others seem less concerned, however. Sites such as Mashable and Huffington Post appear to be onboard with the new guidelines.

Besides, as one spokesperson said, “When the FTC issues guidelines, you’re better off when you follow them than when you don’t.”

… That sounds about right.

Consumer E-Mail Marketing: Too Much of a Good Thing?

igAdvertisers often complain about the drawbacks of online display advertising — and it’s not hard to figure out why.

Online display ad viewability, which is defined by the Media Rating Council as at least 50% of an ad’s pixels being in-view for at least one continuous second, is running under 45% these days — meaning that fewer than half of online display ads meet the definition of being viewable.

That’s actually a lower percentage than before; viewability charted closer to 50% in 2014, according to the global media valuation platform Integral Ad Science.

Because of these middling viewability rates, many advertisers look to e-mail marketing as the panacea. Not only is e-mail marketing inexpensive, the rational goes, it’s also more likely to attract and engage recipients.

But here too, the evidence is that there is mediocre visibility, too. And in this case, it’s actual willful ignorance.

According to the results of a study conducted earlier this year by business technology research firm Technology Advice, ~40% of the ~1,300 U.S. adults surveyed reported that they completely ignore marketing-oriented e-mails.

Of the ~60% who reported that they do open marketing e-mails, only a little over 15% do so on a regular basis.

Here’s a breakdown of the underwhelming stats that were gathered by Technology Advice:

  • ~58% of recipients read from 0 to 25% of marketing-oriented e-mails sent to them
  • ~21% read 25% to 50% of the marketing e-mail sent to them
  • ~13% read 50% to 75% of them
  • Just ~8% read 75% to 100% of them

In an attempt to “juice” these figures, marketers are experimenting with robust personalization in e-mails that become evident even before anyone opens them (e.g., personalization showing in the subject line), along with offering clearly marked discounts and other promo attractions.

In this regard, consumers do expect businesses to provide “value” in exchange for their attention, which explains by ~40% of the survey’s respondents are responding to discounts and similar promotional offers above all other types of e-communiqués.

But with such modest levels of people interacting with any marketing-oriented e-mails at all, there’s a question as to how whether these ploys to improvement engagement are just nibbling around the edges.

Because the reality is, there’s a big portion of the market that’s become jaded about e-mail.

Another approach seems counter-intuitive but just might be working better: reducing the frequency of e-mail solicitations from advertisers.  That theory is supported by the Technology Advice research, which found that nearly 45% of respondents feel that businesses would improve their marketing effectiveness by actually sending them less frequent e-mails.

A case of “less is more”? Probably so.

The Ad Fraud Gravy Train Keeps Chugging Along — No Matter What …

xbnAd fraud is quite a large issue for online advertisers – and it’s been on many companies’ radar screens for a long time.

But even with the higher visibility and greater scrutiny of online ad fraud, it seems to be a problem that only gets bigger.

The most recent example of the phenomenon came to light a few weeks ago, when ad fraud prevention consulting firm Pixalate announced that a newly discovered botnet has been draining literally billions of dollars from advertisers’ MarComm coffers.

The botnet is dubbed Xindi – the same name as the hostile aliens in the Star Trek sci-fi TV series.

Xindi is making money for its creators by serving actual ads – but to simulated audiences.  It has spread via familiar methods such as phishing.

Pixalate estimates that just shy of 78 billion fake ad impressions have been racked up so far.  Even at low cost-per-impression revenue figures, the high volume amounts to several billions of dollars of illicit revenues siphoned (and counting).

What makes the Xindi botnet particularly nettlesome is that it’s designed to go after computers and networks at high-end organizations, enabling it to “mimic” desirable web traffic (i.e. affluent consumers).

xbotAccording to Pixalate, already there could be as many as 8 million computers compromised in more than 5,000 networks, including a goodly number of Fortune 500 companies as well as university and governmental networks.

Such desirable locations and ad audiences translate into lucrative online ad pricing (CPMs of $200 or more).

In the event, advertisers are paying high prices … for nothing.

To counteract Xindi, Pixalate recommends that the Internet Advertising Bureau update its protocols to factor in the pace of ad requests, so that impression generated after a certain time period cannot be accepted as valid — and hence would be non-billable.

Whether this or other remedies will actually happen is up in the air at the moment (the IAB isn’t onboard with the recommendations).

Either way, what seems clear is that whatever the remedial actions that are taken, burgeoning ad fraud activity is bound to continue.

The question is, can it ever be contained, or will it just continue to grow and grow?  If you have any thoughts or ideas on the challenge, please share them with other readers.

The lifetime value of a blog post: It’s more than you probably think.

bgHere’s an interesting factoid: In 2014, more than 550 million blog posts were uploaded on WordPress alone.

Add in Tumblr, and there are another 250 million blogs.

Considering the sheer volume of blogging activity, it’s surprising how little intelligence on the “value” of a blog post has been available. But now a study has been published that sheds light on the question.

The evaluation, which was commissioned by branding agency IZEA and conducted by research firm The Halverson Group, has determined that the lifespan of a blog post is far greater than the accepted measurement of 30 days.

The lifespan is more than 20 times longer, it turns out.

Let’s break down the research findings a bit more. The IZEA/Halverson study determined that by Day 700 (about two years), the typical blog post will have received ~99% of its impressions.

That’s a pretty long annuity, and it provides strong ammo for marketers who advocate for blog posts as an important way to maximize the return on their marketing spend.

According to the study, the typical blog post goes through three distinct phases in its useful life:

  • Shout: The initial spike in impressions that happens within the first 7 to 10 days, typically resulting in half of the total impressions the post will ever receive.
  • Echo: The period ending at 30 days, by which time the typical blog post will have racked up ~70% of its total impressions.
  • Reverb: The third phase that stretches from approximately Day 30 all the way to Day 700. This long-tail phase will typically generate the final ~30% of impressions.

Of course, the performance of individual blog posts will depend on the subject matter, the timeliness of the information, and other factors. But as a general rule of thumb, the Halverson findings show the potential value of a blog post as far greater than many marketers may have surmised up until now.

The Halverson study also provides a good rule of thumb for the lifetime impression value of a blog post. It can be calculated by multiplying a blog post’s 30-day monthly pageview total by a factor of 1.4.

In other words, by Day 30, marketers can know with a good deal of confidence how the blog post will perform overall.

Using this formula, marketers will be able to demonstrate the “evergreen” effect of blogging as a marketing tactic.

Certainly, the residual benefits of a blog post look very strong — particularly in contrast to volume-based media such as display or search advertising, which stop performing the instant the campaign investment ends.

The bottom line: Companies should continue to blog away … and if they haven’t started or if they’ve allowed their blogging program to flag, it’s time to get things back in gear!

Six years on … and the U.S. ad economy is still in recession?

recession recoveryTwo reports from advertising research sources released in the past month reveal that the advertising field doesn’t appear to be rebounding in strongly – at least not to same degree as the economy as a whole.

One report, from U.S. Ad Market Tracker, is an index that pools electronic media buys processed by major agency holding companies and their brand marketers.

It’s true that this report shows an increase in the overall ad activity index year-over-year of about 18 points (it’s 184 today … 166 a year ago … and 100 back in the recession year of 2009).

But when we look at the breakdown where most of the advertising growth is coming from, it’s nearly all from a handful of categories: social media advertising, advertising on video, Internet radio, plus ad network marketplaces.

By contrast, search advertising is growing at a much slower rate, and the most “commoditized” segments – particularly online display advertising – are doing little better than treading water.

This isn’t the robust rebound that many business and ad industry observers were expecting to see by 2015.

advertisingOver at Kantar Media, the statistics are even less encouraging.

In fact, Kantar projects that the 2015 ad economy will underperform U.S. economic growth for the fifth straight year.

Considering how lethargic in general the U.S. economy has been over that period, to be growing at less than the average is almost an indictment of the industry.

That’s what Kantar Media Chief Research Officer Jon Swallen suggests:  a “streak that might have once seemed unimaginable, but now would seem par for the course.”

Second-quarter 2015 data released by Kantar estimates annualized measured media ad spending declines in the neighborhood of 4%.

More to the point, Kantar is seeing increases in just 7 of the 22 individual ad media categories it tracks, led by the same categories U.S. Ad Market Tracker identifies as the most healthy ones.

Perhaps a surprise — considering the overall disappointing numbers — is that Kantar has tracked two analogue categories as experiencing growth:  radio and out-of-home advertising.

But print continues to decline at pronounced rates, and Internet display advertising has also officially joined the ranks of media segments that are contracting.

Is the disappointing performance of advertising a function of a weak market overall?  Or is it the result of structural changes and the reallocation of promo dollars into different, in some cases non-advertising MarComm vehicles?

I’m not completely sure.  It’s true that certain advertising categories that are “newer” ones are attracting more attention (and more dollars).  But Kantar’s 2nd Quarter reporting of advertising expenditures by major industry category finds just one – one – segment that has experienced an overall increase year-over-year — pharmaceuticals:

Ad economy chart

When just one industry segment out of ten is showing an increase, it suggests more than just some restructuring or re-jiggering is going on. Instead, it’s just as likely that the U.S. advertising economy remains stuck in a recession, even if the overall economy has finally emerged from it.

What are your thoughts on the tepid advertising results? Please share your views with other readers.

In case you’re wondering … consumers don’t really care about brands all that much.

branding“I don’t want a ‘relationship’ with my brands.  I want the best products at the best price.” — Jane Q. Public

In the era of interactive marketing and social media, there’s often a good deal of talk about how certain brands are successfully engaging their customers and creating an environment of “brand love” — or at least “brand stickiness.”

It’s not only consumer brands like Chipotle and Under Armour, but also B-to-B and hybrid brands like Intel, Apple and Uber.

As a person who’s been involved in marketing and advertising for well over a quarter-century, I tend to treat these pronouncements with a little less open-mouthed awe than others.

I get how when a brand is particularly admired, it becomes the “go-to” one when people are in the market for those particular products and services.

But the idea that there’s real “brand love” going on — in a sense similar to people forging close relationships with the people in their lives — to me that’s more far-fetched.

The marketing research I’ve encountered appears to refute the notion as well.

Case in point: In an annual index of “meaningful brands” published by the Havas MarComm agency, the research finds that very few consumers cite brands they “can’t live without.”

The 2015 edition of the Havas Meaningful Brands Index has now been released … and the results are true to form. Among U.S. consumers, only about 5% of the 1,000 brands evaluated by Havas across a dozen industries would be truly missed if they were no longer available.

It’s a big survey, too:  Havas queried ~300,000 people across 34 countries in order to build the 2015 index. Broadly speaking, the strength of brands is higher in countries outside the United States, reflecting the fact that trust levels for leading brands in general are higher elsewhere — very likely because lesser known brands or “generics” have a greater tendency to be subpar in their performance.

But even considering the brand scores globally, three out of four consumers wouldn’t miss any brands if they suddenly disappeared from the market.

What are the exceptions? Looking at the brands that scored highest gives us clues as to what it takes to be a brand that people truly care about in their lives.

Samsung is ranked the #1 brand globally. To me, it makes perfect sense that the manufacturer of the most widely sold mobile device on the planet would generate a strong semblance of “brand love.”

Even in the remotest corners of the world, Samsung has made the lives of countless people easier and better by placing a powerful computer in their pocket. It’s only logical that Samsung is a brand many people would sorely miss if it disappeared tomorrow.

The second strongest brand in the Havis index is Google. No surprise there as well, because Google enables people to research and find answers on pretty much anything that ever crosses their minds. Again, it’s a brand that most people wouldn’t want to do without.

But beyond these, it’s plain to see that nearly all brands just aren’t that consequential to people’s lives.

With this in mind, are companies and brands spending too much energy and resources attempting to get customers to “care” about them more than simply to have a buying preference when the time comes to purchase products and services?

Brand-LoyaltyRelated to that, is adding more “meaning” to a brand the answer to getting more people to express brand love? Or does it have far more to do with having products that meet a need … work better than competitors’ offerings … and are priced within the means of more people to purchase?

Havas — and common sense — suggests it’s the latter.

Do that stuff right, and a company will earn brand loyalty.

All the rest is just froth on the beer … icing on the cake … good for the psychological bennies.


… And then there were two: Facebook is nipping at YouTube’s heels.

Facebook “grows up great” to challenge YouTube for video supremacy online.

FB vs YTOnly few years ago, YouTube was pretty much the only game in town when it came to online video.  And Facebook wasn’t even in the picture.

Today, the online video landscape looks far different.

In fact, Facebook is on track to deliver more than two-thirds as many video views as YouTube this year.  And both services have a comparable number of monthly users overall.

Recently, market forecasting firm Ampere Analysis surveyed ~10,000 consumers in North America and Europe.  Approximately 15% of them had watched at least one video clip on Facebook within the past month.

While Facebook hasn’t exactly caught up with YouTube, its rise has been pretty stunning — especially when you consider the massive head-start YouTube had.  More than five years, in fact, which is a lifetime in the cyberworld.

Undoubtedly, one reason for Facebook’s success in video is its “autoplay” feature which snags viewers who might otherwise scroll by video postings.  Facebook reports that it has experienced a ~10% increase in engagement as a result of adding this functionality.

And there’s another big advantage for advertisers that Facebook possesses.  Since its viewers are always logged in, Facebook has the potential to collect far more demographic and behavioral data on its viewers that advertisers can tap into to target specific demographics.

For now at least, Facebook doesn’t offer the option for ads to run before video clips begin playing (the ads appear after the content).  Also, Facebook’s ad charges kick in after just three seconds of the ad being shown, compared to YouTube which sets the bar higher for ad charges to take effect.

[Incidentally, Twitter has the same 3-second policy as Facebook, whereas Hulu charges only for ads viewed all the way through.]

Another difference is that Facebook charges for every ad view, so if a viewer watches a video twice — even if it’s the same video in the same viewer session — Facebook counts it as two views.  On YouTube, that would be considered one view, regardless of how many times the video is watched.

Of course, these kinds of differences can be adjusted — and there’s no reason to think that Facebook won’t do just that if it determines that making those changes are in their best business interest.

Besides, advertising rates are already similar between the two platforms, which suggests that advertisers have come to place a high value on Facebook’s robust audience targeting.

Autoplay features have raised some questions as to what constitutes a true video “view.”  If video ads are being autoplayed, views are easier to get, but are they worthwhile?  Also, the fact that autoplay videos are running without sound until such time as the viewer chooses to engage is causing some advertisers to create content that “make sense” even on mute.

But the bottom line on Facebook’s foray into video seems to be that the demographic and psychographic audience targeting Facebook can deliver is of important value to advertisers.

Add the fact that YouTube is no longer the only major online video platform, and it’s easy to see how significant competition from Facebook risks the loss of advertising dollars for YouTube, along with damaging YouTube’s growth prospects over time.

This is getting interesting …

(Still) Too Much Irritating Online Advertising

online advertisingTime was, the online experience was blissfully free of annoying advertising.  (Of course, that was back in the very early days of the Internet.)

Then things got pretty bad pretty quickly, as publishers became forced to find ways to make up for lost advertising revenues from their print vehicles.

One of the most egregious examples of the explosion in online advertising were pop-up and pop-under ads.

So infamous, in fact, that an entire industry of ad blocking software sprang up, eventually providing the ability to eradicate most of them.

Not all of them, of course, but enough so that for those who use the programs, those ads are no longer quite as pernicious as before.

And yet … the arsenal of publisher’s revenue-generating ad tricks is still quite large — and pretty irritatingly effective, too.  Here are the most pervasive ones:

Slideshows – Some publishers use a picture slideshow format at every opportunity as a way of increasing page views and ad impressions.  Each click to view the next slide means more opportunities to collect revenue from serving up more display ads.  Using this scheme, publishers can end up with ten times the ad volume compared to if they had presented the information and images on a single page.

Pagination – Related to the slideshow scheme is the idea of publishing an online news story on two or three pages, whereas it could easily have been presented on just one.  If you ask people, most would be quite happy simply scrolling down the page to read the entire story.  On the other hand, publishers love this tactic because it enables them to double or triple their ad impressions.

Autoplay video – Even though most viewers hate autoplay videos, publishers think this tactic is great because they can gain revenue from video serves without having to wait until a user clicks on it to play.

Autopage refreshing – The obnoxious practice of refreshing and reloading a web page every 30 or 60 seconds has little to do with fresh new content being added to the page – unless that “fresh new content” is new advertising impressions.  And that’s precisely why it happens – so that publishers can get credit and revenues from significantly more ad impressions than they would otherwise.

Add to these techniques the age-old practice of attracting attention via “cheesecake” or other questionable images – no matter that they have nothing to do with the product or service being promoted – and you have a veritable rogues gallery of obnoxious “tips and tricks” – all designed to serve up as many ads as possible and generate Potemkin Village-like “engagement” along with the heightened ad revenues.

And who’s surprised?  After all, it’s only “mere money” we’re talking about …

If you find certain advertising practices particularly detrimental to your online experiences, I’m sure other readers would love to hear about them.  Please share your thoughts in the comment section below — and what you’ve done about it in response.

On the march: Ad blocking tools continue their rise in popularity.

What Adblock PromisesI’ve blogged before about the rise of online ad blocking tools and their growing popularity with consumers.

One example:  AdTrap – a device that intercepts online ads before they reach any devices that access a person’s Internet connection.

AdTrap’s motto is simple and powerful:  “The Internet is yours again.”

In the months and years since I first blogged about it, ad blocking has only become more popular – so much so that it’s no longer just a mild irritant to advertisers and publishers, but rather a commercial threat that has a significant impact on publishers’ financial bottom lines.

It’s hardly surprising.  Most people want to run as far away from advertising as they can.  For years, we’ve taken trips to the kitchen or bathroom during TV commercial breaks.  We’ve TiVo’d ads out of existence.

And the participation levels in online ad blocking bear this out now as well.  According to data from PageFair, a company that measures publishers’ ad blocking rates and provides alternative non-intrusive advertising options, the number of ad blocker tool users reached nearly 145 million people in 2014.

That’s more than five times the 21 million users of ad blocker tools we had in 2010.

Growth continues apace:  Adblock Plus, which is the biggest of the ad blocking tools, reports more than 2.3 million downloads each week, on average.

Where are people blocking online ads?  In all sorts of areas.  But the most frequent incidence of ad blocking is on gaming sites, where blocking rates are in excess of 50%.

But blocking is happening on other online sites, too, including entertainment, fashion and lifestyle sites – albeit at about half the degree as on gaming sites.

[Tellingly, ad blocking is happening on technology sites, too, where about a quarter of the ads are being blocked.]

One of the more interesting nuggets of information reported by PageFair is the difference in ad blocking rates by country.  What we see is that Americans lag well-behind a number of other countries:

  • Argentina: ~34 of online ads are blocked
  • Poland: ~34% are blocked
  • Sweden: ~33%
  • Finland: ~32%
  • Germany: ~30%
  • United States: ~15%

Germany, in particular, has been the scene of several fervent legal skirmishes in recent years.  There, the publisher of the news magazine Die Zeit sued the parent company of AdBlock, claiming that the ad blocking tool is “illegal and anti-competitive.”  (The suit went nowhere, incidentally.)

Some observers speculate that the higher incidence of ad blocking in certain countries may be tied to those nations’ sociological profiles.  “I personally suspect that in some of these countries, citizens are more concerned about their personal privacy – perhaps for historical reasons,” Sean Blanchfield, PageFair’s CEO, has remarked.

One might wonder if, in the age of Edward Snowden and the Patriot Act (now superseded by new legislation ironically called the “USA Freedom Act”), Americans’ ad blocking practices might now be poised to align more closely with Europeans’.

I imagine we’ll know more about that degree of convergence within a year or two.

What are the latest trends in the popularity of different marketing communications channel tactics?

The DMA’s 2015 Response Rate Report provides answers.

marketing channelsPeriodically, the Direct Marketing Association conducts field research to take the pulse of marketers and the various channels they’re employing to support their marketing campaigns.

In the DMA’s most recent survey, conducted online this past December and January, marketers were asked which one of seven channels they utilize in their campaigns.  The seven choices listed were the following:

  • Direct mail marketing
  • E-mail marketing
  • Mobile marketing
  • Online display advertising
  • Paid search advertising
  • Social media advertising
  • Telemarketing

The results of the survey show that e-mail marketing remains King of the Hill when it comes to its popularity as a MarComm channel, with more than four in five marketers including the tactic as part of their promotional campaigns:

  • E-mail: ~82% use as a medium in promotional campaigns
  • Direct mail: ~50% use
  • Social media advertising:  ~34% use
  • Paid search: ~30% use
  • Online display advertising:  ~29% use
  • Telemarketing: ~17% use
  • Mobile marketing: ~10% use

Clearly, the research findings show that marketers are using multiple channels in their campaigns:  Two-thirds of the survey respondents use more than one channel, and around 45% of them reported that they’re using three or more channels in their promotional campaigns.

Social media advertising is a new entrant on the list in the DMA research.  It wasn’t even included in the DMA’s 2012 survey, yet today appears to be an important part of the channel mix.

On the other hand, mobile marketing remains a channel that isn’t being utilized by very many marketers — at least not yet.  In a similar survey conducted by the DMA in 2012, its adoption rate was similar to what the 2015 survey has found.

The graph below compares 2015 and 2012 survey results.  Aside from the lack of movement with mobile marketing, another interesting trend is the significant decline in the utilization of direct mail marketing.  Back in 2012, it rivaled e-mail marketing in popularity.  Today, only half of the marketers surveyed continue to use it as a marketing channel.

And a third big trend is the utter collapse of telemarketing as a popular MarComm channel — likely happening under the twin weight of high costs and massive phone message filtering.

DMA chart

In terms of future anticipated usage, the DMA research found that marketers are, in fact, warming to mobile marketing.  It and social media advertising are the two channels that have the best prospects for new adoption, based on the future intentions reported by these respondents.

The 2015 DMA report is available for purchase here.