It’s common knowledge that the business model for newspapers started going awry in a major way with the decline in newspaper classified advertising.
Craigslist played a huge role in that development, as the online classifieds site went about methodically entering one urban market after another across the United States.
And now we have quantification of just how impactful Craigslist’s role was. It comes in the form of a May 2013 study authored by Robert Seamans of New York University’s Stern School of Business and Feng Zhu of the University of Southern California.
Titled Responses to Entry in Multi-Sided Markets: The Impact of Craigslist on Local Newspapers, the study explored the dynamics at play over the period 2000-2007, focusing on newspapers’ degree of reliance on classifieds at the time of Craigslist’s entry into their markets.
What the researchers found was that those newspapers that relied heavily on classified ads for revenue experienced more than a 20% decline in classified advertising rates following Craigslist’s entry into their markets.
But that isn’t all: The outmigration of classified advertising to Craigslist was accompanied by other negative trend lines — an increase of subscription prices (up 3%+) and lowering circulation figures (down nearly 5%).
Even newspaper display advertising rates fell by approximately 3%.
Were these developments “cause” or “effect”? The study’s authors posit that fewer classified ads may have diminished the incentive for people to purchase the newspapers. Also, display advertising rates tend to track circulation figures, so once the “decline cycle” started, it was bound to continue.
The study concludes that by offering buyers and sellers a free classified ad alternative to paid listings in newspapers, Craigslist saved users approximately $5 billion over the seven-year period.
Those dollars came right out of the hides of the newspapers, of course … and changed the print newspaper industry for good.
But here’s the thing: The experience of the newspaper industry has relevance beyond just them. “The boundaries between media industries are blurred and advertisers are able to reach consumers through a variety of platforms such as TV, the Internet and mobile devices,” the authors write.
The unmistakable message to others in the media is this: It could happen to you, too.
Ex-Cong. and New York City mayoral candidate Anthony Weiner hasn’t been the only one misbehaving on social media.
Chipotle Mexican Grill also gets a time-out to sit in the corner for its social media hi-jinks.
It turns out that a supposed hacking of Chipotle’s Twitter account in mid-July was nothing more than a ploy to grab attention and gain more Twitter followers.
For those who haven’t heard, Chipotle’s Twitter stream appeared to have been hacked as a series of bizarre and nonsensical tweets were posted over the span of several hours – until the company claimed to have solved the problem.
As it turned out … the whole thing was completely manufactured – all of those crazy tweets published by the company itself.
A few days later, a Chipotle spokesperson came clean, admitting that the whole episode was actually a carefully orchestrated effort to gain more Twitter followers, in concert with the company’s 20th anniversary.
Did it work? Evidently yes … because Chipotle had ~4,000 more Twitter followers at the end of the campaign than it did at the beginning.
But some marketing professionals were critical of the ploy. Here are a few representative comments:
“Chipotle is a brand about honesty and authenticity; faking a hack if off-brand.” (Rick Liebling, Y&R Creative Culturalist)
“Most of these stunts … strike me as being pretty lazy. It’s like making your CEO do a press conference drunk and then apologizing for it once he sobers up.” (Ian Schafer, Deep Focus CEO)
“Chipotle’s pico de gallo was more ‘weak sauce’ than ‘muy caliente.’”(Saya Weissman, Digiday Editor)
On second thought, perhaps it’s not such a good idea to “mess with the market” when upside is a few additional social media contacts (that probably won’t stick around), and the downside is brand irritation or even humiliation.
After all, Chipotle’s net gain in Twitter followers represented an uptick of just 1.7%.
That seems a bit paltry considering the potential blowback and reputation risk.
Many people I speak with have set up personal or corporate Google+ accounts for the sake of having a full presence in social media, but Google+ represents very little (in some cases none) of their activity.
Speaking personally, I don’t have a Google+ account, nor do I have any future plans to establish one.
Why? “So many platforms … So little time …”
And now, a new analysis has been published that reinforces the perception that Google+ isn’t all that consequential in the social media realm.
The evaluation comes in the form of a report by Gigya, a developer of social media plugins, gamification and other services. Its findings reveal that only about 2% of social sharing happened on Google+ during the second quarter of 2013 (April through June).
Instead, social sharing is far more “happening” in three other social zones: Facebook (50% of all share activity); Twitter (24% of share activity) and Pinterest (16% of activity).
These same three social sites are the top sharing destinations from e-commerce sites as well as publishing/media sites, too – whereas Google+ is stuck at the same 2% level.
If anything, Pinterest is the “breakout star” in this constellation.
What does Google have to say about these rather sorry-looking statistics, more than three years after the debut of its Google+ social platform?
Google argues that a significant degree of sharing on Google+ happens “privately,” making the activity invisible to data crawling.
But that’s not how Gigya has captured the data; it’s measuring clicks via social tools that are embedded on its client sites (Gigya serves more than 700 brands including ones like ABC, Verizon, Nike and Toyota).
And under that scenario, it’s still clear that very few visitors are clicking to share any Google+ content.
Searchmetrics and other groups have posited that Google+ sharing might overtake Facebook by 2016. But upon closer examination, it appears that these predictions are the result of questionable definitions: +1 clicks on Google+ aren’t the same thing as “shares” on Facebook. A more fitting comparison would be Facebook “likes.”
Viewed on that basis, Google appears to pose no threat at all – short- or long-term – for overtaking Facebook in the social media marathon.
Are any readers using Google+ for the majority of their social media interactions? If so, I’m interested to hear what you like best about the platform – and why you might prefer it to the alternatives. Certainly, if the rest of us are missing something, we want to learn about it!
On the other hand, if you’re like me and giving Google +1 pretty wide berth, let us know why as well. Please feel free to leave a comment.
With the ever-growing options for where people spend their time when online, what’s the latest in terms of their online behaviors?
That’s the question The Buntin Group, a MarComm and branding agency, and Survey Sampling International (SSI) were trying to answer when they conducted a survey of American web users in May 2013.
The survey was conducted among adults who use at least two tech platforms (including e-mail, text or social) to connect with others during a given week.
What the survey found is that Americans are spending more time than ever online – about 23 hours per week on average. That’s nearly a full day out of a seven-day week.
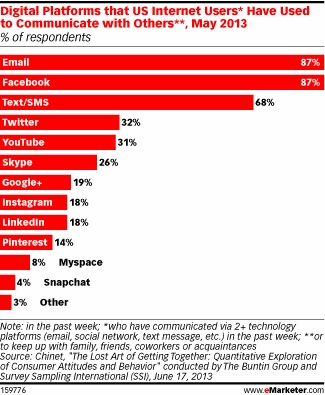
Drilling down further, the survey found that e-mail communications continues to be the most prevalent online activity, but it’s followed closely by Facebook:
Average time per week spent on e-mail communications: 7.8 hours
Average time spent on Facebook: 6.8 hours
Average time spent on YouTube: 5.0 hours
Average time on Google+: 4.3 hours
Average time on Twitter: 4.2 hours
In keeping with these findings, the survey also found that e-mail and Facebook are where most respondents log in most often to communicate with others:
But here’s another interesting finding from the survey: From time to time, even the most digitally connected people find themselves fatigued by all of their online activity.
In fact, nearly 55% of the survey respondents reported that they had “walked away from technology at least occasionally” in the past year to gain more in-person time.
An even larger ~62% reported that they plan to reduce their “tech socializing time” in the upcoming year and instead focus on more face-to-face interaction.
Speaking personally, e-mail and YouTube are indispensable to me. Facebook is a “nice to have” platform when it comes to keeping up with friends and family — and I usually check in once a day. But I have gone as long as two weeks without logging on and haven’t felt worse for it.
“In the 1990s, we were taught that playing computer games would even sharpen our mental skills. But now this enormous increase in gadgets, [even] in the hands of five-year olds … is certainly alarming. This is causing some sort of disorder for sure. But then again, we can’t live without these gadgets now!”
This got me to wondering: I have two twenty-something daughters who are most definitely “wired” up one side and down the other. But is this behavior the norm or the exception?
I found some answers in the form of results from a new online survey of ~1,525 college students aged 18 to 34 conducted by market research firm Crux Research for re:fuel, a branding and media company. To be included in the survey, each respondent had to be taking at least one course on a physical campus.
With ~22 million U.S. college students expected to be enrolled for the 2013/14 college year, one would imagine the behaviors of this large group would track fairly closely with the overall behaviors of this age cohort.
What the re:fuel research shows is that the average American college student possesses seven devices in their technology “arsenal” (that’s up from six a year earlier). So it’s definitely a “gadget grab-bag” with these kids.
Laptops and smartphones lead the pack in popularity:
Laptop computer: ~85% of American college students own one
Smartphone: ~69%
Video gaming console: ~68%
MP3 player: ~67%
Printer: ~62%
Digital camera: ~61%
Flat-screen TV: ~60%
—————————————————
Desktop computer: ~48%
Tablet computer: ~36%
Handheld gaming system: ~35%
Feature phone: ~33%
Camcorder/video recorder: ~25%
E-reader: ~21%
Tivo/DVR: ~18%
The “break” we observe between ownership rates of 60%+ and below 50% is as much a function of changing tastes in digital equipment as anything else. “Old fashioned” feature phones are biting the dust as more college kids trade up to smartphones. In fact, the survey reveals that more than 30% of the respondents say they intend to purchase a new smartphone in the coming year.
[Considering the ownership rates that already exist, quite a few students will be trading up not from a feature phone, but from another smartphone.]
Who uses camcorders anymore, when so many smartphones take just as good-quality pictures?
Desktop computers? Why even bother?
There’s a good deal more information contained in the re:fuel college study — covering not only technology ownership but also student spending, online behaviors, media consumption habits, and engagement on social platforms. You can review report highlights here.
If you have college-age kids … or if you’ve been a student yourself recently, I’m interested to hear your perspective on these trends. Please share your thoughts.
It seems like a new “unintended consequence” of our digital age emerges every other week. Recently it’s been a spate of warnings about the dangers of texting while driving.
And now we have reports of a condition dubbed “digital dementia” that’s supposedly plaguing teens and Millennials.
This phenomenon is being reported out of South Korea, a country that happens to have the highest rate of smartphone adoption in the world. More than two thirds of all South Korean adults have a smartphone, and among teenagers, it’s nearly as high (~64%).
Indeed, according to the country’s Ministry of Science, smartphone adoption by South Korean teens has jumped more than 200% since 2011 when it was less than 22%.
So what is “digital dementia”? It’s described as the deterioration in cognitive abilities that comes from an imbalanced development of brain functions.
Commenting on the use of smartphones and gaming devices among young people, “Heavy users are likely to develop the left side of their brains, leaving the right side untapped or underdeveloped,” claims Byun Gi-won, a physician at the Balance Brain Centre in Seoul.
According to Dr. Gi-won, such overuse results in symptoms that are more commonly observed in people who have psychiatric illnesses or have suffered head injuries.
The country’s Ministry of Science estimates that nearly one in five South Koreans ages 10-19 use their smartphone seven hours per day or more. That’s up sharply from around 10% doing so just a year before.
Is the phenomenon of “digital dementia” among the young confined to South Korea or East Asia? Manfred Spitzer, a professor of neuroscience in Germany, thinks not. He’s the author of a book on digital dementia that was published in 2012, wherein he warned of the dangers of allowing children to spend too much time on electronic devices such as tablets, smartphones and game devices.
Do you recognize this face? Dr. Manfred Spitzer, author of “Digital Dementia.”
Dream on, professor. That’s certainly not going to happen!
Likewise, we have a recent study from the University of Southern California at Los Angeles that points to increasing memory problems among people ages 18-39. The UCLA report blames “modern lifestyles,” claiming that the many digital gadgets within easy reach of young people prevent them from developing memorization skills and other forms of focus.
On the other hand, that same UCLA study concludes that for some older patients suffering from mental decline, engaging in brain-fitness computer games like Luminosity or Posit Science’s Brain HQ have improved their language and memory skills significantly.
Considering that age-related memory decline affects as many as 40% of older adults, that UCLA finding may turn out to be as noteworthy on the positive side of the ledger as the South Korean one on the negative side about young people.
Like any other “transformational” technology, the digital revolution continues to play out in unexpected ways. Somehow, I expect us to be hearing many more reports of this type as the years roll on.
Not that these theories of cognitive weakness don’t have their detractors. You can read several strongly worded retorts here and here.
What do readers think? Big news … or bunk? Please share your thoughts here.
A marketing analytics firm is claiming that the average tweet on branded Twitter sites is worth a little over $25.
Yep, you read that correctly; $25.62, to be precise.
The revenue estimate comes to us courtesy of SumAll, a data visualization and analytics firm. It reached that conclusion after reviewing more than 900 of its customers’ social media program efforts. SumAll published its findings last week in an infographic.
To those who might look at the ~$25 figure and scoff (that may be most readers), it should be noted that once the total number of people who see an individual tweet is taken into consideration, the amount of revenue gained per impression is only about one half of one penny, on average.
To put this into context, $0.005 revenue-per-impression is lower than most other marketing tools and about on par for AdWords revenues-per-impression.
The imputed revenue from tweets amounts to about 1%-2% in incremental revenues, according to SumAll’s study group.
Not surprisingly, this announcement was met with questions … and some skepticism. Asked to explain further how SumAll came up with its results, a SumAll spokesperson replied on the company’s blog:
“… Our data comes from our own user base of over 30,000 people. We anonymize the data first and then aggregate all the data to derive new, interesting insights from a broad population. For this infographic, we collected data from all users who have a Twitter stream and commerce stream, and conducted some calculations to derive the value of each tweet.”
There, that should clear up matters nicely, right?
As if pre-anticipating the muffled sniggers or raised eyebrows in reaction to this “non-response response,” the blog response continued:
“This is obviously a little overgeneralized, but I hope that [it] clears some things up.”
The experience of our clients hasn’t approached what SumAll is reporting … but I’m interested in hearing what kind of results other companies may have experienced using Twitter as a social marketing platform. Any particularly positive stories (or negative ones) to report? Please share you observations here.
For most marketing professionals over the age of 30, the purchase funnel was one of the fundamental staples of their business training.
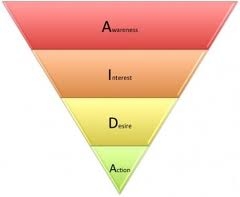
In fact, the famous “AIDA” model – which stands for awareness, interest, desire and action – was first posited as far back as 1898 by Elias St. Elmo Lewis, an American sales and advertising professional and business writer.
“AIDA” was also the inspiration behind the classic purchase funnel – an orderly, simple path consumers take on the way to selecting and purchasing a product or service.
AIDA has had a good run, because for more than a century, the AIDA purchase funnel has meshed neatly with the various advertising and MarComm tactics that have come along the pike – print advertising, direct mail marketing, radio, television – and even the Internet.
While some people might contend that the advent of the Internet disrupted traditional buying processes, the greater reality is that it brought certain aspects of the buying process into sharper relief. Search engine optimization and search engine marketing stepped in to play nicely within the “interest, desire and action” steps.
Even better, Internet marketing made ineffective “soft” attitudinal metrics less important; all of a sudden, it became much easier to make educated decisions about sales and marketing programs based on hard evidence.
But with social media taking center stage, everything is now scrambled. The tidy “linear” purchase process just doesn’t reflect what’s happening now that “interactivity all over the place” is the thing.
But what exactly is the new “thing” when it comes to the purchase process? There’s a lot of discussion … lots of thinking … but not much in the way of conclusions.
McKinsey’s new model has been described as a “purchase cycle,” a “customer journey,” and various other alternative explanations — you can take your pick.
But what exactly is that? When you look at how McKinsey attempts to graph it … it may be the proverbial “big ol’ mess.” I’ve pictured it here so you can try and have some fun with it.
The “McKinsey Whatever” may be hard to grasp pictorially, but there’s one thing’s about it: it’s surely not linear.
There are two circles (kind of). Consumers can go around within the circles forwards or backwards. They can also go sideways between the two (sort of).
Truth be told, the “McKinsey Thingamabob” is fairly difficult to untangle. At least that’s the claim of some business observers such as Jon Bond, a marketing specialist and cofounder of branding agency Kirschenbaum Bond Senecal. He writes this:
“I’ve been in 20 meetings where the ‘McKinsey Frankenfunnel’ has come up , and not once has anyone had the courage to admit that they didn’t have a clue what to do with it.”
Bond goes on to posit that introducing this new model was a masterstroke on the part of McKinsey (wittingly or unwittingly) because it’s become a boon to its consulting business: Companies have to hire McKinsey so the consulting firm can explain it, he notes wryly.
Whether it’s the McKinsey diagram or any other one that’s been proffered recently in an attempt to illustrate the new purchasing paradigm (one being a Google model with the eyebrow-raising acronym “ACID”) – what’s clear is that the purchase process is more complex then ever before. And in that process, the number of touchpoints has also grown dramatically.
Perhaps the best thing to do is to jump out of the funnel (or box, or circles, or whatever the purchase cycle is today). Instead of focusing on impressions or touchpoints, let’s remember the big thing that interactivity has placed in the hands of purchasers: far more opportunity to see and hear what trusted influencers are saying about products, services and brands.
It’s like going back to traditional, pre-1900 word-of-mouth advertising — and putting it on steriods.
Jon Bond contends that this new riff on WOM may be the smarter way of looking at the purchase journey a customer takes today. Instead of the “old AIDA” or the “new interactivity,” he suggests focusing more on three degrees of “trust“:
Before trust: Even if the brand is known, it’s not yet trusted because no credible third party has validated the brand in the eyes of the buyer.
Trust exists: An interaction happens with a trusted influencer who recommends the brand or has positive things to say about it.
Advocacy: Nirvana for companies, wherein a highly satisfied customer also becomes a brand advocate, providing third-party validation and attracting additional new customers because of the resulting brand credibility.
Incidentally, the above scenario is particularly effective in the B-to-B world, where credibility and the “CYA” impulse have always played big roles in guiding business buyers to make purchase decisions they won’t regret later.
Consider it the IBM principle, writ large: You’ve probably heard the adage that “nobody ever got fired for recommending IBM.” Now, in the “Age of Interactivity,” that principle can apply across the board.
There’s no denying the benefits of social media in enabling people to make new friendships, reconnect with old acquaintances, and nurture existing relationships.
Facebook and other social platforms make it easier than ever to maintain “in the moment” connections with people the world over.
Speaking for myself, my immediate relatives who live in foreign lands seem so much closer because of social media.
Plus, thanks to social media, I’ve met other relatives from several different countries for the very first time. This would never have happened in the pre-Facebook era.
Other negative consequences of social media have been noted by numerous observers of consumer online behaviors, including Canadian digital marketing company Mediative’s Senior Vice President and online marketing über-specialistGord Hotchkiss.
Gord Hotchkiss
In a recently published column by Hotchkiss headlined “The Stress of Hyper-Success,” he posits that self-regard and personal perspectives of “success” are relative. Here’s a critical passage from what he writes:
“We can only judge it [success] by looking at others. This creates a problem, because increasingly, we’re looking at extreme outliers as our baseline for expectations.”
Hotchkiss’ contention is that social media engenders feelings of stress in many people that would not occur otherwise.
Pinterest is a example. A recent survey of ~7,000 U.S. mothers conducted by Today.com found that ~42% of respondents suffer from this social media-induced stress; it’s the notion that they can’t live up to the ideal suggested by the images of domestic bliss posted on the female-dominated Pinterest social network.
Facebook causes a similar reaction in many; Hotchkiss reports on a survey showing that one-third of Facebook users “feel worse” after visiting the site.
It may not be hard to figure out why, either, as visitors are often confronted with too-good-to-be-true photo galleries chronicling friends’ lavish vacations, social gatherings, over-the-top wedding ceremonies, etc.
It’s only natural for people to focus their attention on the “extraordinary” posts of this type … and to discount the humdrum posts focusing on the mundane aspects of daily life.
Just like in the national or local news, people tend to focus on personal news items that are exceptional – the activities that are set far apart from the average.
“Aristotle wrote that friendship involves a degree of love. If we were to ask ourselves whether all of our Facebook friends were those we loved, we’d certainly answer that they’re not. These days, we devote equal if not more time to tracking the people we have had very limited interaction with than to those whom we truly love.”
Likewise, Hotchkiss tries to head us off at the social media pass:
“Somewhere, a resetting of expectations is required before we self-destruct because of hyper-competitiveness in trying to reach an unreachable goal. To end on a gratuitous pop culture quote, courtesy of Sheryl Crow: ‘It’s not having what you want. It’s wanting what you got.”
What are your thoughts about “social media stress disorder”? Please share your observations with other readers here.
For anyone who’s paying attention in business, “content marketing” is all the rage right now. That’s not surprising, considering that “content” is the common link between advertising, promotion, public relations and social media.
Each year, the Content Marketing Institute, working in conjunction with MarketingProfs and Brightcove, conducts research among B-to-B marketers to gauge the type of content marketing that is increasing in popularity. The CMI’s most recent report, B2B Content Marketing: 2013 Benchmarks, Budgets and Trends – North America has now been issued.
This report provides results from more than 1,400 surveys collected from North American members and subscribers of MarketingProfs and the Content Marketing Institute.
I think the survey is representative of business as a whole because the respondents include a mix of company sizes – ranging from fewer than 10 employees (~39% of the survey sample) to the very largest firms having more than 1,000 employees (~5% of the sample).
Respondent titles are varied, too – encompassing advertising/MarComm functions (~37%), corporate management (~31%) plus various other functions that handle marketing and communications as part of their responsibilities.
When we compare the results of the new survey to the one that was completed last year (I blogged about that survey here), we find that in nearly every category of B-to-B content creation, there is greater participation now. (The one exception is the use of print magazines.)
For the record, here is how B-to-B content activity breaks down today, from highest to lowest usage:
Social media: ~87% of respondents are using
Website articles (own site): ~83%
e-Newsletters: ~78%
Blogs: ~77%
Case studies: ~71%
Videos: ~70%
Website articles (other sites): ~70%
In-person events: ~69%
White papers: ~61%
Webinars and/or webcasts: ~59%
A number of other tactics are used by a minority of B-to-B respondents:
Research reports: ~44%
Web microsites: ~40%
Infographics: ~38%
Mobile content: ~33%
e-Books: ~32%
Print magazines: ~31%
“Virtual” conferences: ~28%
Podcasts: ~27%
Mobile apps: ~26%
Digital magazines: ~25%
Print newsletters: ~24%
Annual reports: ~20%
Gamification: ~11%
So it’s clear that “a lot of people” are employing “a lot of tactics” in content creation. But which ones do they feel are most effective?
An interesting finding of the survey measures the “confidence gap” between respondents who feel that certain content tactics are “more effective” versus “less effective.” Taking the difference between these two percentages yields a “confidence spread.”
This evaluation shows that B-to-B marketers consider a traditional tactic — in-person events – to be the most effective one:
In-person events: +34 “confidence gap” rating
Case studies: +28
Webinars and webcasts: +22
Blogs: +16
e-Newsletters: +16
Videos: +16
Research reports: +14
White papers: +14
e-Books: +10
Website articles (own site): +6
Website articles (other sites): +0
Web microsites: +0
And where are marketers publishing content? The survey finds that B-to-B marketers are using an average of five social media sites to distribute content, with the “usual suspects” coming in at the top of the list:
LinkedIn: ~83% of respondents use for distributing content
Facebook: ~80%
Twitter: ~80%
YouTube: ~61%
Google+: ~39%
Pinterest: ~26%
SlideShare: ~23%
Vimeo: ~12%
Flickr: ~10%
Foursquare: ~8%
Instagram: ~7%
Tumblr: ~7%
A number of these social sites didn’t even show up in last year’s results – Pinterest and Vimeo in particular, but also Tumblr, Instagram and Foursquare.
It really underscores how “fresh” things remain in the social sphere – and how marketers can’t afford to take their eye off of the ball even for an instant when it comes to the tactical considerations of content creation.
There are additional findings available from the CMI research report, which you can download here. And feel free to comment below on any of the results that seem particularly interesting (or surprising) to you.