
The American College of Sports Medicine changes its annual evaluation to comparatively evaluate cites rather than metropolitan areas.
 For the past decade, the American College of Sports Medicine has issued its annual American Fitness Index® report that identifies America’s healthiest urban areas.
Until this year, the index included America’s 50 largest metropolitan statistical areas (MSAs), but the decision was made in 2018 to switch to incorporated cities. The new Index covers the 100 largest such entities.
Why was the change made? According to the ACSM, the older approach “provided important and valuable general messages, but limited the ability to provide targeted assistance to city and community leaders that need specific data at the local level.”
In addition to allowing more localized data to be studied, the new approach enables cities in states that weren’t represented at all in previous years to be included.
As for the various health measures comparatively studied, they remain the same – 33 indicators available from up-to-date, publicly accessible sources.
 To build the ranking, the 33 indicators were combined to create sub-scores for “personal health” and “community and environment categories. Individual indicators were weighted relative to their impact on community fitness, and then combined to create the ultimate ranking.
The personal health indicators consisted of behaviors like eating habits, exercise and smoking as well as outcomes like health conductions (incidence of obesity, diabetes, heart disease, asthma, etc.)
Community/environment indicators covered factors like the built environment (parkland as a percent of city geographic size, walking/bicycle trails, etc.), recreational facilities (playgrounds, swimming pools, tennis courts, etc.), and policy and funding factors.
Putting it all together, America’s healthiest city achieves a 77.7 overall score (out of a possible 100.0 points). Shown below is the Top Ten ranking among America’s 100 largest cities for the ASCM’s American Fitness Index:
#1. Arlington, VA
#2. Minneapolis, MN
#3. Washington, DC
#4. Madison, WI
#5. Portland, OR
#6. Seattle, WA
#7. Denver, CO
#8. St. Paul, MN
#9. San Jose, CA
#10. Boise, ID
Notice the propensity of cities located in the northern reaches of the United States. Several of these I know first-hand, having lived and worked in the Twin Cities of Minneapolis-St. Paul. I completely understand that the ACSM’s report means when it cites the following factors for #2-rank Minneapolis:
“Building culture of physical activity isn’t done overnight. Minneapolis, MN reaps the rewards of early planning to set aside important parklands and establish a semiautonomous parks board to maintain and protect the lands, featuring over 6,800 acres in the park system and 102 miles of biking and walking paths.”
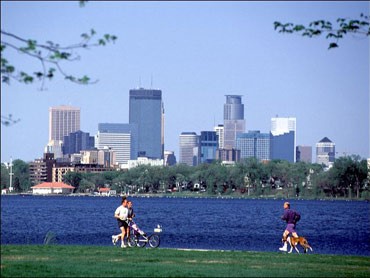
[It doesn’t hurt that Minneapolis has seven good-sized natural lakes plus a 20-mile meandering creek within the city limits; what else would one do but put parks, green spaces and trails around them? That would be a no-brainer decision even a century ago, when “fitness” wasn’t quite the same universally accepted aspirational goal.]
Commenting on Arlington as being the #1-ranked city, the ACSM’s report noted:
“Arlington, VA is home to the Pentagon, Arlington National Cemetery, Civil War battlefields, great local parks, as well as many people living healthy lifestyles.”

When we dip into the next group of 10 cities on the listing, we do see the appearance of several located in the southern portions of the country:
#11. Oakland, CA
#12. Plano, TX
#13. Irvine, CA
#14. San Francisco, CA
#15. Boston, MA
#16. San Diego, CA
#17. Lincoln, NE
#18. Raleigh, NC
#19. Fremont, CA
#20. Atlanta, GA
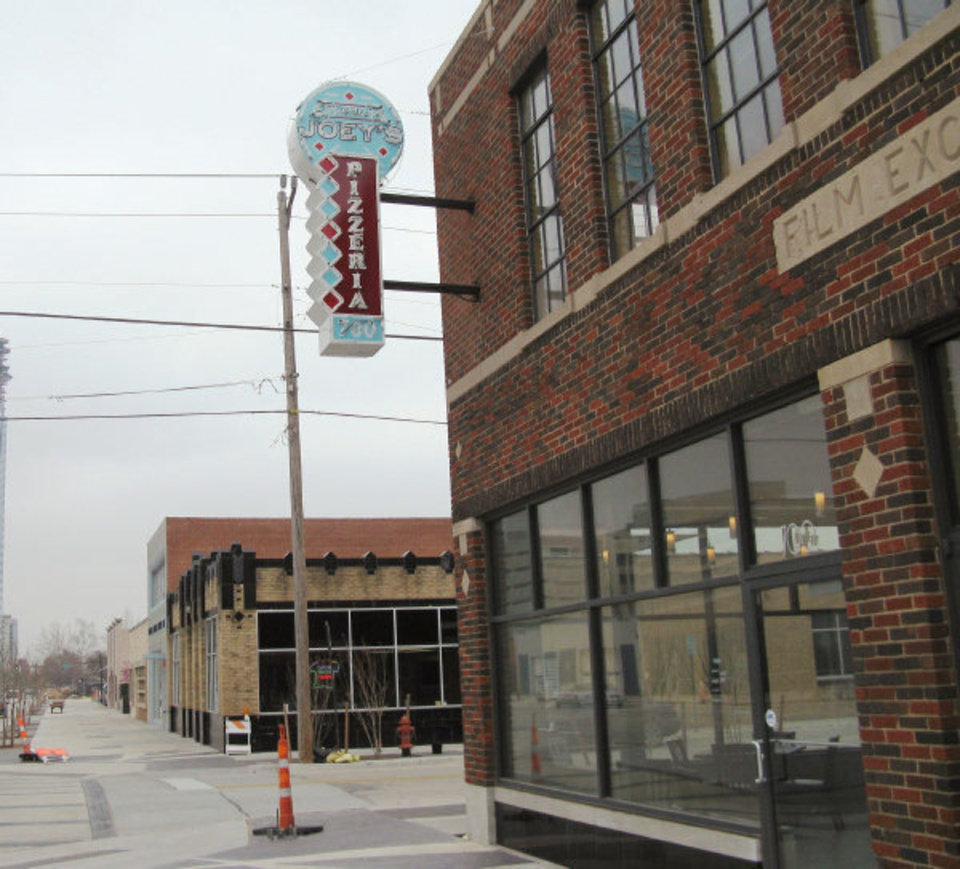
Who’s at the bottom of the heap? Some of the cities might not surprise you, but a few seem curious to me. How can it be that the two largest cities in Oklahoma end up at or near the bottom? And what’s up with Indianapolis and Louisville?
#91. Tulsa, OK
#92. North Las Vegas, NV
#93. Gilbert, AZ
#94. Fresno, CA
#95. Wichita, KS
#96. Toledo, OH
#97. Detroit, MI
#98. Louisville, KY
#99. Indianapolis, IN
#100. Oklahoma City, OK
If any readers have insights they can share about these “bottom of the barrel” cities, we’re all ears.
To find out how each of the 100 largest cities ranked in the 2018 ASCM evaluation — along with seeing details on the 33 indicators studied to build the American Fitness Index, click here.


